
SPECpower_ssj2008
Aggregate Performance Report
Copyright © 2007-2019 Standard Performance Evaluation Corporation
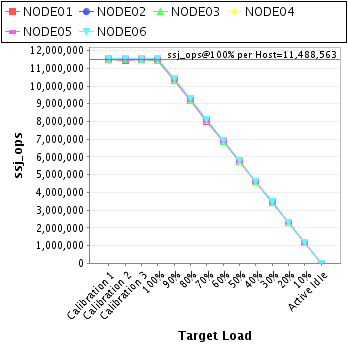
| Hewlett Packard Enterprise Synergy 660 Gen10 Compute Module | ssj_ops@100% = 68,931,378 ssj_ops@100% per Host = 11,488,563 ssj_ops@100% per JVM = 1,436,070 |
||||
| Test Sponsor: | Hewlett Packard Enterprise | SPEC License #: | 3 | Test Method: | Multi Node |
| Tested By: | Hewlett Packard Enterprise | Test Location: | Houston, TX, USA | Test Date: | Mar 9, 2019 |
| Hardware Availability: | Apr-2019 | Software Availability: | Mar-2019 | Publication: | Apr 2, 2019 |
| System Source: | Single Supplier | System Designation: | Server | Power Provisioning: | Line-powered |
| Target Load | Actual Load | ssj_ops | |
|---|---|---|---|
| Target | Actual | ||
| Calibration 1 | 69,121,984 | ||
| Calibration 2 | 69,072,117 | ||
| Calibration 3 | 69,150,641 | ||
| ssj_ops@calibrated=69,111,379 | |||
| 100% | 99.7% | 69,111,379 | 68,931,378 |
| 90% | 90.0% | 62,200,241 | 62,179,061 |
| 80% | 80.0% | 55,289,103 | 55,288,814 |
| 70% | 70.0% | 48,377,965 | 48,375,480 |
| 60% | 60.0% | 41,466,827 | 41,465,902 |
| 50% | 50.0% | 34,555,690 | 34,549,533 |
| 40% | 40.0% | 27,644,552 | 27,623,767 |
| 30% | 30.0% | 20,733,414 | 20,744,403 |
| 20% | 20.0% | 13,822,276 | 13,824,067 |
| 10% | 10.0% | 6,911,138 | 6,908,036 |
| Active Idle | 0 | 0 | |

| # of Nodes | # of Chips | # of Cores | # of Threads | Total RAM (GB) | # of OS Images | # of JVM Instances |
|---|---|---|---|---|---|---|
| 6 | 24 | 672 | 1,344 | 2,304 | 6 | 48 |
| Set Identifier: | SUT |
| Set Description: | System Under Test |
| # of Identical Nodes: | 6 |
| Comment: | SUT |
| Hardware per Node | |
|---|---|
| Hardware Vendor: | Hewlett Packard Enterprise |
| Model: | Synergy 660 Gen10 Compute Module |
| Form Factor: | blade |
| CPU Name: | Intel Xeon Platinum 8280 @ 2.70GHz (Intel Turbo Boost Technology up to 4.00 GHz) |
| CPU Characteristics: | 28-Core, 2.70 GHz, 38.5MB L3 Cache |
| CPU Frequency (MHz): | 2700 |
| CPU(s) Enabled: | 112 cores, 4 chips, 28 cores/chip |
| Hardware Threads: | 224 (2 / core) |
| CPU(s) Orderable: | 1,2,3,4 chips |
| Primary Cache: | 32 KB I + 32 KB D on chip per core |
| Secondary Cache: | 1 MB I+D on chip per core |
| Tertiary Cache: | 39424 KB I+D on chip per chip |
| Other Cache: | None |
| Memory Amount (GB): | 384 |
| # and size of DIMM: | 24 x 16384 MB |
| Memory Details: | 24 x 16GB 2Rx8 PC4-2933Y-R; slots 1, 3, 5, 8, 10 and 12 populated on each socket |
| Power Supply Quantity and Rating (W): | None |
| Power Supply Details: | N/A |
| Disk Drive: | 1 x HPE 480GB SATA 6G M.2 2280 (875498-B21) |
| Disk Controller: | HPE Smart Array S100i SR Gen10 |
| # and type of Network Interface Cards (NICs) Installed: | 1 x HPE Synergy 3820C 10/20Gb CNA |
| NICs Enabled in Firmware / OS / Connected: | 2/2/1 |
| Network Speed (Mbit): | 1000 |
| Keyboard: | None |
| Mouse: | None |
| Monitor: | None |
| Optical Drives: | No |
| Other Hardware: | None |
| Software per Node | |
|---|---|
| Power Management: | Enabled (see SUT Notes) |
| Operating System (OS): | Windows Server 2012 R2 Datacenter |
| OS Version: | Version 6.3 (Build 9600) |
| Filesystem: | NTFS |
| JVM Vendor: | Oracle Corporation |
| JVM Version: | Oracle Java HotSpot(TM) 64-Bit Server VM (build 24.80-b11, mixed mode), version 1.7.0_80 |
| JVM Command-line Options: | -server -Xmn19000m -Xms21000m -Xmx21000m -XX:SurvivorRatio=1 -XX:TargetSurvivorRatio=99 -XX:AllocatePrefetchDistance=256 -XX:AllocatePrefetchLines=4 -XX:LoopUnrollLimit=45 -XX:InitialTenuringThreshold=12 -XX:MaxTenuringThreshold=15 -XX:ParallelGCThreads=28 -XX:InlineSmallCode=3900 -XX:MaxInlineSize=270 -XX:FreqInlineSize=2500 -XX:+AggressiveOpts -XX:+UseLargePages -XX:+UseParallelOldGC |
| JVM Affinity: | start /NODE [0,1,2,3] /AFFINITY [0xFFFFFFF] |
| JVM Instances: | 8 |
| JVM Initial Heap (MB): | 21000 |
| JVM Maximum Heap (MB): | 21000 |
| JVM Address Bits: | 64 |
| Boot Firmware Version: | I43 v2.10 (01/18/2019) |
| Management Firmware Version: | 1.40 Feb 05 2019 |
| Workload Version: | SSJ 1.2.10 |
| Director Location: | Controller |
| Other Software: | HPE Service Pack for ProLiant (SPP) - Version 2019.03.0 (Mar 2019), Microsoft Windows KB4054519, and KB4056898 |
| Host | ssj_ops@100% |
|---|---|
| NODE01 | 11,437,893 |
| NODE02 | 11,502,528 |
| NODE03 | 11,464,274 |
| NODE04 | 11,509,232 |
| NODE05 | 11,473,104 |
| NODE06 | 11,544,346 |
| ssj_ops@100% | 68,931,378 |
| ssj_ops@100% per Host | 11,488,563 |
| ssj_ops@100% per JVM | 1,436,070 |
| Target Load | Actual Load | ssj_ops | |
|---|---|---|---|
| Target | Actual | ||
| Calibration 1 | 11,475,363 | ||
| Calibration 2 | 11,456,798 | ||
| Calibration 3 | 11,473,792 | ||
| ssj_ops@calibrated=11,465,295 | |||
| 100% | 99.8% | 11,465,295 | 11,437,893 |
| 90% | 90.0% | 10,318,766 | 10,321,869 |
| 80% | 79.9% | 9,172,236 | 9,163,958 |
| 70% | 69.9% | 8,025,707 | 8,015,001 |
| 60% | 60.0% | 6,879,177 | 6,878,170 |
| 50% | 50.0% | 5,732,648 | 5,736,395 |
| 40% | 40.0% | 4,586,118 | 4,588,181 |
| 30% | 30.0% | 3,439,589 | 3,442,037 |
| 20% | 20.0% | 2,293,059 | 2,290,997 |
| 10% | 10.0% | 1,146,530 | 1,144,538 |
| Active Idle | 0 | 0 | |

| Target Load | Actual Load | ssj_ops | |
|---|---|---|---|
| Target | Actual | ||
| Calibration 1 | 11,543,774 | ||
| Calibration 2 | 11,532,117 | ||
| Calibration 3 | 11,541,123 | ||
| ssj_ops@calibrated=11,536,620 | |||
| 100% | 99.7% | 11,536,620 | 11,502,528 |
| 90% | 89.9% | 10,382,958 | 10,369,315 |
| 80% | 79.9% | 9,229,296 | 9,223,340 |
| 70% | 70.1% | 8,075,634 | 8,081,974 |
| 60% | 60.0% | 6,921,972 | 6,922,323 |
| 50% | 50.0% | 5,768,310 | 5,764,637 |
| 40% | 39.9% | 4,614,648 | 4,608,159 |
| 30% | 30.0% | 3,460,986 | 3,457,201 |
| 20% | 20.0% | 2,307,324 | 2,305,185 |
| 10% | 10.0% | 1,153,662 | 1,150,387 |
| Active Idle | 0 | 0 | |

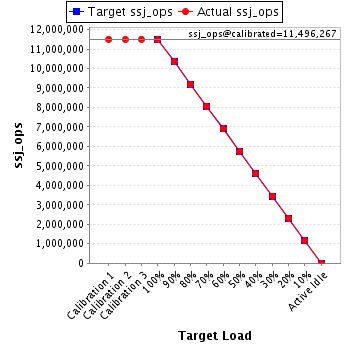
| Target Load | Actual Load | ssj_ops | |
|---|---|---|---|
| Target | Actual | ||
| Calibration 1 | 11,505,815 | ||
| Calibration 2 | 11,487,587 | ||
| Calibration 3 | 11,504,948 | ||
| ssj_ops@calibrated=11,496,267 | |||
| 100% | 99.7% | 11,496,267 | 11,464,274 |
| 90% | 90.0% | 10,346,641 | 10,341,997 |
| 80% | 80.0% | 9,197,014 | 9,200,058 |
| 70% | 70.1% | 8,047,387 | 8,056,384 |
| 60% | 60.0% | 6,897,760 | 6,893,529 |
| 50% | 49.9% | 5,748,134 | 5,741,665 |
| 40% | 40.0% | 4,598,507 | 4,593,874 |
| 30% | 30.0% | 3,448,880 | 3,452,791 |
| 20% | 20.0% | 2,299,253 | 2,302,272 |
| 10% | 10.0% | 1,149,627 | 1,149,460 |
| Active Idle | 0 | 0 | |
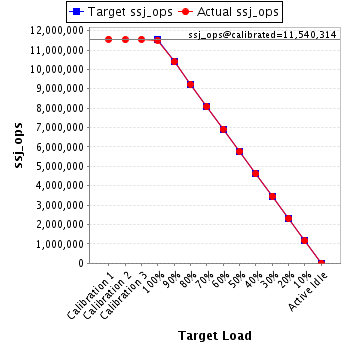
| Target Load | Actual Load | ssj_ops | |
|---|---|---|---|
| Target | Actual | ||
| Calibration 1 | 11,559,368 | ||
| Calibration 2 | 11,532,395 | ||
| Calibration 3 | 11,548,233 | ||
| ssj_ops@calibrated=11,540,314 | |||
| 100% | 99.7% | 11,540,314 | 11,509,232 |
| 90% | 90.0% | 10,386,283 | 10,386,621 |
| 80% | 80.0% | 9,232,251 | 9,230,044 |
| 70% | 70.0% | 8,078,220 | 8,075,239 |
| 60% | 60.0% | 6,924,189 | 6,924,546 |
| 50% | 50.0% | 5,770,157 | 5,770,464 |
| 40% | 40.0% | 4,616,126 | 4,610,950 |
| 30% | 30.0% | 3,462,094 | 3,461,469 |
| 20% | 20.0% | 2,308,063 | 2,312,049 |
| 10% | 10.0% | 1,154,031 | 1,155,292 |
| Active Idle | 0 | 0 | |
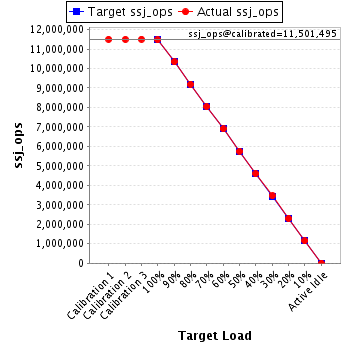
| Target Load | Actual Load | ssj_ops | |
|---|---|---|---|
| Target | Actual | ||
| Calibration 1 | 11,505,063 | ||
| Calibration 2 | 11,495,496 | ||
| Calibration 3 | 11,507,495 | ||
| ssj_ops@calibrated=11,501,495 | |||
| 100% | 99.8% | 11,501,495 | 11,473,104 |
| 90% | 89.9% | 10,351,346 | 10,343,353 |
| 80% | 80.0% | 9,201,196 | 9,199,178 |
| 70% | 69.9% | 8,051,047 | 8,044,852 |
| 60% | 60.0% | 6,900,897 | 6,898,992 |
| 50% | 50.1% | 5,750,748 | 5,758,116 |
| 40% | 40.0% | 4,600,598 | 4,595,041 |
| 30% | 30.1% | 3,450,449 | 3,457,459 |
| 20% | 20.0% | 2,300,299 | 2,304,100 |
| 10% | 10.0% | 1,150,150 | 1,149,991 |
| Active Idle | 0 | 0 | |
| Target Load | Actual Load | ssj_ops | |
|---|---|---|---|
| Target | Actual | ||
| Calibration 1 | 11,532,601 | ||
| Calibration 2 | 11,567,725 | ||
| Calibration 3 | 11,575,049 | ||
| ssj_ops@calibrated=11,571,387 | |||
| 100% | 99.8% | 11,571,387 | 11,544,346 |
| 90% | 90.0% | 10,414,248 | 10,415,906 |
| 80% | 80.1% | 9,257,110 | 9,272,236 |
| 70% | 70.0% | 8,099,971 | 8,102,030 |
| 60% | 60.0% | 6,942,832 | 6,948,342 |
| 50% | 49.9% | 5,785,693 | 5,778,256 |
| 40% | 40.0% | 4,628,555 | 4,627,562 |
| 30% | 30.0% | 3,471,416 | 3,473,447 |
| 20% | 20.0% | 2,314,277 | 2,309,465 |
| 10% | 10.0% | 1,157,139 | 1,158,369 |
| Active Idle | 0 | 0 | |
