SPECpower_ssj2008
Aggregate Performance Report
Copyright © 2007-2012 Standard Performance Evaluation Corporation
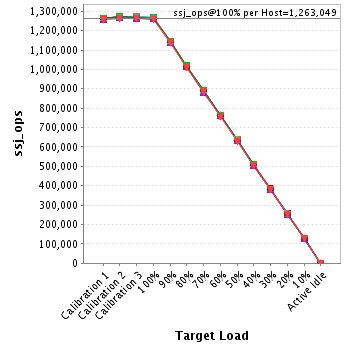
| Dell Inc. PowerEdge M620 (Intel Xeon E5-2670, 2.6 GHz) | ssj_ops@100% = 20,208,781 ssj_ops@100% per Host = 1,263,049 ssj_ops@100% per JVM = 78,941 |
||||
| Test Sponsor: | Dell Inc. | SPEC License #: | 55 | Test Method: | Multi Node |
| Tested By: | Dell Inc. | Test Location: | Round Rock, TX, USA | Test Date: | Mar 16, 2012 |
| Hardware Availability: | Mar-2012 | Software Availability: | Dec-2011 | Publication: | Apr 4, 2012 |
| System Source: | Single Supplier | System Designation: | Server | Power Provisioning: | Line-powered |
| Target Load | Actual Load | ssj_ops | |
|---|---|---|---|
| Target | Actual | ||
| Calibration 1 | 20,176,594 | ||
| Calibration 2 | 20,298,617 | ||
| Calibration 3 | 20,287,999 | ||
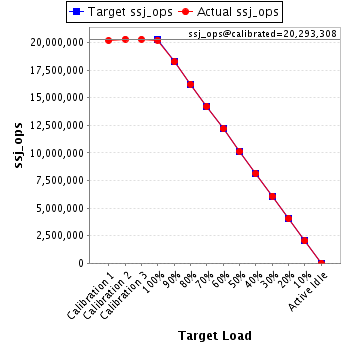
| ssj_ops@calibrated=20,293,308 | |||
| 100% | 99.6% | 20,293,308 | 20,208,781 |
| 90% | 90.0% | 18,263,977 | 18,257,722 |
| 80% | 80.0% | 16,234,646 | 16,228,326 |
| 70% | 70.0% | 14,205,316 | 14,196,751 |
| 60% | 60.0% | 12,175,985 | 12,180,630 |
| 50% | 50.0% | 10,146,654 | 10,140,591 |
| 40% | 40.0% | 8,117,323 | 8,116,313 |
| 30% | 30.0% | 6,087,992 | 6,089,412 |
| 20% | 20.0% | 4,058,662 | 4,057,687 |
| 10% | 10.0% | 2,029,331 | 2,024,873 |
| Active Idle | 0 | 0 | |
| # of Nodes | # of Chips | # of Cores | # of Threads | Total RAM (GB) | # of OS Images | # of JVM Instances |
|---|---|---|---|---|---|---|
| 16 | 32 | 256 | 512 | 384 | 16 | 256 |
| Set Identifier: | sut |
| Set Description: | M620 |
| # of Identical Nodes: | 16 |
| Comment: | None |
| Software per Node | |
|---|---|
| Power Management: | Power saver mode in OS (See Notes) |
| Operating System (OS): | Microsoft Windows Server 2008 Enterprise x64 Edition |
| OS Version: | R2 SP1 |
| Filesystem: | NTFS |
| JVM Vendor: | Oracle Corporation |
| JVM Version: | Oracle Java HotSpot(TM) 64-Bit Server VM on Windows, version 1.6.0_30 |
| JVM Command-line Options: | -server -showversion -Xmx1024m -Xms1024m -Xmn853m -XX:ParallelGCThreads=2 -XX:SurvivorRatio=60 -XX:TargetSurvivorRatio=90 -XX:InlineSmallCode=3900 -XX:MaxInlineSize=270 -XX:FreqInlineSize=2500 -XX:AllocatePrefetchDistance=256 -XX:AllocatePrefetchLines=4 -XX:InitialTenuringThreshold=12 -XX:MaxTenuringThreshold=15 -XX:LoopUnrollLimit=45 -XX:+UseCompressedStrings -XX:+AggressiveOpts -XX:+UseLargePages -XX:+UseParallelOldGC |
| JVM Affinity: | start /affinity [3, C, 30, C0, 300, C00, 3000, C000, 30000, C0000, 300000, C00000, 3000000, C0000000, 30000000, C0000000] |
| JVM Instances: | 16 |
| JVM Initial Heap (MB): | 1024 |
| JVM Maximum Heap (MB): | 1024 |
| JVM Address Bits: | 64 |
| Boot Firmware Version: | 1.0.4 |
| Management Firmware Version: | iDRAC7 1.00 Build 73 |
| Workload Version: | SSJ 1.2.9 |
| Director Location: | Controller |
| Other Software: | None |
| Host | ssj_ops@100% |
|---|---|
| M620-01 | 1,267,711 |
| M620-02 | 1,263,846 |
| M620-03 | 1,266,456 |
| M620-04 | 1,261,663 |
| M620-05 | 1,261,447 |
| M620-06 | 1,259,413 |
| M620-07 | 1,264,526 |
| M620-08 | 1,261,650 |
| M620-09 | 1,264,644 |
| M620-10 | 1,262,627 |
| M620-11 | 1,265,887 |
| M620-12 | 1,260,916 |
| M620-13 | 1,262,148 |
| M620-14 | 1,265,197 |
| M620-15 | 1,264,395 |
| M620-16 | 1,256,255 |
| ssj_ops@100% | 20,208,781 |
| ssj_ops@100% per Host | 1,263,049 |
| ssj_ops@100% per JVM | 78,941 |
| Target Load | Actual Load | ssj_ops | |
|---|---|---|---|
| Target | Actual | ||
| Calibration 1 | 1,262,242 | ||
| Calibration 2 | 1,270,216 | ||
| Calibration 3 | 1,271,124 | ||
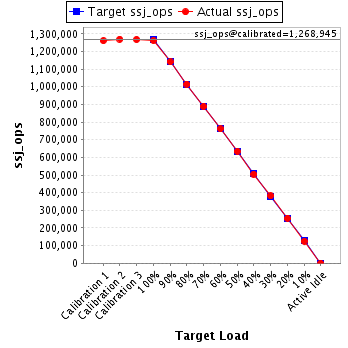
| ssj_ops@calibrated=1,270,670 | |||
| 100% | 99.8% | 1,270,670 | 1,267,711 |
| 90% | 90.2% | 1,143,603 | 1,145,862 |
| 80% | 79.8% | 1,016,536 | 1,014,575 |
| 70% | 70.1% | 889,469 | 890,730 |
| 60% | 60.2% | 762,402 | 764,702 |
| 50% | 50.4% | 635,335 | 640,083 |
| 40% | 40.0% | 508,268 | 507,638 |
| 30% | 30.0% | 381,201 | 381,549 |
| 20% | 20.0% | 254,134 | 254,289 |
| 10% | 9.9% | 127,067 | 126,410 |
| Active Idle | 0 | 0 | |

| Target Load | Actual Load | ssj_ops | |
|---|---|---|---|
| Target | Actual | ||
| Calibration 1 | 1,259,768 | ||
| Calibration 2 | 1,269,955 | ||
| Calibration 3 | 1,267,128 | ||
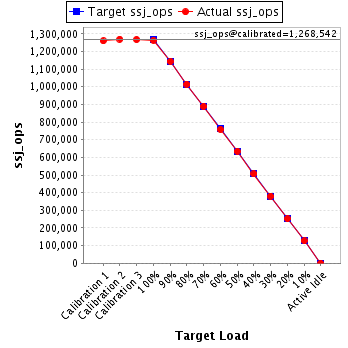
| ssj_ops@calibrated=1,268,542 | |||
| 100% | 99.6% | 1,268,542 | 1,263,846 |
| 90% | 90.2% | 1,141,688 | 1,144,079 |
| 80% | 80.0% | 1,014,833 | 1,014,742 |
| 70% | 70.2% | 887,979 | 890,090 |
| 60% | 59.7% | 761,125 | 757,703 |
| 50% | 50.1% | 634,271 | 635,016 |
| 40% | 39.9% | 507,417 | 505,855 |
| 30% | 30.0% | 380,563 | 380,969 |
| 20% | 19.8% | 253,708 | 251,535 |
| 10% | 10.0% | 126,854 | 126,882 |
| Active Idle | 0 | 0 | |
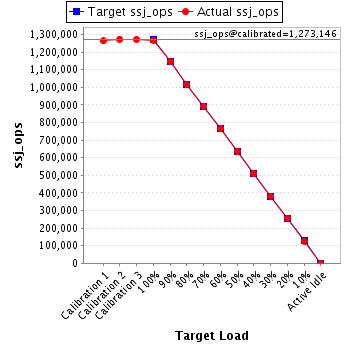
| Target Load | Actual Load | ssj_ops | |
|---|---|---|---|
| Target | Actual | ||
| Calibration 1 | 1,263,365 | ||
| Calibration 2 | 1,273,640 | ||
| Calibration 3 | 1,272,652 | ||
| ssj_ops@calibrated=1,273,146 | |||
| 100% | 99.5% | 1,273,146 | 1,266,456 |
| 90% | 89.9% | 1,145,831 | 1,144,874 |
| 80% | 79.8% | 1,018,517 | 1,015,568 |
| 70% | 70.0% | 891,202 | 891,101 |
| 60% | 60.1% | 763,888 | 764,646 |
| 50% | 50.0% | 636,573 | 636,596 |
| 40% | 40.0% | 509,258 | 509,489 |
| 30% | 30.0% | 381,944 | 381,530 |
| 20% | 20.0% | 254,629 | 254,372 |
| 10% | 9.9% | 127,315 | 126,022 |
| Active Idle | 0 | 0 | |
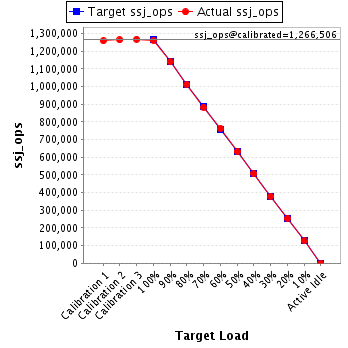
| Target Load | Actual Load | ssj_ops | |
|---|---|---|---|
| Target | Actual | ||
| Calibration 1 | 1,258,820 | ||
| Calibration 2 | 1,264,519 | ||
| Calibration 3 | 1,268,493 | ||
| ssj_ops@calibrated=1,266,506 | |||
| 100% | 99.6% | 1,266,506 | 1,261,663 |
| 90% | 90.0% | 1,139,855 | 1,140,009 |
| 80% | 80.0% | 1,013,205 | 1,012,790 |
| 70% | 69.8% | 886,554 | 883,473 |
| 60% | 60.2% | 759,904 | 761,984 |
| 50% | 50.0% | 633,253 | 632,795 |
| 40% | 40.0% | 506,602 | 506,048 |
| 30% | 29.9% | 379,952 | 378,869 |
| 20% | 20.0% | 253,301 | 253,640 |
| 10% | 10.0% | 126,651 | 126,706 |
| Active Idle | 0 | 0 | |
| Target Load | Actual Load | ssj_ops | |
|---|---|---|---|
| Target | Actual | ||
| Calibration 1 | 1,259,793 | ||
| Calibration 2 | 1,266,062 | ||
| Calibration 3 | 1,266,663 | ||
| ssj_ops@calibrated=1,266,363 | |||
| 100% | 99.6% | 1,266,363 | 1,261,447 |
| 90% | 89.9% | 1,139,726 | 1,138,453 |
| 80% | 80.1% | 1,013,090 | 1,014,702 |
| 70% | 69.9% | 886,454 | 885,009 |
| 60% | 60.0% | 759,818 | 759,588 |
| 50% | 49.9% | 633,181 | 632,476 |
| 40% | 40.0% | 506,545 | 507,055 |
| 30% | 30.0% | 379,909 | 380,172 |
| 20% | 20.1% | 253,273 | 254,234 |
| 10% | 10.0% | 126,636 | 126,589 |
| Active Idle | 0 | 0 | |

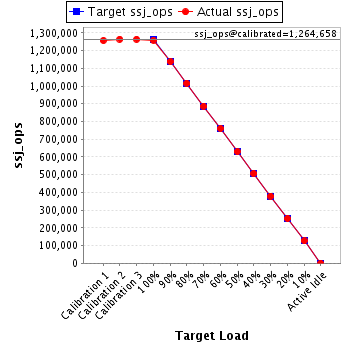
| Target Load | Actual Load | ssj_ops | |
|---|---|---|---|
| Target | Actual | ||
| Calibration 1 | 1,257,342 | ||
| Calibration 2 | 1,264,679 | ||
| Calibration 3 | 1,264,637 | ||
| ssj_ops@calibrated=1,264,658 | |||
| 100% | 99.6% | 1,264,658 | 1,259,413 |
| 90% | 90.0% | 1,138,192 | 1,138,138 |
| 80% | 80.3% | 1,011,726 | 1,015,610 |
| 70% | 70.2% | 885,260 | 887,238 |
| 60% | 60.2% | 758,795 | 761,137 |
| 50% | 49.8% | 632,329 | 629,871 |
| 40% | 40.0% | 505,863 | 505,990 |
| 30% | 30.0% | 379,397 | 379,493 |
| 20% | 20.0% | 252,932 | 252,487 |
| 10% | 10.0% | 126,466 | 126,597 |
| Active Idle | 0 | 0 | |
| Target Load | Actual Load | ssj_ops | |
|---|---|---|---|
| Target | Actual | ||
| Calibration 1 | 1,266,118 | ||
| Calibration 2 | 1,270,251 | ||
| Calibration 3 | 1,271,147 | ||
| ssj_ops@calibrated=1,270,699 | |||
| 100% | 99.5% | 1,270,699 | 1,264,526 |
| 90% | 89.9% | 1,143,629 | 1,142,598 |
| 80% | 80.0% | 1,016,559 | 1,017,167 |
| 70% | 69.9% | 889,489 | 887,782 |
| 60% | 59.9% | 762,419 | 760,715 |
| 50% | 49.9% | 635,349 | 633,543 |
| 40% | 40.2% | 508,279 | 510,214 |
| 30% | 29.9% | 381,210 | 379,719 |
| 20% | 20.2% | 254,140 | 256,555 |
| 10% | 10.1% | 127,070 | 128,282 |
| Active Idle | 0 | 0 | |

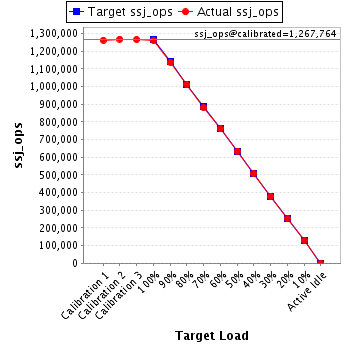
| Target Load | Actual Load | ssj_ops | |
|---|---|---|---|
| Target | Actual | ||
| Calibration 1 | 1,263,481 | ||
| Calibration 2 | 1,268,916 | ||
| Calibration 3 | 1,266,611 | ||
| ssj_ops@calibrated=1,267,764 | |||
| 100% | 99.5% | 1,267,764 | 1,261,650 |
| 90% | 89.8% | 1,140,987 | 1,138,095 |
| 80% | 79.9% | 1,014,211 | 1,013,496 |
| 70% | 69.5% | 887,435 | 881,091 |
| 60% | 60.0% | 760,658 | 761,052 |
| 50% | 50.1% | 633,882 | 635,645 |
| 40% | 40.0% | 507,106 | 507,718 |
| 30% | 29.9% | 380,329 | 378,990 |
| 20% | 20.0% | 253,553 | 252,934 |
| 10% | 10.0% | 126,776 | 127,342 |
| Active Idle | 0 | 0 | |
| Target Load | Actual Load | ssj_ops | |
|---|---|---|---|
| Target | Actual | ||
| Calibration 1 | 1,262,185 | ||
| Calibration 2 | 1,272,288 | ||
| Calibration 3 | 1,269,797 | ||
| ssj_ops@calibrated=1,271,042 | |||
| 100% | 99.5% | 1,271,042 | 1,264,644 |
| 90% | 90.0% | 1,143,938 | 1,143,737 |
| 80% | 79.9% | 1,016,834 | 1,015,068 |
| 70% | 70.0% | 889,729 | 890,008 |
| 60% | 60.0% | 762,625 | 762,264 |
| 50% | 50.0% | 635,521 | 635,497 |
| 40% | 39.9% | 508,417 | 507,342 |
| 30% | 30.2% | 381,313 | 383,342 |
| 20% | 19.9% | 254,208 | 253,521 |
| 10% | 9.9% | 127,104 | 126,215 |
| Active Idle | 0 | 0 | |

| Target Load | Actual Load | ssj_ops | |
|---|---|---|---|
| Target | Actual | ||
| Calibration 1 | 1,261,268 | ||
| Calibration 2 | 1,269,974 | ||
| Calibration 3 | 1,267,916 | ||
| ssj_ops@calibrated=1,268,945 | |||
| 100% | 99.5% | 1,268,945 | 1,262,627 |
| 90% | 89.9% | 1,142,051 | 1,141,266 |
| 80% | 80.0% | 1,015,156 | 1,014,923 |
| 70% | 70.1% | 888,262 | 889,603 |
| 60% | 60.0% | 761,367 | 761,232 |
| 50% | 50.0% | 634,473 | 635,084 |
| 40% | 39.8% | 507,578 | 505,380 |
| 30% | 30.1% | 380,684 | 381,524 |
| 20% | 20.1% | 253,789 | 255,517 |
| 10% | 9.8% | 126,895 | 124,788 |
| Active Idle | 0 | 0 | |
| Target Load | Actual Load | ssj_ops | |
|---|---|---|---|
| Target | Actual | ||
| Calibration 1 | 1,261,361 | ||
| Calibration 2 | 1,272,130 | ||
| Calibration 3 | 1,268,981 | ||
| ssj_ops@calibrated=1,270,556 | |||
| 100% | 99.6% | 1,270,556 | 1,265,887 |
| 90% | 90.0% | 1,143,500 | 1,143,383 |
| 80% | 80.1% | 1,016,445 | 1,018,178 |
| 70% | 70.1% | 889,389 | 890,352 |
| 60% | 60.1% | 762,334 | 763,817 |
| 50% | 49.9% | 635,278 | 634,225 |
| 40% | 40.0% | 508,222 | 508,574 |
| 30% | 30.0% | 381,167 | 380,999 |
| 20% | 19.9% | 254,111 | 253,100 |
| 10% | 10.1% | 127,056 | 128,045 |
| Active Idle | 0 | 0 | |

| Target Load | Actual Load | ssj_ops | |
|---|---|---|---|
| Target | Actual | ||
| Calibration 1 | 1,258,527 | ||
| Calibration 2 | 1,267,610 | ||
| Calibration 3 | 1,265,588 | ||
| ssj_ops@calibrated=1,266,599 | |||
| 100% | 99.6% | 1,266,599 | 1,260,916 |
| 90% | 89.7% | 1,139,939 | 1,136,581 |
| 80% | 79.9% | 1,013,279 | 1,011,832 |
| 70% | 69.9% | 886,619 | 885,173 |
| 60% | 59.9% | 759,959 | 758,070 |
| 50% | 49.8% | 633,300 | 631,063 |
| 40% | 40.0% | 506,640 | 506,741 |
| 30% | 30.0% | 379,980 | 379,718 |
| 20% | 20.1% | 253,320 | 254,069 |
| 10% | 10.0% | 126,660 | 126,502 |
| Active Idle | 0 | 0 | |

| Target Load | Actual Load | ssj_ops | |
|---|---|---|---|
| Target | Actual | ||
| Calibration 1 | 1,259,397 | ||
| Calibration 2 | 1,265,382 | ||
| Calibration 3 | 1,264,315 | ||
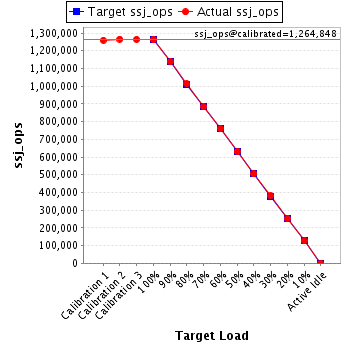
| ssj_ops@calibrated=1,264,848 | |||
| 100% | 99.8% | 1,264,848 | 1,262,148 |
| 90% | 89.9% | 1,138,364 | 1,137,649 |
| 80% | 80.1% | 1,011,879 | 1,013,659 |
| 70% | 69.8% | 885,394 | 883,318 |
| 60% | 60.1% | 758,909 | 760,549 |
| 50% | 49.9% | 632,424 | 631,271 |
| 40% | 39.9% | 505,939 | 504,846 |
| 30% | 30.0% | 379,455 | 379,885 |
| 20% | 19.9% | 252,970 | 251,823 |
| 10% | 10.0% | 126,485 | 125,939 |
| Active Idle | 0 | 0 | |
| Target Load | Actual Load | ssj_ops | |
|---|---|---|---|
| Target | Actual | ||
| Calibration 1 | 1,261,069 | ||
| Calibration 2 | 1,268,344 | ||
| Calibration 3 | 1,271,890 | ||
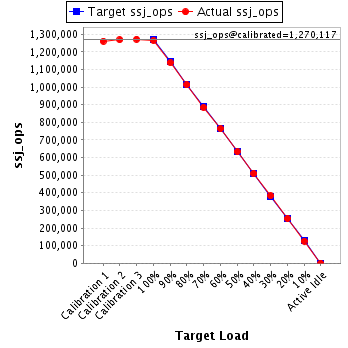
| ssj_ops@calibrated=1,270,117 | |||
| 100% | 99.6% | 1,270,117 | 1,265,197 |
| 90% | 89.6% | 1,143,105 | 1,138,284 |
| 80% | 79.7% | 1,016,094 | 1,012,910 |
| 70% | 69.7% | 889,082 | 885,369 |
| 60% | 60.1% | 762,070 | 763,741 |
| 50% | 49.9% | 635,059 | 633,213 |
| 40% | 40.0% | 508,047 | 508,659 |
| 30% | 30.1% | 381,035 | 382,234 |
| 20% | 19.9% | 254,023 | 253,198 |
| 10% | 9.9% | 127,012 | 125,991 |
| Active Idle | 0 | 0 | |
| Target Load | Actual Load | ssj_ops | |
|---|---|---|---|
| Target | Actual | ||
| Calibration 1 | 1,263,277 | ||
| Calibration 2 | 1,271,020 | ||
| Calibration 3 | 1,268,703 | ||
| ssj_ops@calibrated=1,269,861 | |||
| 100% | 99.6% | 1,269,861 | 1,264,395 |
| 90% | 90.2% | 1,142,875 | 1,145,381 |
| 80% | 79.8% | 1,015,889 | 1,012,852 |
| 70% | 70.2% | 888,903 | 891,385 |
| 60% | 60.1% | 761,917 | 763,482 |
| 50% | 50.0% | 634,931 | 634,510 |
| 40% | 40.1% | 507,945 | 509,641 |
| 30% | 30.0% | 380,958 | 380,758 |
| 20% | 20.0% | 253,972 | 253,971 |
| 10% | 10.0% | 126,986 | 126,719 |
| Active Idle | 0 | 0 | |

| Target Load | Actual Load | ssj_ops | |
|---|---|---|---|
| Target | Actual | ||
| Calibration 1 | 1,258,581 | ||
| Calibration 2 | 1,263,631 | ||
| Calibration 3 | 1,262,354 | ||
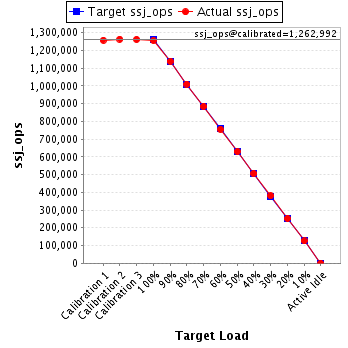
| ssj_ops@calibrated=1,262,992 | |||
| 100% | 99.5% | 1,262,992 | 1,256,255 |
| 90% | 90.2% | 1,136,693 | 1,139,332 |
| 80% | 80.0% | 1,010,394 | 1,010,253 |
| 70% | 70.1% | 884,095 | 885,028 |
| 60% | 59.9% | 757,795 | 755,946 |
| 50% | 49.9% | 631,496 | 629,704 |
| 40% | 40.0% | 505,197 | 505,124 |
| 30% | 30.1% | 378,898 | 379,660 |
| 20% | 20.0% | 252,598 | 252,442 |
| 10% | 10.0% | 126,299 | 125,846 |
| Active Idle | 0 | 0 | |