| Target Load |
Actual Load |
ssj_ops |
| Target |
Actual |
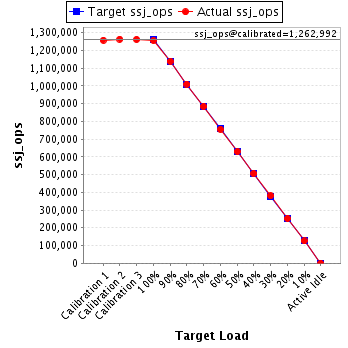
| Calibration 1 |
|
|
1,258,581 |
| Calibration 2 |
|
|
1,263,631 |
| Calibration 3 |
|
|
1,262,354 |
| ssj_ops@calibrated=1,262,992 |
| 100% |
99.5% |
1,262,992 |
1,256,255 |
| 90% |
90.2% |
1,136,693 |
1,139,332 |
| 80% |
80.0% |
1,010,394 |
1,010,253 |
| 70% |
70.1% |
884,095 |
885,028 |
| 60% |
59.9% |
757,795 |
755,946 |
| 50% |
49.9% |
631,496 |
629,704 |
| 40% |
40.0% |
505,197 |
505,124 |
| 30% |
30.1% |
378,898 |
379,660 |
| 20% |
20.0% |
252,598 |
252,442 |
| 10% |
10.0% |
126,299 |
125,846 |
| Active Idle |
|
0 |
0 |
| Software |
| Power Management: |
Power saver mode in OS (See Notes) |
| Operating System (OS): |
Microsoft Windows Server 2008 Enterprise x64 Edition |
| OS Version: |
R2 SP1 |
| Filesystem: |
NTFS |
| JVM Vendor: |
Oracle Corporation |
| JVM Version: |
Oracle Java HotSpot(TM) 64-Bit Server VM on Windows, version 1.6.0_30 |
| JVM Command-line Options: |
-server -showversion -Xmx1024m -Xms1024m -Xmn853m -XX:ParallelGCThreads=2 -XX:SurvivorRatio=60 -XX:TargetSurvivorRatio=90 -XX:InlineSmallCode=3900 -XX:MaxInlineSize=270 -XX:FreqInlineSize=2500 -XX:AllocatePrefetchDistance=256 -XX:AllocatePrefetchLines=4 -XX:InitialTenuringThreshold=12 -XX:MaxTenuringThreshold=15 -XX:LoopUnrollLimit=45 -XX:+UseCompressedStrings -XX:+AggressiveOpts -XX:+UseLargePages -XX:+UseParallelOldGC |
| JVM Affinity: |
start /affinity [3, C, 30, C0, 300, C00, 3000, C000, 30000, C0000, 300000, C00000, 3000000, C0000000, 30000000, C0000000] |
| JVM Instances: |
16 |
| JVM Initial Heap (MB): |
1024 |
| JVM Maximum Heap (MB): |
1024 |
| JVM Address Bits: |
64 |
| Boot Firmware Version: |
1.0.4 |
| Management Firmware Version: |
iDRAC7 1.00 Build 73 |
| Workload Version: |
SSJ 1.2.9 |
| Director Location: |
Controller |
| Other Software: |
None |
Adjacent Cache Line Prefetch disabledHardware Prefetcher DisabledDCU Streamer Prefetcher disabledUser Accessible USB Ports set to DisabledCPU Power management set to System DBPM (DAPC)Memory Speed set to 1067MHzTurbo Boost DisabledC1E EnabledC States enabledQPI speed set to 6.4 GT/sMemory Patrol Scrub disabledMemory refresh rate set to 1xMemory Operating Voltage set to Auto
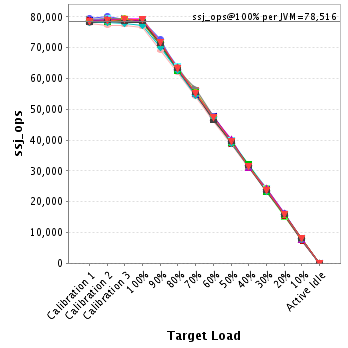
| JVM Instance |
ssj_ops@100% |
| M620-16.001 |
79,000 |
| M620-16.002 |
78,842 |
| M620-16.003 |
78,674 |
| M620-16.004 |
79,108 |
| M620-16.005 |
79,440 |
| M620-16.006 |
79,124 |
| M620-16.007 |
76,705 |
| M620-16.008 |
78,748 |
| M620-16.009 |
78,909 |
| M620-16.010 |
78,082 |
| M620-16.011 |
78,313 |
| M620-16.012 |
77,773 |
| M620-16.013 |
78,967 |
| M620-16.014 |
77,197 |
| M620-16.015 |
78,347 |
| M620-16.016 |
79,027 |
| ssj_ops@100% |
1,256,255 |
| ssj_ops@100% per JVM |
78,516 |
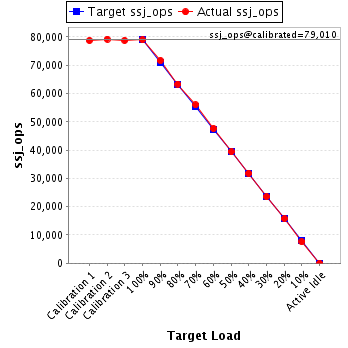
JVM 'M620-16.001' Scores:
| Target Load |
Actual Load |
ssj_ops |
| Target |
Actual |
| Calibration 1 |
|
|
78,738 |
| Calibration 2 |
|
|
79,229 |
| Calibration 3 |
|
|
78,791 |
| ssj_ops@calibrated=79,010 |
| 100% |
100.0% |
79,010 |
79,000 |
| 90% |
90.7% |
71,109 |
71,692 |
| 80% |
80.2% |
63,208 |
63,367 |
| 70% |
70.9% |
55,307 |
56,003 |
| 60% |
60.3% |
47,406 |
47,655 |
| 50% |
49.9% |
39,505 |
39,422 |
| 40% |
40.3% |
31,604 |
31,811 |
| 30% |
29.8% |
23,703 |
23,508 |
| 20% |
20.0% |
15,802 |
15,787 |
| 10% |
9.7% |
7,901 |
7,625 |
| Active Idle |
|
0 |
0 |
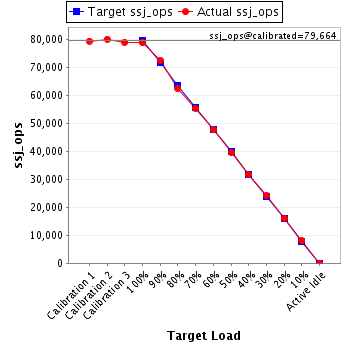
JVM 'M620-16.002' Scores:
| Target Load |
Actual Load |
ssj_ops |
| Target |
Actual |
| Calibration 1 |
|
|
79,544 |
| Calibration 2 |
|
|
80,204 |
| Calibration 3 |
|
|
79,124 |
| ssj_ops@calibrated=79,664 |
| 100% |
99.0% |
79,664 |
78,842 |
| 90% |
91.2% |
71,698 |
72,650 |
| 80% |
78.5% |
63,731 |
62,555 |
| 70% |
69.6% |
55,765 |
55,459 |
| 60% |
60.0% |
47,798 |
47,786 |
| 50% |
49.7% |
39,832 |
39,559 |
| 40% |
39.9% |
31,866 |
31,757 |
| 30% |
30.5% |
23,899 |
24,264 |
| 20% |
20.1% |
15,933 |
16,033 |
| 10% |
10.1% |
7,966 |
8,051 |
| Active Idle |
|
0 |
0 |
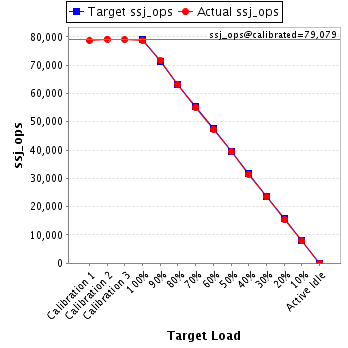
JVM 'M620-16.003' Scores:
| Target Load |
Actual Load |
ssj_ops |
| Target |
Actual |
| Calibration 1 |
|
|
78,760 |
| Calibration 2 |
|
|
79,184 |
| Calibration 3 |
|
|
78,975 |
| ssj_ops@calibrated=79,079 |
| 100% |
99.5% |
79,079 |
78,674 |
| 90% |
90.6% |
71,171 |
71,669 |
| 80% |
79.9% |
63,263 |
63,210 |
| 70% |
69.8% |
55,355 |
55,214 |
| 60% |
59.8% |
47,448 |
47,257 |
| 50% |
49.8% |
39,540 |
39,350 |
| 40% |
39.8% |
31,632 |
31,472 |
| 30% |
29.7% |
23,724 |
23,461 |
| 20% |
19.4% |
15,816 |
15,316 |
| 10% |
10.0% |
7,908 |
7,877 |
| Active Idle |
|
0 |
0 |
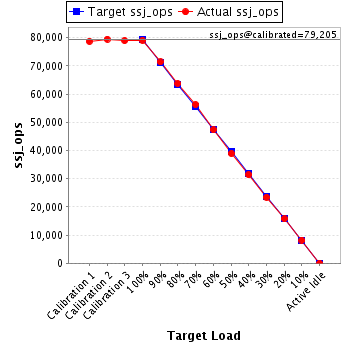
JVM 'M620-16.004' Scores:
| Target Load |
Actual Load |
ssj_ops |
| Target |
Actual |
| Calibration 1 |
|
|
78,740 |
| Calibration 2 |
|
|
79,474 |
| Calibration 3 |
|
|
78,936 |
| ssj_ops@calibrated=79,205 |
| 100% |
99.9% |
79,205 |
79,108 |
| 90% |
90.1% |
71,285 |
71,396 |
| 80% |
80.5% |
63,364 |
63,744 |
| 70% |
71.0% |
55,444 |
56,263 |
| 60% |
59.8% |
47,523 |
47,327 |
| 50% |
49.2% |
39,603 |
38,940 |
| 40% |
39.6% |
31,682 |
31,377 |
| 30% |
29.6% |
23,762 |
23,475 |
| 20% |
19.9% |
15,841 |
15,764 |
| 10% |
10.3% |
7,921 |
8,187 |
| Active Idle |
|
0 |
0 |
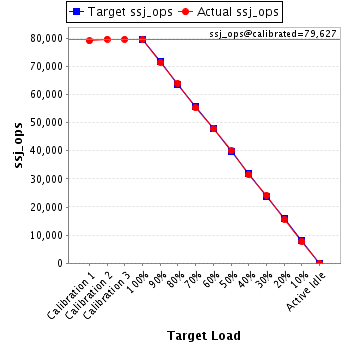
JVM 'M620-16.005' Scores:
| Target Load |
Actual Load |
ssj_ops |
| Target |
Actual |
| Calibration 1 |
|
|
79,013 |
| Calibration 2 |
|
|
79,661 |
| Calibration 3 |
|
|
79,593 |
| ssj_ops@calibrated=79,627 |
| 100% |
99.8% |
79,627 |
79,440 |
| 90% |
89.6% |
71,664 |
71,349 |
| 80% |
80.3% |
63,702 |
63,945 |
| 70% |
69.4% |
55,739 |
55,223 |
| 60% |
60.0% |
47,776 |
47,746 |
| 50% |
50.2% |
39,814 |
39,959 |
| 40% |
39.5% |
31,851 |
31,417 |
| 30% |
30.3% |
23,888 |
24,110 |
| 20% |
19.7% |
15,925 |
15,708 |
| 10% |
9.8% |
7,963 |
7,841 |
| Active Idle |
|
0 |
0 |
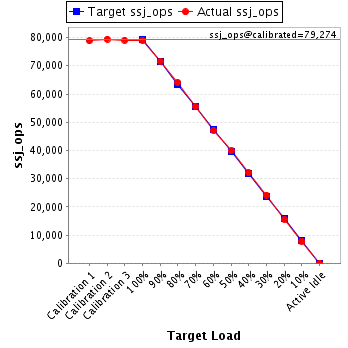
JVM 'M620-16.006' Scores:
| Target Load |
Actual Load |
ssj_ops |
| Target |
Actual |
| Calibration 1 |
|
|
78,821 |
| Calibration 2 |
|
|
79,440 |
| Calibration 3 |
|
|
79,109 |
| ssj_ops@calibrated=79,274 |
| 100% |
99.8% |
79,274 |
79,124 |
| 90% |
90.4% |
71,347 |
71,663 |
| 80% |
80.8% |
63,419 |
64,065 |
| 70% |
70.0% |
55,492 |
55,479 |
| 60% |
59.4% |
47,564 |
47,098 |
| 50% |
50.3% |
39,637 |
39,843 |
| 40% |
40.4% |
31,710 |
32,042 |
| 30% |
30.4% |
23,782 |
24,132 |
| 20% |
19.7% |
15,855 |
15,653 |
| 10% |
9.9% |
7,927 |
7,816 |
| Active Idle |
|
0 |
0 |
JVM 'M620-16.007' Scores:
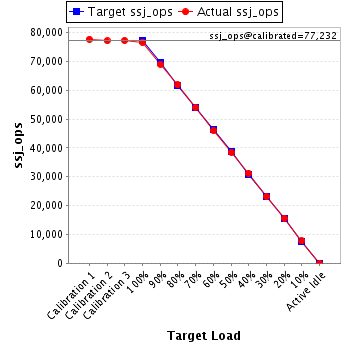
| Target Load |
Actual Load |
ssj_ops |
| Target |
Actual |
| Calibration 1 |
|
|
77,757 |
| Calibration 2 |
|
|
77,189 |
| Calibration 3 |
|
|
77,275 |
| ssj_ops@calibrated=77,232 |
| 100% |
99.3% |
77,232 |
76,705 |
| 90% |
89.4% |
69,509 |
69,039 |
| 80% |
80.2% |
61,786 |
61,910 |
| 70% |
70.0% |
54,062 |
54,058 |
| 60% |
59.6% |
46,339 |
46,056 |
| 50% |
49.8% |
38,616 |
38,500 |
| 40% |
40.5% |
30,893 |
31,253 |
| 30% |
30.0% |
23,170 |
23,171 |
| 20% |
20.3% |
15,446 |
15,647 |
| 10% |
10.0% |
7,723 |
7,725 |
| Active Idle |
|
0 |
0 |
JVM 'M620-16.008' Scores:
| Target Load |
Actual Load |
ssj_ops |
| Target |
Actual |
| Calibration 1 |
|
|
79,047 |
| Calibration 2 |
|
|
79,423 |
| Calibration 3 |
|
|
79,476 |
| ssj_ops@calibrated=79,450 |
| 100% |
99.1% |
79,450 |
78,748 |
| 90% |
90.4% |
71,505 |
71,837 |
| 80% |
79.2% |
63,560 |
62,963 |
| 70% |
71.4% |
55,615 |
56,747 |
| 60% |
60.1% |
47,670 |
47,728 |
| 50% |
49.1% |
39,725 |
38,988 |
| 40% |
39.9% |
31,780 |
31,692 |
| 30% |
29.8% |
23,835 |
23,696 |
| 20% |
19.7% |
15,890 |
15,674 |
| 10% |
10.0% |
7,945 |
7,912 |
| Active Idle |
|
0 |
0 |
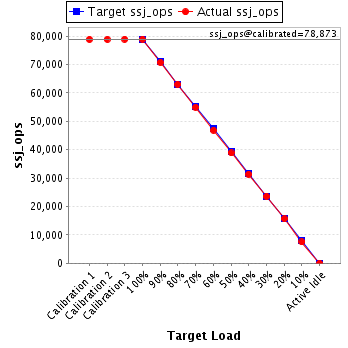
JVM 'M620-16.009' Scores:
| Target Load |
Actual Load |
ssj_ops |
| Target |
Actual |
| Calibration 1 |
|
|
78,824 |
| Calibration 2 |
|
|
78,840 |
| Calibration 3 |
|
|
78,906 |
| ssj_ops@calibrated=78,873 |
| 100% |
100.0% |
78,873 |
78,909 |
| 90% |
89.6% |
70,986 |
70,681 |
| 80% |
79.8% |
63,099 |
62,972 |
| 70% |
69.7% |
55,211 |
54,969 |
| 60% |
59.4% |
47,324 |
46,890 |
| 50% |
49.2% |
39,437 |
38,839 |
| 40% |
39.8% |
31,549 |
31,409 |
| 30% |
29.9% |
23,662 |
23,595 |
| 20% |
19.8% |
15,775 |
15,645 |
| 10% |
9.5% |
7,887 |
7,487 |
| Active Idle |
|
0 |
0 |
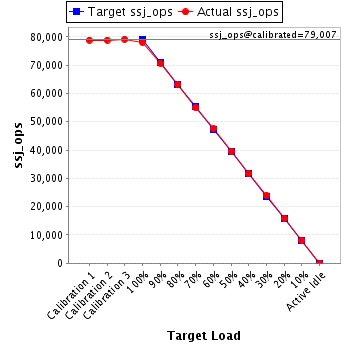
JVM 'M620-16.010' Scores:
| Target Load |
Actual Load |
ssj_ops |
| Target |
Actual |
| Calibration 1 |
|
|
78,864 |
| Calibration 2 |
|
|
78,839 |
| Calibration 3 |
|
|
79,175 |
| ssj_ops@calibrated=79,007 |
| 100% |
98.8% |
79,007 |
78,082 |
| 90% |
89.5% |
71,106 |
70,733 |
| 80% |
79.8% |
63,206 |
63,061 |
| 70% |
69.5% |
55,305 |
54,932 |
| 60% |
60.2% |
47,404 |
47,574 |
| 50% |
50.1% |
39,503 |
39,611 |
| 40% |
40.2% |
31,603 |
31,723 |
| 30% |
30.4% |
23,702 |
23,980 |
| 20% |
20.0% |
15,801 |
15,799 |
| 10% |
10.2% |
7,901 |
8,083 |
| Active Idle |
|
0 |
0 |
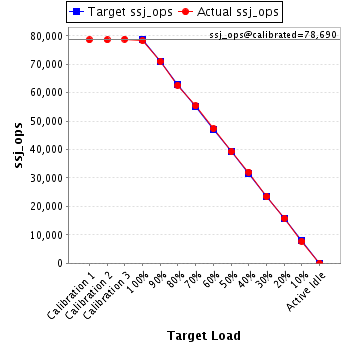
JVM 'M620-16.011' Scores:
| Target Load |
Actual Load |
ssj_ops |
| Target |
Actual |
| Calibration 1 |
|
|
78,537 |
| Calibration 2 |
|
|
78,556 |
| Calibration 3 |
|
|
78,825 |
| ssj_ops@calibrated=78,690 |
| 100% |
99.5% |
78,690 |
78,313 |
| 90% |
90.2% |
70,821 |
71,008 |
| 80% |
79.6% |
62,952 |
62,617 |
| 70% |
70.3% |
55,083 |
55,327 |
| 60% |
60.1% |
47,214 |
47,331 |
| 50% |
49.9% |
39,345 |
39,276 |
| 40% |
40.8% |
31,476 |
32,097 |
| 30% |
29.8% |
23,607 |
23,451 |
| 20% |
20.1% |
15,738 |
15,853 |
| 10% |
9.8% |
7,869 |
7,695 |
| Active Idle |
|
0 |
0 |
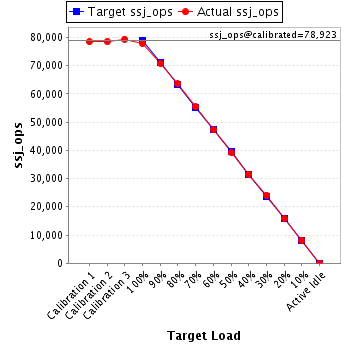
JVM 'M620-16.012' Scores:
| Target Load |
Actual Load |
ssj_ops |
| Target |
Actual |
| Calibration 1 |
|
|
78,453 |
| Calibration 2 |
|
|
78,487 |
| Calibration 3 |
|
|
79,359 |
| ssj_ops@calibrated=78,923 |
| 100% |
98.5% |
78,923 |
77,773 |
| 90% |
89.9% |
71,031 |
70,917 |
| 80% |
80.5% |
63,138 |
63,509 |
| 70% |
70.3% |
55,246 |
55,467 |
| 60% |
59.8% |
47,354 |
47,201 |
| 50% |
49.6% |
39,461 |
39,114 |
| 40% |
40.0% |
31,569 |
31,553 |
| 30% |
30.6% |
23,677 |
24,136 |
| 20% |
20.0% |
15,785 |
15,780 |
| 10% |
10.3% |
7,892 |
8,120 |
| Active Idle |
|
0 |
0 |
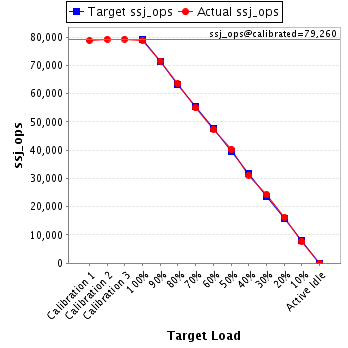
JVM 'M620-16.013' Scores:
| Target Load |
Actual Load |
ssj_ops |
| Target |
Actual |
| Calibration 1 |
|
|
78,821 |
| Calibration 2 |
|
|
79,240 |
| Calibration 3 |
|
|
79,281 |
| ssj_ops@calibrated=79,260 |
| 100% |
99.6% |
79,260 |
78,967 |
| 90% |
90.3% |
71,334 |
71,549 |
| 80% |
80.2% |
63,408 |
63,592 |
| 70% |
69.4% |
55,482 |
54,992 |
| 60% |
59.9% |
47,556 |
47,467 |
| 50% |
50.9% |
39,630 |
40,331 |
| 40% |
39.4% |
31,704 |
31,194 |
| 30% |
30.6% |
23,778 |
24,230 |
| 20% |
20.4% |
15,852 |
16,191 |
| 10% |
9.9% |
7,926 |
7,862 |
| Active Idle |
|
0 |
0 |
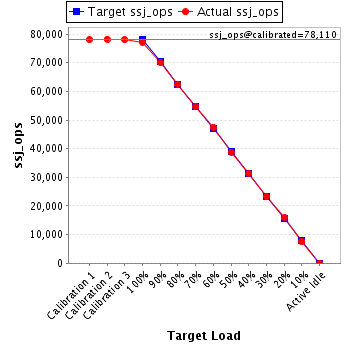
JVM 'M620-16.014' Scores:
| Target Load |
Actual Load |
ssj_ops |
| Target |
Actual |
| Calibration 1 |
|
|
78,061 |
| Calibration 2 |
|
|
78,219 |
| Calibration 3 |
|
|
78,000 |
| ssj_ops@calibrated=78,110 |
| 100% |
98.8% |
78,110 |
77,197 |
| 90% |
89.8% |
70,299 |
70,140 |
| 80% |
80.1% |
62,488 |
62,547 |
| 70% |
69.8% |
54,677 |
54,546 |
| 60% |
60.6% |
46,866 |
47,368 |
| 50% |
49.7% |
39,055 |
38,811 |
| 40% |
40.2% |
31,244 |
31,362 |
| 30% |
29.8% |
23,433 |
23,280 |
| 20% |
20.4% |
15,622 |
15,899 |
| 10% |
9.8% |
7,811 |
7,666 |
| Active Idle |
|
0 |
0 |
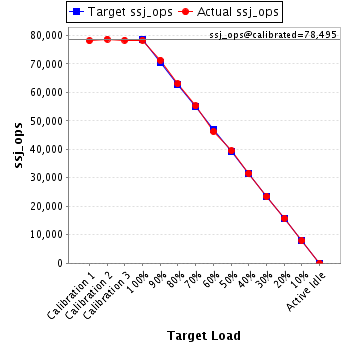
JVM 'M620-16.015' Scores:
| Target Load |
Actual Load |
ssj_ops |
| Target |
Actual |
| Calibration 1 |
|
|
78,081 |
| Calibration 2 |
|
|
78,667 |
| Calibration 3 |
|
|
78,322 |
| ssj_ops@calibrated=78,495 |
| 100% |
99.8% |
78,495 |
78,347 |
| 90% |
90.8% |
70,645 |
71,311 |
| 80% |
80.3% |
62,796 |
63,024 |
| 70% |
70.3% |
54,946 |
55,215 |
| 60% |
58.9% |
47,097 |
46,258 |
| 50% |
50.3% |
39,247 |
39,494 |
| 40% |
40.2% |
31,398 |
31,558 |
| 30% |
29.9% |
23,548 |
23,449 |
| 20% |
20.1% |
15,699 |
15,794 |
| 10% |
10.1% |
7,849 |
7,954 |
| Active Idle |
|
0 |
0 |
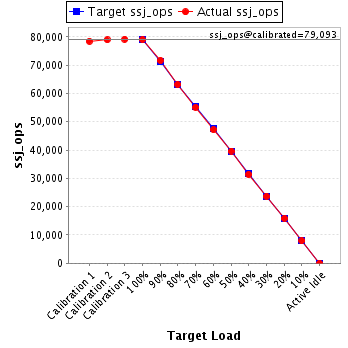
JVM 'M620-16.016' Scores:
| Target Load |
Actual Load |
ssj_ops |
| Target |
Actual |
| Calibration 1 |
|
|
78,520 |
| Calibration 2 |
|
|
78,979 |
| Calibration 3 |
|
|
79,207 |
| ssj_ops@calibrated=79,093 |
| 100% |
99.9% |
79,093 |
79,027 |
| 90% |
90.6% |
71,184 |
71,697 |
| 80% |
79.9% |
63,274 |
63,170 |
| 70% |
69.7% |
55,365 |
55,136 |
| 60% |
59.7% |
47,456 |
47,203 |
| 50% |
50.2% |
39,547 |
39,667 |
| 40% |
39.7% |
31,637 |
31,407 |
| 30% |
30.0% |
23,728 |
23,722 |
| 20% |
20.1% |
15,819 |
15,899 |
| 10% |
10.0% |
7,909 |
7,944 |
| Active Idle |
|
0 |
0 |