SPECpower_ssj2008
Aggregate Performance Report
Copyright © 2007-2019 Standard Performance Evaluation Corporation
| Hewlett Packard Enterprise Synergy 480 Gen10 Compute Module | ssj_ops@100% = 53,226,238 ssj_ops@100% per Host = 5,914,026 ssj_ops@100% per JVM = 1,478,507 |
||||
| Test Sponsor: | Hewlett Packard Enterprise | SPEC License #: | 3 | Test Method: | Multi Node |
| Tested By: | Hewlett Packard Enterprise | Test Location: | Houston, TX, USA | Test Date: | Mar 12, 2019 |
| Hardware Availability: | Apr-2019 | Software Availability: | Mar-2019 | Publication: | Apr 2, 2019 |
| System Source: | Single Supplier | System Designation: | Server | Power Provisioning: | Line-powered |
| Target Load | Actual Load | ssj_ops | |
|---|---|---|---|
| Target | Actual | ||
| Calibration 1 | 53,469,358 | ||
| Calibration 2 | 53,368,516 | ||
| Calibration 3 | 53,408,392 | ||
| ssj_ops@calibrated=53,388,454 | |||
| 100% | 99.7% | 53,388,454 | 53,226,238 |
| 90% | 90.0% | 48,049,609 | 48,036,731 |
| 80% | 80.0% | 42,710,763 | 42,733,075 |
| 70% | 70.0% | 37,371,918 | 37,359,548 |
| 60% | 60.0% | 32,033,072 | 32,026,360 |
| 50% | 50.0% | 26,694,227 | 26,691,105 |
| 40% | 40.0% | 21,355,382 | 21,363,081 |
| 30% | 30.0% | 16,016,536 | 16,015,076 |
| 20% | 20.0% | 10,677,691 | 10,685,771 |
| 10% | 10.0% | 5,338,845 | 5,340,699 |
| Active Idle | 0 | 0 | |

| # of Nodes | # of Chips | # of Cores | # of Threads | Total RAM (GB) | # of OS Images | # of JVM Instances |
|---|---|---|---|---|---|---|
| 9 | 18 | 504 | 1,008 | 1,728 | 9 | 36 |
| Set Identifier: | SUT |
| Set Description: | System Under Test |
| # of Identical Nodes: | 9 |
| Comment: | SUT |
| Hardware per Node | |
|---|---|
| Hardware Vendor: | Hewlett Packard Enterprise |
| Model: | Synergy 480 Gen10 Compute Module |
| Form Factor: | blade |
| CPU Name: | Intel Xeon Platinum 8280 @ 2.70GHz |
| CPU Characteristics: | 28-Core, 2.70 GHz, 38.5MB L3 Cache |
| CPU Frequency (MHz): | 2700 |
| CPU(s) Enabled: | 56 cores, 2 chips, 28 cores/chip |
| Hardware Threads: | 112 (2 / core) |
| CPU(s) Orderable: | 1,2 chips |
| Primary Cache: | 32 KB I + 32 KB D on chip per core |
| Secondary Cache: | 1 MB I+D on chip per core |
| Tertiary Cache: | 39424 KB I+D on chip per chip |
| Other Cache: | None |
| Memory Amount (GB): | 192 |
| # and size of DIMM: | 12 x 16384 MB |
| Memory Details: | 12 x 16GB 2Rx8 PC4-2933Y-R; slots 1, 3, 5, 8, 10 and 12 populated on each socket |
| Power Supply Quantity and Rating (W): | None |
| Power Supply Details: | N/A |
| Disk Drive: | 1 x HPE 480GB SATA 6G M.2 2280 (875498-B21) |
| Disk Controller: | HPE Smart Array S100i SR Gen10 |
| # and type of Network Interface Cards (NICs) Installed: | 1 x HPE Synergy 3820C 10/20Gb CNA |
| NICs Enabled in Firmware / OS / Connected: | 2/2/1 |
| Network Speed (Mbit): | 1000 |
| Keyboard: | None |
| Mouse: | None |
| Monitor: | None |
| Optical Drives: | No |
| Other Hardware: | None |
| Software per Node | |
|---|---|
| Power Management: | Enabled (see SUT Notes) |
| Operating System (OS): | SUSE Linux Enterprise Server 12 SP4 |
| OS Version: | 4.12.14-94.41-default |
| Filesystem: | xfs |
| JVM Vendor: | Oracle Corporation |
| JVM Version: | Oracle Java HotSpot(TM) 64-Bit Server VM (build 24.80-b11, mixed mode), version 1.7.0_80 |
| JVM Command-line Options: | -server -Xmn19g -Xms21g -Xmx21g -XX:SurvivorRatio=1 -XX:TargetSurvivorRatio=99 -XX:AllocatePrefetchDistance=384 -XX:AllocatePrefetchLines=4 -XX:LoopUnrollLimit=37 -XX:InitialTenuringThreshold=12 -XX:MaxTenuringThreshold=15 -XX:ParallelGCThreads=28 -XX:InlineSmallCode=3900 -XX:MaxInlineSize=270 -XX:FreqInlineSize=2500 -XX:+AggressiveOpts -XX:+UseLargePages -XX:+UseParallelOldGC |
| JVM Affinity: | numactl --cpunodebind=[0-3] --localalloc |
| JVM Instances: | 4 |
| JVM Initial Heap (MB): | 21000 |
| JVM Maximum Heap (MB): | 21000 |
| JVM Address Bits: | 64 |
| Boot Firmware Version: | I42 v2.00 (02/02/2019) |
| Management Firmware Version: | 1.40 Feb 05 2019 |
| Workload Version: | SSJ 1.2.10 |
| Director Location: | Controller |
| Other Software: | HPE Service Pack for ProLiant (SPP) - Version 2019.03.0 (Mar 2019) |
| Host | ssj_ops@100% |
|---|---|
| SY480-01 | 5,909,767 |
| SY480-02 | 5,938,859 |
| SY480-03 | 5,966,887 |
| SY480-04 | 5,873,662 |
| SY480-05 | 5,947,314 |
| SY480-06 | 5,890,757 |
| SY480-07 | 5,897,489 |
| SY480-08 | 5,873,618 |
| SY480-09 | 5,927,886 |
| ssj_ops@100% | 53,226,238 |
| ssj_ops@100% per Host | 5,914,026 |
| ssj_ops@100% per JVM | 1,478,507 |

| Target Load | Actual Load | ssj_ops | |
|---|---|---|---|
| Target | Actual | ||
| Calibration 1 | 5,937,392 | ||
| Calibration 2 | 5,927,445 | ||
| Calibration 3 | 5,930,363 | ||
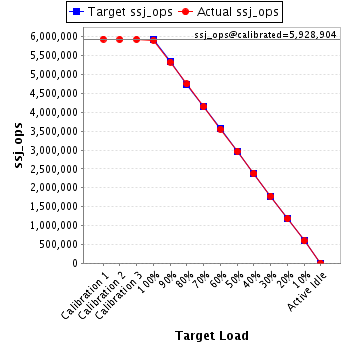
| ssj_ops@calibrated=5,928,904 | |||
| 100% | 99.7% | 5,928,904 | 5,909,767 |
| 90% | 89.9% | 5,336,014 | 5,331,062 |
| 80% | 80.1% | 4,743,123 | 4,749,890 |
| 70% | 70.0% | 4,150,233 | 4,150,886 |
| 60% | 60.0% | 3,557,343 | 3,556,193 |
| 50% | 50.0% | 2,964,452 | 2,962,952 |
| 40% | 40.0% | 2,371,562 | 2,373,825 |
| 30% | 30.0% | 1,778,671 | 1,781,440 |
| 20% | 20.0% | 1,185,781 | 1,183,060 |
| 10% | 10.0% | 592,890 | 594,007 |
| Active Idle | 0 | 0 | |
| Target Load | Actual Load | ssj_ops | |
|---|---|---|---|
| Target | Actual | ||
| Calibration 1 | 5,964,057 | ||
| Calibration 2 | 5,954,593 | ||
| Calibration 3 | 5,952,932 | ||
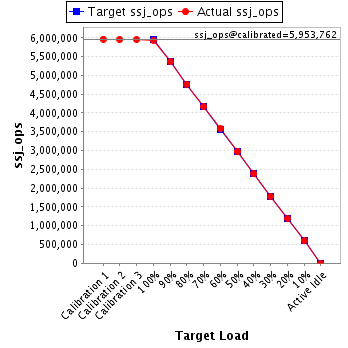
| ssj_ops@calibrated=5,953,762 | |||
| 100% | 99.7% | 5,953,762 | 5,938,859 |
| 90% | 90.0% | 5,358,386 | 5,356,895 |
| 80% | 80.1% | 4,763,010 | 4,766,479 |
| 70% | 70.0% | 4,167,634 | 4,165,851 |
| 60% | 60.1% | 3,572,257 | 3,576,514 |
| 50% | 49.9% | 2,976,881 | 2,971,149 |
| 40% | 40.0% | 2,381,505 | 2,379,025 |
| 30% | 30.0% | 1,786,129 | 1,784,082 |
| 20% | 20.1% | 1,190,752 | 1,194,054 |
| 10% | 10.0% | 595,376 | 595,125 |
| Active Idle | 0 | 0 | |
| Target Load | Actual Load | ssj_ops | |
|---|---|---|---|
| Target | Actual | ||
| Calibration 1 | 5,993,266 | ||
| Calibration 2 | 5,984,256 | ||
| Calibration 3 | 5,988,721 | ||
| ssj_ops@calibrated=5,986,488 | |||
| 100% | 99.7% | 5,986,488 | 5,966,887 |
| 90% | 89.9% | 5,387,839 | 5,384,439 |
| 80% | 80.0% | 4,789,190 | 4,788,475 |
| 70% | 69.9% | 4,190,542 | 4,183,767 |
| 60% | 60.0% | 3,591,893 | 3,592,483 |
| 50% | 50.0% | 2,993,244 | 2,993,900 |
| 40% | 40.0% | 2,394,595 | 2,392,848 |
| 30% | 30.0% | 1,795,946 | 1,796,595 |
| 20% | 20.0% | 1,197,298 | 1,199,277 |
| 10% | 10.0% | 598,649 | 599,121 |
| Active Idle | 0 | 0 | |

| Target Load | Actual Load | ssj_ops | |
|---|---|---|---|
| Target | Actual | ||
| Calibration 1 | 5,902,083 | ||
| Calibration 2 | 5,889,816 | ||
| Calibration 3 | 5,898,227 | ||
| ssj_ops@calibrated=5,894,022 | |||
| 100% | 99.7% | 5,894,022 | 5,873,662 |
| 90% | 89.9% | 5,304,620 | 5,300,436 |
| 80% | 80.2% | 4,715,217 | 4,725,154 |
| 70% | 70.1% | 4,125,815 | 4,130,714 |
| 60% | 59.9% | 3,536,413 | 3,531,002 |
| 50% | 50.0% | 2,947,011 | 2,949,320 |
| 40% | 39.9% | 2,357,609 | 2,354,617 |
| 30% | 30.0% | 1,768,207 | 1,767,774 |
| 20% | 20.0% | 1,178,804 | 1,180,965 |
| 10% | 10.0% | 589,402 | 589,681 |
| Active Idle | 0 | 0 | |

| Target Load | Actual Load | ssj_ops | |
|---|---|---|---|
| Target | Actual | ||
| Calibration 1 | 5,976,747 | ||
| Calibration 2 | 5,963,564 | ||
| Calibration 3 | 5,972,242 | ||
| ssj_ops@calibrated=5,967,903 | |||
| 100% | 99.7% | 5,967,903 | 5,947,314 |
| 90% | 90.1% | 5,371,113 | 5,379,935 |
| 80% | 80.0% | 4,774,323 | 4,772,200 |
| 70% | 70.0% | 4,177,532 | 4,179,396 |
| 60% | 60.0% | 3,580,742 | 3,581,581 |
| 50% | 50.0% | 2,983,952 | 2,981,188 |
| 40% | 40.0% | 2,387,161 | 2,388,102 |
| 30% | 30.0% | 1,790,371 | 1,792,302 |
| 20% | 20.0% | 1,193,581 | 1,193,172 |
| 10% | 10.0% | 596,790 | 594,269 |
| Active Idle | 0 | 0 | |

| Target Load | Actual Load | ssj_ops | |
|---|---|---|---|
| Target | Actual | ||
| Calibration 1 | 5,924,836 | ||
| Calibration 2 | 5,903,185 | ||
| Calibration 3 | 5,912,587 | ||
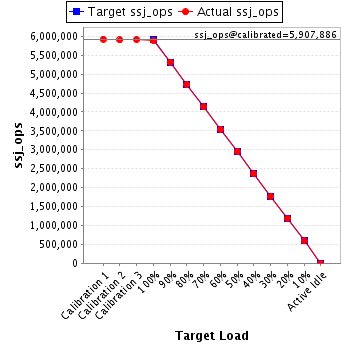
| ssj_ops@calibrated=5,907,886 | |||
| 100% | 99.7% | 5,907,886 | 5,890,757 |
| 90% | 90.0% | 5,317,098 | 5,317,827 |
| 80% | 80.0% | 4,726,309 | 4,725,214 |
| 70% | 70.0% | 4,135,520 | 4,132,644 |
| 60% | 60.0% | 3,544,732 | 3,542,562 |
| 50% | 50.0% | 2,953,943 | 2,954,321 |
| 40% | 40.0% | 2,363,154 | 2,362,467 |
| 30% | 30.0% | 1,772,366 | 1,773,571 |
| 20% | 20.0% | 1,181,577 | 1,181,155 |
| 10% | 10.0% | 590,789 | 590,636 |
| Active Idle | 0 | 0 | |
| Target Load | Actual Load | ssj_ops | |
|---|---|---|---|
| Target | Actual | ||
| Calibration 1 | 5,918,242 | ||
| Calibration 2 | 5,907,207 | ||
| Calibration 3 | 5,912,154 | ||
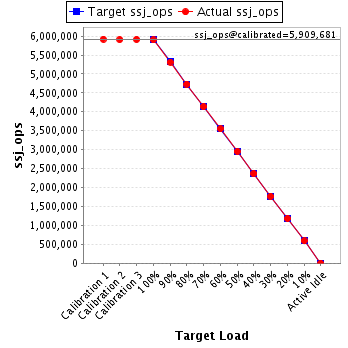
| ssj_ops@calibrated=5,909,681 | |||
| 100% | 99.8% | 5,909,681 | 5,897,489 |
| 90% | 89.9% | 5,318,712 | 5,313,188 |
| 80% | 80.0% | 4,727,744 | 4,730,395 |
| 70% | 70.0% | 4,136,776 | 4,135,446 |
| 60% | 60.0% | 3,545,808 | 3,548,140 |
| 50% | 50.0% | 2,954,840 | 2,955,065 |
| 40% | 40.0% | 2,363,872 | 2,364,476 |
| 30% | 30.0% | 1,772,904 | 1,771,191 |
| 20% | 20.0% | 1,181,936 | 1,180,681 |
| 10% | 10.0% | 590,968 | 591,707 |
| Active Idle | 0 | 0 | |
| Target Load | Actual Load | ssj_ops | |
|---|---|---|---|
| Target | Actual | ||
| Calibration 1 | 5,899,420 | ||
| Calibration 2 | 5,892,755 | ||
| Calibration 3 | 5,894,157 | ||
| ssj_ops@calibrated=5,893,456 | |||
| 100% | 99.7% | 5,893,456 | 5,873,618 |
| 90% | 90.1% | 5,304,110 | 5,308,748 |
| 80% | 80.0% | 4,714,765 | 4,715,744 |
| 70% | 69.9% | 4,125,419 | 4,121,682 |
| 60% | 59.9% | 3,536,073 | 3,530,621 |
| 50% | 50.0% | 2,946,728 | 2,948,032 |
| 40% | 40.1% | 2,357,382 | 2,362,342 |
| 30% | 30.0% | 1,768,037 | 1,767,156 |
| 20% | 20.0% | 1,178,691 | 1,180,962 |
| 10% | 10.0% | 589,346 | 590,369 |
| Active Idle | 0 | 0 | |

| Target Load | Actual Load | ssj_ops | |
|---|---|---|---|
| Target | Actual | ||
| Calibration 1 | 5,953,315 | ||
| Calibration 2 | 5,945,695 | ||
| Calibration 3 | 5,947,008 | ||
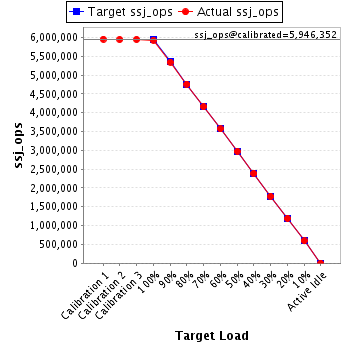
| ssj_ops@calibrated=5,946,352 | |||
| 100% | 99.7% | 5,946,352 | 5,927,886 |
| 90% | 89.9% | 5,351,717 | 5,344,201 |
| 80% | 80.0% | 4,757,081 | 4,759,525 |
| 70% | 69.9% | 4,162,446 | 4,159,162 |
| 60% | 60.0% | 3,567,811 | 3,567,263 |
| 50% | 50.0% | 2,973,176 | 2,975,177 |
| 40% | 40.1% | 2,378,541 | 2,385,380 |
| 30% | 30.0% | 1,783,906 | 1,780,965 |
| 20% | 20.1% | 1,189,270 | 1,192,445 |
| 10% | 10.0% | 594,635 | 595,783 |
| Active Idle | 0 | 0 | |