
SPECpower_ssj2008
Host 'SY480-06' Performance Report
Copyright © 2007-2019 Standard Performance Evaluation Corporation
| Hewlett Packard Enterprise Synergy 480 Gen10 Compute Module | ssj_ops@100% = 5,890,757 ssj_ops@100% per JVM = 1,472,689 |
||||
| Test Sponsor: | Hewlett Packard Enterprise | SPEC License #: | 3 | Test Method: | Multi Node |
| Tested By: | Hewlett Packard Enterprise | Test Location: | Houston, TX, USA | Test Date: | Mar 12, 2019 |
| Hardware Availability: | Apr-2019 | Software Availability: | Mar-2019 | Publication: | Apr 2, 2019 |
| System Source: | Single Supplier | System Designation: | Server | Power Provisioning: | Line-powered |
| Target Load | Actual Load | ssj_ops | |
|---|---|---|---|
| Target | Actual | ||
| Calibration 1 | 5,924,836 | ||
| Calibration 2 | 5,903,185 | ||
| Calibration 3 | 5,912,587 | ||
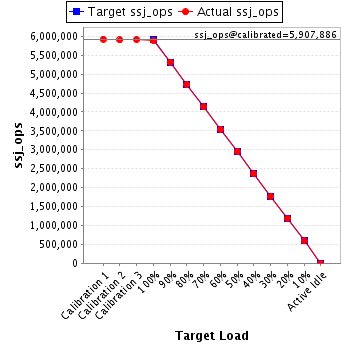
| ssj_ops@calibrated=5,907,886 | |||
| 100% | 99.7% | 5,907,886 | 5,890,757 |
| 90% | 90.0% | 5,317,098 | 5,317,827 |
| 80% | 80.0% | 4,726,309 | 4,725,214 |
| 70% | 70.0% | 4,135,520 | 4,132,644 |
| 60% | 60.0% | 3,544,732 | 3,542,562 |
| 50% | 50.0% | 2,953,943 | 2,954,321 |
| 40% | 40.0% | 2,363,154 | 2,362,467 |
| 30% | 30.0% | 1,772,366 | 1,773,571 |
| 20% | 20.0% | 1,181,577 | 1,181,155 |
| 10% | 10.0% | 590,789 | 590,636 |
| Active Idle | 0 | 0 | |
| Set Identifier: | SUT |
| Set Description: | System Under Test |
| # of Identical Nodes: | 9 |
| Comment: | SUT |
| Hardware | |
|---|---|
| Hardware Vendor: | Hewlett Packard Enterprise |
| Model: | Synergy 480 Gen10 Compute Module |
| Form Factor: | blade |
| CPU Name: | Intel Xeon Platinum 8280 @ 2.70GHz |
| CPU Characteristics: | 28-Core, 2.70 GHz, 38.5MB L3 Cache |
| CPU Frequency (MHz): | 2700 |
| CPU(s) Enabled: | 56 cores, 2 chips, 28 cores/chip |
| Hardware Threads: | 112 (2 / core) |
| CPU(s) Orderable: | 1,2 chips |
| Primary Cache: | 32 KB I + 32 KB D on chip per core |
| Secondary Cache: | 1 MB I+D on chip per core |
| Tertiary Cache: | 39424 KB I+D on chip per chip |
| Other Cache: | None |
| Memory Amount (GB): | 192 |
| # and size of DIMM: | 12 x 16384 MB |
| Memory Details: | 12 x 16GB 2Rx8 PC4-2933Y-R; slots 1, 3, 5, 8, 10 and 12 populated on each socket |
| Power Supply Quantity and Rating (W): | None |
| Power Supply Details: | N/A |
| Disk Drive: | 1 x HPE 480GB SATA 6G M.2 2280 (875498-B21) |
| Disk Controller: | HPE Smart Array S100i SR Gen10 |
| # and type of Network Interface Cards (NICs) Installed: | 1 x HPE Synergy 3820C 10/20Gb CNA |
| NICs Enabled in Firmware / OS / Connected: | 2/2/1 |
| Network Speed (Mbit): | 1000 |
| Keyboard: | None |
| Mouse: | None |
| Monitor: | None |
| Optical Drives: | No |
| Other Hardware: | None |
| Software | |
|---|---|
| Power Management: | Enabled (see SUT Notes) |
| Operating System (OS): | SUSE Linux Enterprise Server 12 SP4 |
| OS Version: | 4.12.14-94.41-default |
| Filesystem: | xfs |
| JVM Vendor: | Oracle Corporation |
| JVM Version: | Oracle Java HotSpot(TM) 64-Bit Server VM (build 24.80-b11, mixed mode), version 1.7.0_80 |
| JVM Command-line Options: | -server -Xmn19g -Xms21g -Xmx21g -XX:SurvivorRatio=1 -XX:TargetSurvivorRatio=99 -XX:AllocatePrefetchDistance=384 -XX:AllocatePrefetchLines=4 -XX:LoopUnrollLimit=37 -XX:InitialTenuringThreshold=12 -XX:MaxTenuringThreshold=15 -XX:ParallelGCThreads=28 -XX:InlineSmallCode=3900 -XX:MaxInlineSize=270 -XX:FreqInlineSize=2500 -XX:+AggressiveOpts -XX:+UseLargePages -XX:+UseParallelOldGC |
| JVM Affinity: | numactl --cpunodebind=[0-3] --localalloc |
| JVM Instances: | 4 |
| JVM Initial Heap (MB): | 21000 |
| JVM Maximum Heap (MB): | 21000 |
| JVM Address Bits: | 64 |
| Boot Firmware Version: | I42 v2.00 (02/02/2019) |
| Management Firmware Version: | 1.40 Feb 05 2019 |
| Workload Version: | SSJ 1.2.10 |
| Director Location: | Controller |
| Other Software: | HPE Service Pack for ProLiant (SPP) - Version 2019.03.0 (Mar 2019) |
| JVM Instance | ssj_ops@100% |
|---|---|
| SY480-06.001 | 1,473,585 |
| SY480-06.002 | 1,477,417 |
| SY480-06.003 | 1,472,986 |
| SY480-06.004 | 1,466,769 |
| ssj_ops@100% | 5,890,757 |
| ssj_ops@100% per JVM | 1,472,689 |

| Target Load | Actual Load | ssj_ops | |
|---|---|---|---|
| Target | Actual | ||
| Calibration 1 | 1,481,690 | ||
| Calibration 2 | 1,475,775 | ||
| Calibration 3 | 1,480,663 | ||
| ssj_ops@calibrated=1,478,219 | |||
| 100% | 99.7% | 1,478,219 | 1,473,585 |
| 90% | 90.0% | 1,330,397 | 1,330,538 |
| 80% | 79.9% | 1,182,575 | 1,181,694 |
| 70% | 69.9% | 1,034,753 | 1,033,410 |
| 60% | 59.8% | 886,931 | 884,637 |
| 50% | 50.1% | 739,109 | 741,002 |
| 40% | 40.0% | 591,288 | 591,712 |
| 30% | 30.2% | 443,466 | 446,035 |
| 20% | 19.9% | 295,644 | 294,762 |
| 10% | 9.9% | 147,822 | 146,799 |
| Active Idle | 0 | 0 | |

| Target Load | Actual Load | ssj_ops | |
|---|---|---|---|
| Target | Actual | ||
| Calibration 1 | 1,485,022 | ||
| Calibration 2 | 1,482,180 | ||
| Calibration 3 | 1,480,576 | ||
| ssj_ops@calibrated=1,481,378 | |||
| 100% | 99.7% | 1,481,378 | 1,477,417 |
| 90% | 89.9% | 1,333,240 | 1,331,632 |
| 80% | 80.1% | 1,185,103 | 1,185,919 |
| 70% | 70.0% | 1,036,965 | 1,037,058 |
| 60% | 60.0% | 888,827 | 888,109 |
| 50% | 50.0% | 740,689 | 741,219 |
| 40% | 40.0% | 592,551 | 592,718 |
| 30% | 30.0% | 444,413 | 444,792 |
| 20% | 20.0% | 296,276 | 297,007 |
| 10% | 10.0% | 148,138 | 148,139 |
| Active Idle | 0 | 0 | |

| Target Load | Actual Load | ssj_ops | |
|---|---|---|---|
| Target | Actual | ||
| Calibration 1 | 1,484,465 | ||
| Calibration 2 | 1,476,261 | ||
| Calibration 3 | 1,479,395 | ||
| ssj_ops@calibrated=1,477,828 | |||
| 100% | 99.7% | 1,477,828 | 1,472,986 |
| 90% | 90.2% | 1,330,045 | 1,332,981 |
| 80% | 79.9% | 1,182,262 | 1,180,858 |
| 70% | 70.0% | 1,034,479 | 1,034,448 |
| 60% | 60.1% | 886,697 | 887,882 |
| 50% | 49.9% | 738,914 | 736,742 |
| 40% | 40.0% | 591,131 | 591,755 |
| 30% | 30.0% | 443,348 | 443,708 |
| 20% | 20.0% | 295,566 | 296,188 |
| 10% | 10.1% | 147,783 | 148,609 |
| Active Idle | 0 | 0 | |

| Target Load | Actual Load | ssj_ops | |
|---|---|---|---|
| Target | Actual | ||
| Calibration 1 | 1,473,659 | ||
| Calibration 2 | 1,468,969 | ||
| Calibration 3 | 1,471,954 | ||
| ssj_ops@calibrated=1,470,461 | |||
| 100% | 99.7% | 1,470,461 | 1,466,769 |
| 90% | 89.9% | 1,323,415 | 1,322,675 |
| 80% | 80.0% | 1,176,369 | 1,176,742 |
| 70% | 69.9% | 1,029,323 | 1,027,727 |
| 60% | 60.0% | 882,277 | 881,935 |
| 50% | 50.0% | 735,231 | 735,358 |
| 40% | 39.9% | 588,184 | 586,282 |
| 30% | 29.9% | 441,138 | 439,037 |
| 20% | 19.9% | 294,092 | 293,198 |
| 10% | 10.0% | 147,046 | 147,089 |
| Active Idle | 0 | 0 | |
