SPECpower_ssj2008
Host 'SY480-04' Performance Report
Copyright © 2007-2019 Standard Performance Evaluation Corporation
| Hewlett Packard Enterprise Synergy 480 Gen10 Compute Module | ssj_ops@100% = 5,873,662 ssj_ops@100% per JVM = 1,468,415 |
||||
| Test Sponsor: | Hewlett Packard Enterprise | SPEC License #: | 3 | Test Method: | Multi Node |
| Tested By: | Hewlett Packard Enterprise | Test Location: | Houston, TX, USA | Test Date: | Mar 12, 2019 |
| Hardware Availability: | Apr-2019 | Software Availability: | Mar-2019 | Publication: | Apr 2, 2019 |
| System Source: | Single Supplier | System Designation: | Server | Power Provisioning: | Line-powered |
| Target Load | Actual Load | ssj_ops | |
|---|---|---|---|
| Target | Actual | ||
| Calibration 1 | 5,902,083 | ||
| Calibration 2 | 5,889,816 | ||
| Calibration 3 | 5,898,227 | ||
| ssj_ops@calibrated=5,894,022 | |||
| 100% | 99.7% | 5,894,022 | 5,873,662 |
| 90% | 89.9% | 5,304,620 | 5,300,436 |
| 80% | 80.2% | 4,715,217 | 4,725,154 |
| 70% | 70.1% | 4,125,815 | 4,130,714 |
| 60% | 59.9% | 3,536,413 | 3,531,002 |
| 50% | 50.0% | 2,947,011 | 2,949,320 |
| 40% | 39.9% | 2,357,609 | 2,354,617 |
| 30% | 30.0% | 1,768,207 | 1,767,774 |
| 20% | 20.0% | 1,178,804 | 1,180,965 |
| 10% | 10.0% | 589,402 | 589,681 |
| Active Idle | 0 | 0 | |

| Set Identifier: | SUT |
| Set Description: | System Under Test |
| # of Identical Nodes: | 9 |
| Comment: | SUT |
| Hardware | |
|---|---|
| Hardware Vendor: | Hewlett Packard Enterprise |
| Model: | Synergy 480 Gen10 Compute Module |
| Form Factor: | blade |
| CPU Name: | Intel Xeon Platinum 8280 @ 2.70GHz |
| CPU Characteristics: | 28-Core, 2.70 GHz, 38.5MB L3 Cache |
| CPU Frequency (MHz): | 2700 |
| CPU(s) Enabled: | 56 cores, 2 chips, 28 cores/chip |
| Hardware Threads: | 112 (2 / core) |
| CPU(s) Orderable: | 1,2 chips |
| Primary Cache: | 32 KB I + 32 KB D on chip per core |
| Secondary Cache: | 1 MB I+D on chip per core |
| Tertiary Cache: | 39424 KB I+D on chip per chip |
| Other Cache: | None |
| Memory Amount (GB): | 192 |
| # and size of DIMM: | 12 x 16384 MB |
| Memory Details: | 12 x 16GB 2Rx8 PC4-2933Y-R; slots 1, 3, 5, 8, 10 and 12 populated on each socket |
| Power Supply Quantity and Rating (W): | None |
| Power Supply Details: | N/A |
| Disk Drive: | 1 x HPE 480GB SATA 6G M.2 2280 (875498-B21) |
| Disk Controller: | HPE Smart Array S100i SR Gen10 |
| # and type of Network Interface Cards (NICs) Installed: | 1 x HPE Synergy 3820C 10/20Gb CNA |
| NICs Enabled in Firmware / OS / Connected: | 2/2/1 |
| Network Speed (Mbit): | 1000 |
| Keyboard: | None |
| Mouse: | None |
| Monitor: | None |
| Optical Drives: | No |
| Other Hardware: | None |
| Software | |
|---|---|
| Power Management: | Enabled (see SUT Notes) |
| Operating System (OS): | SUSE Linux Enterprise Server 12 SP4 |
| OS Version: | 4.12.14-94.41-default |
| Filesystem: | xfs |
| JVM Vendor: | Oracle Corporation |
| JVM Version: | Oracle Java HotSpot(TM) 64-Bit Server VM (build 24.80-b11, mixed mode), version 1.7.0_80 |
| JVM Command-line Options: | -server -Xmn19g -Xms21g -Xmx21g -XX:SurvivorRatio=1 -XX:TargetSurvivorRatio=99 -XX:AllocatePrefetchDistance=384 -XX:AllocatePrefetchLines=4 -XX:LoopUnrollLimit=37 -XX:InitialTenuringThreshold=12 -XX:MaxTenuringThreshold=15 -XX:ParallelGCThreads=28 -XX:InlineSmallCode=3900 -XX:MaxInlineSize=270 -XX:FreqInlineSize=2500 -XX:+AggressiveOpts -XX:+UseLargePages -XX:+UseParallelOldGC |
| JVM Affinity: | numactl --cpunodebind=[0-3] --localalloc |
| JVM Instances: | 4 |
| JVM Initial Heap (MB): | 21000 |
| JVM Maximum Heap (MB): | 21000 |
| JVM Address Bits: | 64 |
| Boot Firmware Version: | I42 v2.00 (02/02/2019) |
| Management Firmware Version: | 1.40 Feb 05 2019 |
| Workload Version: | SSJ 1.2.10 |
| Director Location: | Controller |
| Other Software: | HPE Service Pack for ProLiant (SPP) - Version 2019.03.0 (Mar 2019) |
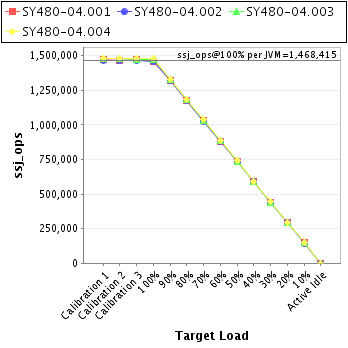
| JVM Instance | ssj_ops@100% |
|---|---|
| SY480-04.001 | 1,461,691 |
| SY480-04.002 | 1,461,461 |
| SY480-04.003 | 1,474,007 |
| SY480-04.004 | 1,476,503 |
| ssj_ops@100% | 5,873,662 |
| ssj_ops@100% per JVM | 1,468,415 |
| Target Load | Actual Load | ssj_ops | |
|---|---|---|---|
| Target | Actual | ||
| Calibration 1 | 1,471,428 | ||
| Calibration 2 | 1,467,012 | ||
| Calibration 3 | 1,471,528 | ||
| ssj_ops@calibrated=1,469,270 | |||
| 100% | 99.5% | 1,469,270 | 1,461,691 |
| 90% | 89.9% | 1,322,343 | 1,320,760 |
| 80% | 80.2% | 1,175,416 | 1,177,835 |
| 70% | 70.1% | 1,028,489 | 1,029,663 |
| 60% | 59.8% | 881,562 | 878,701 |
| 50% | 50.1% | 734,635 | 736,259 |
| 40% | 40.0% | 587,708 | 588,241 |
| 30% | 30.0% | 440,781 | 441,361 |
| 20% | 20.0% | 293,854 | 294,323 |
| 10% | 10.1% | 146,927 | 148,864 |
| Active Idle | 0 | 0 | |

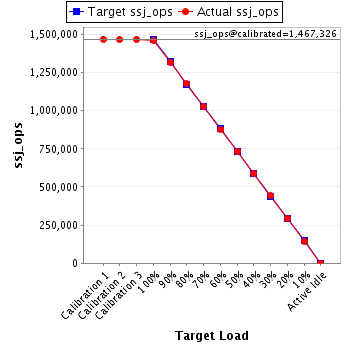
| Target Load | Actual Load | ssj_ops | |
|---|---|---|---|
| Target | Actual | ||
| Calibration 1 | 1,468,804 | ||
| Calibration 2 | 1,466,605 | ||
| Calibration 3 | 1,468,048 | ||
| ssj_ops@calibrated=1,467,326 | |||
| 100% | 99.6% | 1,467,326 | 1,461,461 |
| 90% | 89.9% | 1,320,594 | 1,319,060 |
| 80% | 80.2% | 1,173,861 | 1,177,126 |
| 70% | 70.0% | 1,027,128 | 1,026,991 |
| 60% | 59.9% | 880,396 | 878,821 |
| 50% | 49.9% | 733,663 | 732,560 |
| 40% | 40.0% | 586,931 | 587,444 |
| 30% | 30.1% | 440,198 | 441,182 |
| 20% | 20.1% | 293,465 | 295,448 |
| 10% | 9.9% | 146,733 | 145,842 |
| Active Idle | 0 | 0 | |
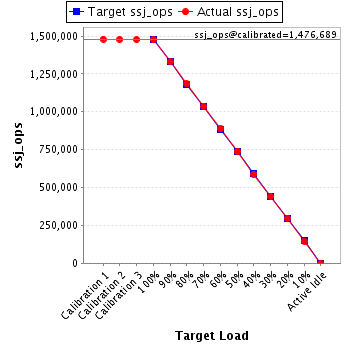
| Target Load | Actual Load | ssj_ops | |
|---|---|---|---|
| Target | Actual | ||
| Calibration 1 | 1,479,496 | ||
| Calibration 2 | 1,477,080 | ||
| Calibration 3 | 1,476,298 | ||
| ssj_ops@calibrated=1,476,689 | |||
| 100% | 99.8% | 1,476,689 | 1,474,007 |
| 90% | 90.0% | 1,329,020 | 1,329,399 |
| 80% | 80.2% | 1,181,351 | 1,184,255 |
| 70% | 70.1% | 1,033,683 | 1,034,833 |
| 60% | 60.1% | 886,014 | 887,354 |
| 50% | 50.0% | 738,345 | 738,767 |
| 40% | 39.9% | 590,676 | 589,045 |
| 30% | 29.9% | 443,007 | 441,811 |
| 20% | 20.0% | 295,338 | 295,650 |
| 10% | 9.9% | 147,669 | 146,572 |
| Active Idle | 0 | 0 | |
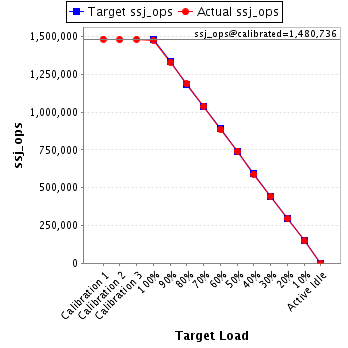
| Target Load | Actual Load | ssj_ops | |
|---|---|---|---|
| Target | Actual | ||
| Calibration 1 | 1,482,355 | ||
| Calibration 2 | 1,479,119 | ||
| Calibration 3 | 1,482,353 | ||
| ssj_ops@calibrated=1,480,736 | |||
| 100% | 99.7% | 1,480,736 | 1,476,503 |
| 90% | 89.9% | 1,332,662 | 1,331,217 |
| 80% | 80.1% | 1,184,589 | 1,185,937 |
| 70% | 70.2% | 1,036,515 | 1,039,228 |
| 60% | 59.8% | 888,442 | 886,126 |
| 50% | 50.1% | 740,368 | 741,734 |
| 40% | 39.8% | 592,294 | 589,887 |
| 30% | 29.9% | 444,221 | 443,421 |
| 20% | 20.0% | 296,147 | 295,543 |
| 10% | 10.0% | 148,074 | 148,404 |
| Active Idle | 0 | 0 | |