SPECpower_ssj2008
Host 'SY480-09' Performance Report
Copyright © 2007-2019 Standard Performance Evaluation Corporation
| Hewlett Packard Enterprise Synergy 480 Gen10 Compute Module | ssj_ops@100% = 5,927,886 ssj_ops@100% per JVM = 1,481,972 |
||||
| Test Sponsor: | Hewlett Packard Enterprise | SPEC License #: | 3 | Test Method: | Multi Node |
| Tested By: | Hewlett Packard Enterprise | Test Location: | Houston, TX, USA | Test Date: | Mar 12, 2019 |
| Hardware Availability: | Apr-2019 | Software Availability: | Mar-2019 | Publication: | Apr 2, 2019 |
| System Source: | Single Supplier | System Designation: | Server | Power Provisioning: | Line-powered |
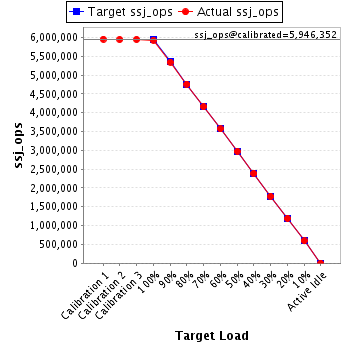
| Target Load | Actual Load | ssj_ops | |
|---|---|---|---|
| Target | Actual | ||
| Calibration 1 | 5,953,315 | ||
| Calibration 2 | 5,945,695 | ||
| Calibration 3 | 5,947,008 | ||
| ssj_ops@calibrated=5,946,352 | |||
| 100% | 99.7% | 5,946,352 | 5,927,886 |
| 90% | 89.9% | 5,351,717 | 5,344,201 |
| 80% | 80.0% | 4,757,081 | 4,759,525 |
| 70% | 69.9% | 4,162,446 | 4,159,162 |
| 60% | 60.0% | 3,567,811 | 3,567,263 |
| 50% | 50.0% | 2,973,176 | 2,975,177 |
| 40% | 40.1% | 2,378,541 | 2,385,380 |
| 30% | 30.0% | 1,783,906 | 1,780,965 |
| 20% | 20.1% | 1,189,270 | 1,192,445 |
| 10% | 10.0% | 594,635 | 595,783 |
| Active Idle | 0 | 0 | |
| Set Identifier: | SUT |
| Set Description: | System Under Test |
| # of Identical Nodes: | 9 |
| Comment: | SUT |
| Hardware | |
|---|---|
| Hardware Vendor: | Hewlett Packard Enterprise |
| Model: | Synergy 480 Gen10 Compute Module |
| Form Factor: | blade |
| CPU Name: | Intel Xeon Platinum 8280 @ 2.70GHz |
| CPU Characteristics: | 28-Core, 2.70 GHz, 38.5MB L3 Cache |
| CPU Frequency (MHz): | 2700 |
| CPU(s) Enabled: | 56 cores, 2 chips, 28 cores/chip |
| Hardware Threads: | 112 (2 / core) |
| CPU(s) Orderable: | 1,2 chips |
| Primary Cache: | 32 KB I + 32 KB D on chip per core |
| Secondary Cache: | 1 MB I+D on chip per core |
| Tertiary Cache: | 39424 KB I+D on chip per chip |
| Other Cache: | None |
| Memory Amount (GB): | 192 |
| # and size of DIMM: | 12 x 16384 MB |
| Memory Details: | 12 x 16GB 2Rx8 PC4-2933Y-R; slots 1, 3, 5, 8, 10 and 12 populated on each socket |
| Power Supply Quantity and Rating (W): | None |
| Power Supply Details: | N/A |
| Disk Drive: | 1 x HPE 480GB SATA 6G M.2 2280 (875498-B21) |
| Disk Controller: | HPE Smart Array S100i SR Gen10 |
| # and type of Network Interface Cards (NICs) Installed: | 1 x HPE Synergy 3820C 10/20Gb CNA |
| NICs Enabled in Firmware / OS / Connected: | 2/2/1 |
| Network Speed (Mbit): | 1000 |
| Keyboard: | None |
| Mouse: | None |
| Monitor: | None |
| Optical Drives: | No |
| Other Hardware: | None |
| Software | |
|---|---|
| Power Management: | Enabled (see SUT Notes) |
| Operating System (OS): | SUSE Linux Enterprise Server 12 SP4 |
| OS Version: | 4.12.14-94.41-default |
| Filesystem: | xfs |
| JVM Vendor: | Oracle Corporation |
| JVM Version: | Oracle Java HotSpot(TM) 64-Bit Server VM (build 24.80-b11, mixed mode), version 1.7.0_80 |
| JVM Command-line Options: | -server -Xmn19g -Xms21g -Xmx21g -XX:SurvivorRatio=1 -XX:TargetSurvivorRatio=99 -XX:AllocatePrefetchDistance=384 -XX:AllocatePrefetchLines=4 -XX:LoopUnrollLimit=37 -XX:InitialTenuringThreshold=12 -XX:MaxTenuringThreshold=15 -XX:ParallelGCThreads=28 -XX:InlineSmallCode=3900 -XX:MaxInlineSize=270 -XX:FreqInlineSize=2500 -XX:+AggressiveOpts -XX:+UseLargePages -XX:+UseParallelOldGC |
| JVM Affinity: | numactl --cpunodebind=[0-3] --localalloc |
| JVM Instances: | 4 |
| JVM Initial Heap (MB): | 21000 |
| JVM Maximum Heap (MB): | 21000 |
| JVM Address Bits: | 64 |
| Boot Firmware Version: | I42 v2.00 (02/02/2019) |
| Management Firmware Version: | 1.40 Feb 05 2019 |
| Workload Version: | SSJ 1.2.10 |
| Director Location: | Controller |
| Other Software: | HPE Service Pack for ProLiant (SPP) - Version 2019.03.0 (Mar 2019) |
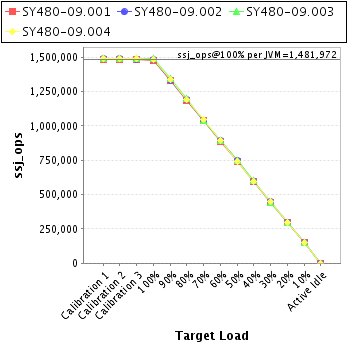
| JVM Instance | ssj_ops@100% |
|---|---|
| SY480-09.001 | 1,475,052 |
| SY480-09.002 | 1,481,099 |
| SY480-09.003 | 1,487,117 |
| SY480-09.004 | 1,484,618 |
| ssj_ops@100% | 5,927,886 |
| ssj_ops@100% per JVM | 1,481,972 |
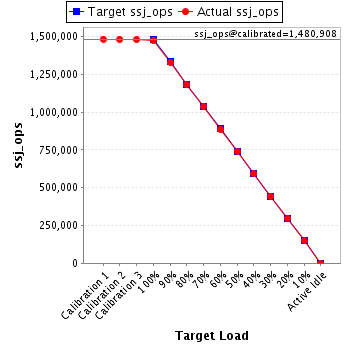
| Target Load | Actual Load | ssj_ops | |
|---|---|---|---|
| Target | Actual | ||
| Calibration 1 | 1,482,560 | ||
| Calibration 2 | 1,480,934 | ||
| Calibration 3 | 1,480,882 | ||
| ssj_ops@calibrated=1,480,908 | |||
| 100% | 99.6% | 1,480,908 | 1,475,052 |
| 90% | 89.8% | 1,332,817 | 1,330,133 |
| 80% | 79.9% | 1,184,726 | 1,183,590 |
| 70% | 70.0% | 1,036,636 | 1,036,916 |
| 60% | 59.8% | 888,545 | 885,511 |
| 50% | 50.1% | 740,454 | 741,272 |
| 40% | 40.1% | 592,363 | 593,407 |
| 30% | 29.9% | 444,272 | 442,872 |
| 20% | 20.1% | 296,182 | 297,891 |
| 10% | 10.0% | 148,091 | 148,692 |
| Active Idle | 0 | 0 | |
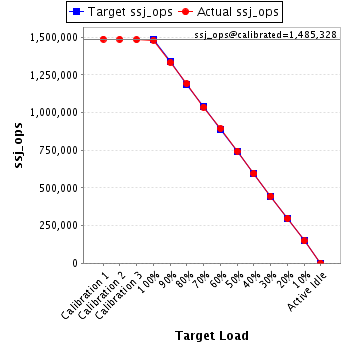
| Target Load | Actual Load | ssj_ops | |
|---|---|---|---|
| Target | Actual | ||
| Calibration 1 | 1,487,782 | ||
| Calibration 2 | 1,486,530 | ||
| Calibration 3 | 1,484,125 | ||
| ssj_ops@calibrated=1,485,328 | |||
| 100% | 99.7% | 1,485,328 | 1,481,099 |
| 90% | 89.7% | 1,336,795 | 1,332,912 |
| 80% | 80.3% | 1,188,262 | 1,192,364 |
| 70% | 69.8% | 1,039,729 | 1,037,328 |
| 60% | 60.3% | 891,197 | 894,960 |
| 50% | 50.1% | 742,664 | 744,193 |
| 40% | 40.1% | 594,131 | 594,910 |
| 30% | 30.1% | 445,598 | 446,424 |
| 20% | 20.0% | 297,066 | 297,600 |
| 10% | 10.0% | 148,533 | 148,790 |
| Active Idle | 0 | 0 | |
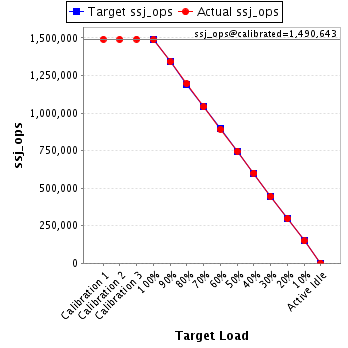
| Target Load | Actual Load | ssj_ops | |
|---|---|---|---|
| Target | Actual | ||
| Calibration 1 | 1,490,798 | ||
| Calibration 2 | 1,489,411 | ||
| Calibration 3 | 1,491,874 | ||
| ssj_ops@calibrated=1,490,643 | |||
| 100% | 99.8% | 1,490,643 | 1,487,117 |
| 90% | 90.0% | 1,341,578 | 1,341,839 |
| 80% | 80.2% | 1,192,514 | 1,195,650 |
| 70% | 69.9% | 1,043,450 | 1,041,878 |
| 60% | 59.8% | 894,386 | 891,995 |
| 50% | 50.0% | 745,321 | 745,923 |
| 40% | 40.3% | 596,257 | 600,130 |
| 30% | 29.9% | 447,193 | 445,695 |
| 20% | 20.0% | 298,129 | 297,423 |
| 10% | 10.0% | 149,064 | 149,257 |
| Active Idle | 0 | 0 | |
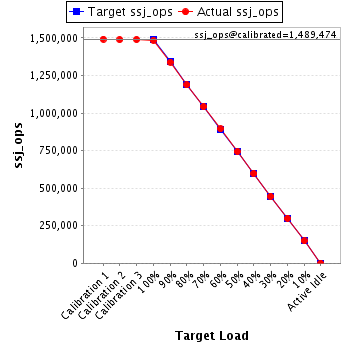
| Target Load | Actual Load | ssj_ops | |
|---|---|---|---|
| Target | Actual | ||
| Calibration 1 | 1,492,175 | ||
| Calibration 2 | 1,488,819 | ||
| Calibration 3 | 1,490,128 | ||
| ssj_ops@calibrated=1,489,474 | |||
| 100% | 99.7% | 1,489,474 | 1,484,618 |
| 90% | 89.9% | 1,340,526 | 1,339,317 |
| 80% | 79.8% | 1,191,579 | 1,187,920 |
| 70% | 70.0% | 1,042,631 | 1,043,039 |
| 60% | 60.1% | 893,684 | 894,797 |
| 50% | 49.9% | 744,737 | 743,789 |
| 40% | 40.1% | 595,789 | 596,934 |
| 30% | 29.9% | 446,842 | 445,974 |
| 20% | 20.1% | 297,895 | 299,530 |
| 10% | 10.0% | 148,947 | 149,045 |
| Active Idle | 0 | 0 | |