
SPECpower_ssj2008
Aggregate Performance Report
Copyright © 2007-2016 Standard Performance Evaluation Corporation
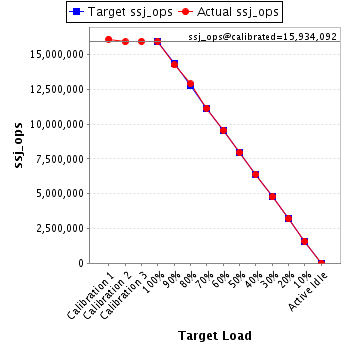
| Huawei Technologies Co., Ltd Fusion Server XH620 V3 | ssj_ops@100% = 15,938,684 ssj_ops@100% per Host = 3,984,671 ssj_ops@100% per JVM = 199,234 |
||||
| Test Sponsor: | Huawei Technologies Co., Ltd | SPEC License #: | 3175 | Test Method: | Multi Node |
| Tested By: | Huawei Technologies Co., Ltd | Test Location: | Shenzhen, Guangdong, China | Test Date: | Apr 11, 2016 |
| Hardware Availability: | Mar-2016 | Software Availability: | Jan-2015 | Publication: | Apr 27, 2016 |
| System Source: | Single Supplier | System Designation: | Server | Power Provisioning: | Line-powered |
| Target Load | Actual Load | ssj_ops | |
|---|---|---|---|
| Target | Actual | ||
| Calibration 1 | 16,111,885 | ||
| Calibration 2 | 15,917,904 | ||
| Calibration 3 | 15,950,280 | ||
| ssj_ops@calibrated=15,934,092 | |||
| 100% | 100.0% | 15,934,092 | 15,938,684 |
| 90% | 89.5% | 14,340,683 | 14,262,247 |
| 80% | 80.9% | 12,747,274 | 12,892,901 |
| 70% | 70.0% | 11,153,865 | 11,149,796 |
| 60% | 60.0% | 9,560,455 | 9,564,286 |
| 50% | 50.0% | 7,967,046 | 7,964,190 |
| 40% | 40.0% | 6,373,637 | 6,378,951 |
| 30% | 29.9% | 4,780,228 | 4,770,999 |
| 20% | 20.0% | 3,186,818 | 3,192,686 |
| 10% | 10.0% | 1,593,409 | 1,590,602 |
| Active Idle | 0 | 0 | |
| # of Nodes | # of Chips | # of Cores | # of Threads | Total RAM (GB) | # of OS Images | # of JVM Instances |
|---|---|---|---|---|---|---|
| 4 | 8 | 160 | 320 | 256 | 4 | 80 |
| Set Identifier: | sut |
| Set Description: | System Under Test |
| # of Identical Nodes: | 4 |
| Comment: | None |
| Hardware per Node | |
|---|---|
| Hardware Vendor: | Huawei Technologies Co., Ltd |
| Model: | Fusion Server XH620 V3 |
| Form Factor: | 4U |
| CPU Name: | Intel Xeon E5-2698 V4 |
| CPU Characteristics: | 20-Core, 2.2GHz, 50MB L3 Cache (Intel Turbo Boost Technology up to 3.6GHz) |
| CPU Frequency (MHz): | 2200 |
| CPU(s) Enabled: | 40 cores, 2 chips, 20 cores/chip |
| Hardware Threads: | 80 (2 / core) |
| CPU(s) Orderable: | 1,2 chips |
| Primary Cache: | 32 KB I + 32 KB D on chip per core |
| Secondary Cache: | 256 KB I+D on chip per core |
| Tertiary Cache: | 50 MB I+D on chip per chip |
| Other Cache: | None |
| Memory Amount (GB): | 64 |
| # and size of DIMM: | 8 x 8 GB |
| Memory Details: | 8GB 2Rx8 PC4-2400T ECC RDIMM;slots DIMM000, DIMM010, DIMM020, DIMM030,DIMM100, DIMM110, DIMM120, and DIMM130 populated |
| Power Supply Quantity and Rating (W): | None |
| Power Supply Details: | Shared |
| Disk Drive: | 1 x 32GB SATADOM Huawei P/N 06010249 |
| Disk Controller: | Integrated SATA controller |
| # and type of Network Interface Cards (NICs) Installed: | 1 x Dual-port Intel i350 Gigabit Ethernet controller Huawei P/N 02311HDL |
| NICs Enabled in Firmware / OS / Connected: | 2/2/1 |
| Network Speed (Mbit): | 1000 |
| Keyboard: | None |
| Mouse: | None |
| Monitor: | None |
| Optical Drives: | No |
| Other Hardware: | None |
| Software per Node | |
|---|---|
| Power Management: | Power Saver Mode enabled in OS |
| Operating System (OS): | Microsoft Windows Server 2012 R2 Datacenter |
| OS Version: | Version 6.3 (Build 9600) |
| Filesystem: | NTFS |
| JVM Vendor: | Oracle Corporation |
| JVM Version: | Oracle Java HotSpot(TM) 64-Bit Server VM (build 24.80-b11, mixed mode), version 1.7.0_80 |
| JVM Command-line Options: | -server -Xmx1575m -Xms1575m -Xmn1420m -XX:SurvivorRatio=1 -XX:TargetSurvivorRatio=99 -XX:ParallelGCThreads=4 -XX:AllocatePrefetchDistance=256 -XX:AllocatePrefetchLines=4 -XX:LoopUnrollLimit=45 -XX:InitialTenuringThreshold=12 -XX:MaxTenuringThreshold=15 -XX:InlineSmallCode=9000 -XX:MaxInlineSize=270 -XX:FreqInlineSize=6000 -XX:+UseLargePages -XX:+UseParallelOldGC -XX:+AggressiveOpts |
| JVM Affinity: | start /NODE [0,1,2,3] /AFFINITY [F,F0,F00,F000,F0000] |
| JVM Instances: | 20 |
| JVM Initial Heap (MB): | 1575 |
| JVM Maximum Heap (MB): | 1575 |
| JVM Address Bits: | 64 |
| Boot Firmware Version: | 3.16 |
| Management Firmware Version: | 2.02 |
| Workload Version: | SSJ 1.2.10 |
| Director Location: | Controller |
| Other Software: | none |
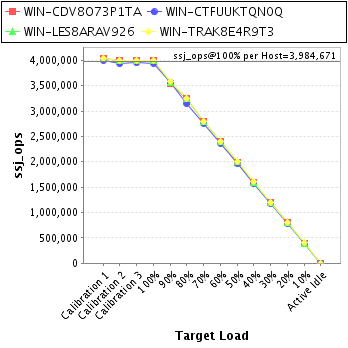
| Host | ssj_ops@100% |
|---|---|
| WIN-CDV8O73P1TA | 3,996,672 |
| WIN-CTFUUKTQN0Q | 3,942,516 |
| WIN-LES8ARAV926 | 3,998,169 |
| WIN-TRAK8E4R9T3 | 4,001,327 |
| ssj_ops@100% | 15,938,684 |
| ssj_ops@100% per Host | 3,984,671 |
| ssj_ops@100% per JVM | 199,234 |
| Target Load | Actual Load | ssj_ops | |
|---|---|---|---|
| Target | Actual | ||
| Calibration 1 | 4,038,637 | ||
| Calibration 2 | 3,994,576 | ||
| Calibration 3 | 4,000,225 | ||
| ssj_ops@calibrated=3,997,401 | |||
| 100% | 100.0% | 3,997,401 | 3,996,672 |
| 90% | 88.7% | 3,597,661 | 3,545,380 |
| 80% | 81.3% | 3,197,921 | 3,251,680 |
| 70% | 69.9% | 2,798,181 | 2,792,467 |
| 60% | 60.0% | 2,398,441 | 2,396,535 |
| 50% | 49.9% | 1,998,700 | 1,994,840 |
| 40% | 39.9% | 1,598,960 | 1,596,788 |
| 30% | 29.9% | 1,199,220 | 1,194,537 |
| 20% | 20.1% | 799,480 | 803,796 |
| 10% | 10.0% | 399,740 | 398,905 |
| Active Idle | 0 | 0 | |

| Target Load | Actual Load | ssj_ops | |
|---|---|---|---|
| Target | Actual | ||
| Calibration 1 | 3,998,066 | ||
| Calibration 2 | 3,934,180 | ||
| Calibration 3 | 3,947,529 | ||
| ssj_ops@calibrated=3,940,855 | |||
| 100% | 100.0% | 3,940,855 | 3,942,516 |
| 90% | 90.6% | 3,546,769 | 3,569,803 |
| 80% | 79.8% | 3,152,684 | 3,146,345 |
| 70% | 70.0% | 2,758,598 | 2,758,693 |
| 60% | 60.1% | 2,364,513 | 2,367,689 |
| 50% | 50.0% | 1,970,427 | 1,969,682 |
| 40% | 40.1% | 1,576,342 | 1,579,385 |
| 30% | 29.9% | 1,182,256 | 1,178,072 |
| 20% | 20.0% | 788,171 | 787,155 |
| 10% | 10.0% | 394,085 | 393,723 |
| Active Idle | 0 | 0 | |

| Target Load | Actual Load | ssj_ops | |
|---|---|---|---|
| Target | Actual | ||
| Calibration 1 | 4,034,032 | ||
| Calibration 2 | 3,995,489 | ||
| Calibration 3 | 4,001,561 | ||
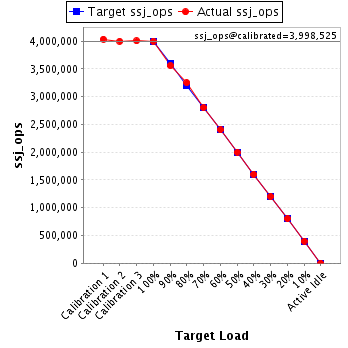
| ssj_ops@calibrated=3,998,525 | |||
| 100% | 100.0% | 3,998,525 | 3,998,169 |
| 90% | 89.0% | 3,598,672 | 3,558,804 |
| 80% | 81.3% | 3,198,820 | 3,249,955 |
| 70% | 70.0% | 2,798,967 | 2,798,411 |
| 60% | 60.1% | 2,399,115 | 2,401,302 |
| 50% | 50.0% | 1,999,262 | 1,999,832 |
| 40% | 40.0% | 1,599,410 | 1,599,882 |
| 30% | 30.0% | 1,199,557 | 1,200,591 |
| 20% | 20.0% | 799,705 | 801,201 |
| 10% | 10.0% | 399,852 | 398,386 |
| Active Idle | 0 | 0 | |
| Target Load | Actual Load | ssj_ops | |
|---|---|---|---|
| Target | Actual | ||
| Calibration 1 | 4,041,150 | ||
| Calibration 2 | 3,993,659 | ||
| Calibration 3 | 4,000,965 | ||
| ssj_ops@calibrated=3,997,312 | |||
| 100% | 100.1% | 3,997,312 | 4,001,327 |
| 90% | 89.8% | 3,597,581 | 3,588,261 |
| 80% | 81.2% | 3,197,849 | 3,244,921 |
| 70% | 70.1% | 2,798,118 | 2,800,226 |
| 60% | 60.0% | 2,398,387 | 2,398,760 |
| 50% | 50.0% | 1,998,656 | 1,999,837 |
| 40% | 40.1% | 1,598,925 | 1,602,897 |
| 30% | 30.0% | 1,199,194 | 1,197,800 |
| 20% | 20.0% | 799,462 | 800,535 |
| 10% | 10.0% | 399,731 | 399,589 |
| Active Idle | 0 | 0 | |
