SPECpower_ssj2008
Aggregate Performance Report
Copyright © 2007-2023 Standard Performance Evaluation Corporation
| Fujitsu FUJITSU Server PRIMERGY CX2560 M7 | ssj_ops@100% = 33,244,766 ssj_ops@100% per Host = 8,311,192 ssj_ops@100% per JVM = 129,862 |
||||
| Test Sponsor: | Fujitsu | SPEC License #: | 19 | Test Method: | Multi Node |
| Tested By: | Fujitsu | Test Location: | Kawasaki, Kanagawa, Japan | Test Date: | Apr 12, 2023 |
| Hardware Availability: | May-2023 | Software Availability: | Aug-2022 | Publication: | Apr 27, 2023 |
| System Source: | Single Supplier | System Designation: | Server | Power Provisioning: | Line-powered |
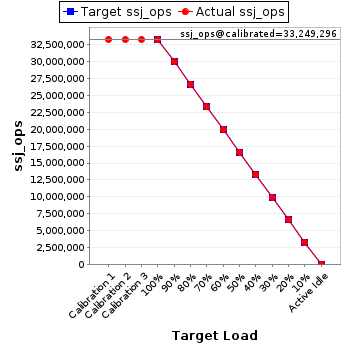
| Target Load | Actual Load | ssj_ops | |
|---|---|---|---|
| Target | Actual | ||
| Calibration 1 | 33,254,864 | ||
| Calibration 2 | 33,228,329 | ||
| Calibration 3 | 33,270,263 | ||
| ssj_ops@calibrated=33,249,296 | |||
| 100% | 100.0% | 33,249,296 | 33,244,766 |
| 90% | 90.0% | 29,924,367 | 29,919,914 |
| 80% | 80.1% | 26,599,437 | 26,629,892 |
| 70% | 70.0% | 23,274,507 | 23,273,792 |
| 60% | 60.1% | 19,949,578 | 19,973,092 |
| 50% | 50.0% | 16,624,648 | 16,626,128 |
| 40% | 40.0% | 13,299,718 | 13,293,306 |
| 30% | 30.0% | 9,974,789 | 9,985,041 |
| 20% | 20.0% | 6,649,859 | 6,659,775 |
| 10% | 10.0% | 3,324,930 | 3,322,452 |
| Active Idle | 0 | 0 | |
| # of Nodes | # of Chips | # of Cores | # of Threads | Total RAM (GB) | # of OS Images | # of JVM Instances |
|---|---|---|---|---|---|---|
| 4 | 8 | 256 | 512 | 1,024 | 4 | 256 |
| Set Identifier: | CX2560M7 |
| Set Description: | System Under Test |
| # of Identical Nodes: | 4 |
| Comment: | Multi Node |
| Hardware per Node | |
|---|---|
| Hardware Vendor: | Fujitsu |
| Model: | FUJITSU Server PRIMERGY CX2560 M7 |
| Form Factor: | Blade |
| CPU Name: | Intel Xeon Gold 6428N |
| CPU Characteristics: | 32-Core, 1.8GHz, 60MB L3 Cache |
| CPU Frequency (MHz): | 1800 |
| CPU(s) Enabled: | 64 cores, 2 chips, 32 cores/chip |
| Hardware Threads: | 128 (2 / core) |
| CPU(s) Orderable: | 1,2 chips |
| Primary Cache: | 32 KB I + 48 KB D on chip per core |
| Secondary Cache: | 2 MB I+D on chip per core |
| Tertiary Cache: | 60 MB I+D on chip per chip |
| Other Cache: | None |
| Memory Amount (GB): | 256 |
| # and size of DIMM: | 16 x 16384 MB |
| Memory Details: | 16 x 16 GB 1Rx8 PC5-4800B; slots 1A, 1B, 1C, 1D, 1E, 1F, 1G, 1H, 1J, 1K, 1L, 1M, 1N, 1P, 1Q, 1R populated |
| Power Supply Quantity and Rating (W): | None |
| Power Supply Details: | N/A |
| Disk Drive: | 1 x SSD M.2 240GB, S26361-F5787-E240 |
| Disk Controller: | Integrated SATA Controller |
| # and type of Network Interface Cards (NICs) Installed: | 2 x Intel I210 Gigabit Network Connection (onboard) |
| NICs Enabled in Firmware / OS / Connected: | 1/1/1 |
| Network Speed (Mbit): | 1000 |
| Keyboard: | None |
| Mouse: | None |
| Monitor: | None |
| Optical Drives: | No |
| Other Hardware: | None |
| Software per Node | |
|---|---|
| Power Management: | Power saver |
| Operating System (OS): | Windows Server 2022 Standard |
| OS Version: | Version 21H2, OS build 20348.169 |
| Filesystem: | ntfs |
| JVM Vendor: | Oracle Corporation |
| JVM Version: | Oracle Java HotSpot(TM) 64-Bit Server VM 18.9 (build 11.0.16.1+1-LTS, mixed mode) |
| JVM Command-line Options: | -server -Xmn1500m -Xms1625m -Xmx1625m -XX:+UseLargePages -XX:AllocatePrefetchDistance=256 -XX:AllocatePrefetchLines=4 -XX:InlineSmallCode=3900 -XX:MaxInlineSize=270 -XX:MaxTenuringThreshold=15 -XX:ParallelGCThreads=2 -XX:SurvivorRatio=1 -XX:TargetSurvivorRatio=99 -XX:-UseAdaptiveSizePolicy -XX:+UseParallelOldGC -XX:FreqInlineSize=2500 -XX:LoopUnrollLimit=45 -XX:InitialTenuringThreshold=12 -XX:-ThreadLocalHandshakes -XX:UseAVX=0 |
| JVM Affinity: | start /NODE [0,1,2,3] /AFFINTY 0x3,0xC,0x30,0xC0,0xC000,0x30000,0xC0000,0x30000000,0xC0000000 |
| JVM Instances: | 64 |
| JVM Initial Heap (MB): | 1625 |
| JVM Maximum Heap (MB): | 1625 |
| JVM Address Bits: | 64 |
| Boot Firmware Version: | R1.10.0 |
| Management Firmware Version: | 2.21S |
| Workload Version: | SSJ 1.2.10 |
| Director Location: | Controller |
| Other Software: | None |
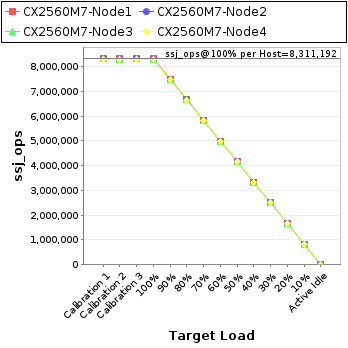
| Host | ssj_ops@100% |
|---|---|
| CX2560M7-Node1 | 8,331,639 |
| CX2560M7-Node2 | 8,305,550 |
| CX2560M7-Node3 | 8,306,194 |
| CX2560M7-Node4 | 8,301,383 |
| ssj_ops@100% | 33,244,766 |
| ssj_ops@100% per Host | 8,311,192 |
| ssj_ops@100% per JVM | 129,862 |
| Target Load | Actual Load | ssj_ops | |
|---|---|---|---|
| Target | Actual | ||
| Calibration 1 | 8,326,639 | ||
| Calibration 2 | 8,324,991 | ||
| Calibration 3 | 8,337,931 | ||
| ssj_ops@calibrated=8,331,461 | |||
| 100% | 100.0% | 8,331,461 | 8,331,639 |
| 90% | 90.0% | 7,498,315 | 7,497,424 |
| 80% | 80.1% | 6,665,169 | 6,672,633 |
| 70% | 69.9% | 5,832,023 | 5,825,897 |
| 60% | 60.0% | 4,998,877 | 4,995,370 |
| 50% | 50.1% | 4,165,731 | 4,170,124 |
| 40% | 40.0% | 3,332,584 | 3,329,609 |
| 30% | 30.0% | 2,499,438 | 2,502,189 |
| 20% | 20.0% | 1,666,292 | 1,667,593 |
| 10% | 10.0% | 833,146 | 832,716 |
| Active Idle | 0 | 0 | |

| Target Load | Actual Load | ssj_ops | |
|---|---|---|---|
| Target | Actual | ||
| Calibration 1 | 8,309,494 | ||
| Calibration 2 | 8,305,439 | ||
| Calibration 3 | 8,315,036 | ||
| ssj_ops@calibrated=8,310,238 | |||
| 100% | 99.9% | 8,310,238 | 8,305,550 |
| 90% | 90.1% | 7,479,214 | 7,485,060 |
| 80% | 80.1% | 6,648,190 | 6,654,290 |
| 70% | 69.9% | 5,817,167 | 5,810,714 |
| 60% | 60.1% | 4,986,143 | 4,992,708 |
| 50% | 50.0% | 4,155,119 | 4,157,504 |
| 40% | 40.0% | 3,324,095 | 3,321,201 |
| 30% | 30.0% | 2,493,071 | 2,493,415 |
| 20% | 20.0% | 1,662,048 | 1,665,889 |
| 10% | 10.0% | 831,024 | 830,391 |
| Active Idle | 0 | 0 | |

| Target Load | Actual Load | ssj_ops | |
|---|---|---|---|
| Target | Actual | ||
| Calibration 1 | 8,310,867 | ||
| Calibration 2 | 8,303,182 | ||
| Calibration 3 | 8,313,328 | ||
| ssj_ops@calibrated=8,308,255 | |||
| 100% | 100.0% | 8,308,255 | 8,306,194 |
| 90% | 89.9% | 7,477,430 | 7,472,940 |
| 80% | 80.1% | 6,646,604 | 6,655,045 |
| 70% | 70.1% | 5,815,779 | 5,823,578 |
| 60% | 60.1% | 4,984,953 | 4,990,093 |
| 50% | 50.0% | 4,154,128 | 4,150,976 |
| 40% | 40.0% | 3,323,302 | 3,324,464 |
| 30% | 30.0% | 2,492,477 | 2,493,009 |
| 20% | 20.0% | 1,661,651 | 1,660,849 |
| 10% | 10.0% | 830,826 | 831,465 |
| Active Idle | 0 | 0 | |

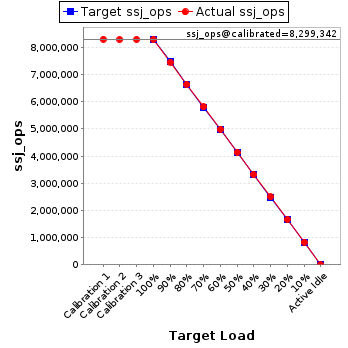
| Target Load | Actual Load | ssj_ops | |
|---|---|---|---|
| Target | Actual | ||
| Calibration 1 | 8,307,864 | ||
| Calibration 2 | 8,294,717 | ||
| Calibration 3 | 8,303,967 | ||
| ssj_ops@calibrated=8,299,342 | |||
| 100% | 100.0% | 8,299,342 | 8,301,383 |
| 90% | 89.9% | 7,469,408 | 7,464,490 |
| 80% | 80.1% | 6,639,474 | 6,647,924 |
| 70% | 70.0% | 5,809,539 | 5,813,603 |
| 60% | 60.2% | 4,979,605 | 4,994,922 |
| 50% | 50.0% | 4,149,671 | 4,147,523 |
| 40% | 40.0% | 3,319,737 | 3,318,032 |
| 30% | 30.1% | 2,489,803 | 2,496,427 |
| 20% | 20.1% | 1,659,868 | 1,665,444 |
| 10% | 10.0% | 829,934 | 827,881 |
| Active Idle | 0 | 0 | |