SPECpower_ssj2008
Copyright © 2007-2012 Standard Performance Evaluation Corporation
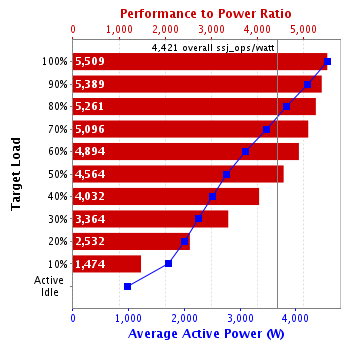
| Dell Inc. PowerEdge M915 (AMD Opteron 6380, 2.50 GHz) | SPECpower_ssj2008 = 4,421 overall ssj_ops/watt | ||||
| Test Sponsor: | Dell Inc. | SPEC License #: | 55 | Test Method: | Multi Node |
| Tested By: | Dell Inc. | Test Location: | Round Rock, TX, USA | Test Date: | Oct 18, 2012 |
| Hardware Availability: | Dec-2012 | Software Availability: | Jun-2012 | Publication: | Nov 14, 2012 |
| System Source: | Single Supplier | System Designation: | Server | Power Provisioning: | Line-powered |
| Performance | Power | Performance to Power Ratio | ||
|---|---|---|---|---|
| Target Load | Actual Load | ssj_ops | Average Active Power (W) | |
| 100% | 99.6% | 25,132,429 | 4,562 | 5,509 |
| 90% | 90.0% | 22,709,440 | 4,214 | 5,389 |
| 80% | 80.0% | 20,188,255 | 3,837 | 5,261 |
| 70% | 70.0% | 17,665,968 | 3,466 | 5,096 |
| 60% | 60.0% | 15,143,340 | 3,094 | 4,894 |
| 50% | 50.0% | 12,605,861 | 2,762 | 4,564 |
| 40% | 40.1% | 10,105,199 | 2,506 | 4,032 |
| 30% | 30.0% | 7,572,612 | 2,251 | 3,364 |
| 20% | 20.0% | 5,044,996 | 1,992 | 2,532 |
| 10% | 10.0% | 2,518,962 | 1,709 | 1,474 |
| Active Idle | 0 | 976 | 0 | |
| ∑ssj_ops / ∑power = | 4,421 | |||

| # of Nodes | # of Chips | # of Cores | # of Threads | Total RAM (GB) | # of OS Images | # of JVM Instances |
|---|---|---|---|---|---|---|
| 8 | 32 | 512 | 512 | 512 | 8 | 128 |
| Set Identifier: | sut |
| Set Description: | M915 |
| # of Identical Nodes: | 8 |
| Comment: | None |
| Hardware per Node | |
|---|---|
| Hardware Vendor: | Dell Inc. |
| Model: | PowerEdge M915 (AMD Opteron 6380, 2.50 GHz) |
| Form Factor: | Blade |
| CPU Name: | AMD Opteron 6380 (2.50 GHz) |
| CPU Characteristics: | 16 Core, 2.50 GHz, 16 MB L3 Cache |
| CPU Frequency (MHz): | 2500 |
| CPU(s) Enabled: | 64 cores, 4 chips, 16 cores/chip |
| Hardware Threads: | 64 (1 / core) |
| CPU(s) Orderable: | 2,4 chips |
| Primary Cache: | 512 KB I + 256 KB D on chip per chip |
| Secondary Cache: | 16 MB I+D on chip per chip, 2 MB shared / 2 cores |
| Tertiary Cache: | 16 MB I+D on chip per chip, 8MB shared / 8 cores |
| Other Cache: | None |
| Memory Amount (GB): | 64 |
| # and size of DIMM: | 16 x 4096 MB |
| Memory Details: | 4GB 2Rx8 PC3L-10600E ECC, Slots A1-A4, B1-B4, C1-C4, D1-D4 populated |
| Power Supply Quantity and Rating (W): | None |
| Power Supply Details: | Shared |
| Disk Drive: | 1 x 200 GB 2.5" SSD Dell P/N 6K55X |
| Disk Controller: | PERC H200 Modular |
| # and type of Network Interface Cards (NICs) Installed: | 2 x onboard Broadcom 5709 Dual Port 1GbE NIC Dell P/N: D17W2 |
| NICs Enabled in Firmware / OS / Connected: | 2/2/1 |
| Network Speed (Mbit): | 1000 |
| Keyboard: | None |
| Mouse: | None |
| Monitor: | None |
| Optical Drives: | No |
| Other Hardware: | None |
| Software per Node | |
|---|---|
| Power Management: | Balanced Mode in OS (See Notes) |
| Operating System (OS): | Microsoft Windows 2008 Server Enterprise x64 Edition |
| OS Version: | R2 SP1 |
| Filesystem: | NTFS |
| JVM Vendor: | IBM Corporation |
| JVM Version: | IBM J9 VM (build 2.6, JRE 1.7.0 Windows Server 2008 R2 amd64-64 20120322_106209 (JIT enabled, AOT enabled) |
| JVM Command-line Options: | -Xaggressive -Xcompressedrefs -Xmn1400m -Xms1875m -Xmx1875m -XlockReservation -Xnoloa -Xlp -Xconcurrentlevel0 -Xthr:minimizeusercpu -Xgcthreads2 |
| JVM Affinity: | start /affinity [F, F0, F00, F000, F0000, F00000, F000000, F0000000, F00000000, F000000000, F0000000000, F00000000000, F000000000000, F0000000000000, F00000000000000, F000000000000000] |
| JVM Instances: | 16 |
| JVM Initial Heap (MB): | 1875 |
| JVM Maximum Heap (MB): | 1875 |
| JVM Address Bits: | 64 |
| Boot Firmware Version: | 3.0.3 |
| Management Firmware Version: | iDRAC 3.45 build 1 |
| Workload Version: | SSJ 1.2.10 |
| Director Location: | Controller |
| Other Software: | IBM SDK Java Technology Edition Version 7.0 for Windows x64 |
| Hardware | |
|---|---|
| Hardware Vendor: | Dell Inc. |
| Model: | R410 |
| CPU Description: | Xeon 5620 |
| Memory amount (GB): | 64 |
| Software | |
|---|---|
| Operating System (OS): | Microsoft Windows Server 2008 Enterprise R2 SP1 |
| JVM Vendor: | IBM Corporation |
| JVM Version: | IBM J9 VM (build 2.6, JRE 1.7.0 Windows Server 2008 R2 amd64-64 20120322_106209 (JIT enabled, AOT enabled) |
| CCS Version: | 1.2.6 |
| Power Analyzer pwr1 | |
|---|---|
| Hardware Vendor: | Yokogawa Meters and Instruments Corporation |
| Model: | WT210 |
| Serial Number: | 91H723624 |
| Connectivity: | RS-232 |
| Input Connection: | Default |
| Metrology Institute: | NIST |
| Accredited by: | Simco Electronics |
| Calibration Label: | 5497366 |
| Date of Calibration: | 17-Jan-2012 |
| PTDaemon Host System: | same as CCS |
| PTDaemon Host OS: | same as CCS |
| PTDaemon Version: | 1.4.2-bc965ca0-20120417 |
| Setup Description: | Connected to SUT power supply 1 and 2 |
| Power Analyzer pwr3 | |
|---|---|
| Hardware Vendor: | Yokogawa Meters and Instruments Corporation |
| Model: | WT210 |
| Serial Number: | 91KA21980 |
| Connectivity: | RS-232 |
| Input Connection: | Default |
| Metrology Institute: | NIST |
| Accredited by: | Simco Electronics |
| Calibration Label: | 5801064 |
| Date of Calibration: | 14-Sep-2012 |
| PTDaemon Host System: | same as CCS |
| PTDaemon Host OS: | same as CCS |
| PTDaemon Version: | 1.4.2-bc965ca0-20120417 |
| Setup Description: | Connected to SUT power supply 3 |
| Temperature Sensor temp1 | |
|---|---|
| Hardware Vendor: | Digi International Inc. |
| Model: | Watchport/H |
| Driver Version: | Watchport Virtual Port 5.30.2.0 |
| Connectivity: | USB |
| PTDaemon Host System: | same as CCS |
| PTDaemon Host OS: | same as CCS |
| Setup Description: | 50 mm in front of SUT main airflow intake |
| Target Load | Average Active Power (W) | Minimum Ambient Temperature (°C) |
|---|---|---|
| 100% | 4,562 | 21.8 |
| 90% | 4,214 | 21.8 |
| 80% | 3,837 | 21.8 |
| 70% | 3,466 | 21.9 |
| 60% | 3,094 | 22.0 |
| 50% | 2,762 | 22.1 |
| 40% | 2,506 | 22.2 |
| 30% | 2,251 | 22.2 |
| 20% | 1,992 | 22.2 |
| 10% | 1,709 | 22.1 |
| Active Idle | 976 | 22.1 |
| Line Standard | Minimum Temperature (°C) | Elevation (m) |
|---|---|---|
| 208V / 60 Hz / 1 phase / 2 wires | 21.8 | 255 |
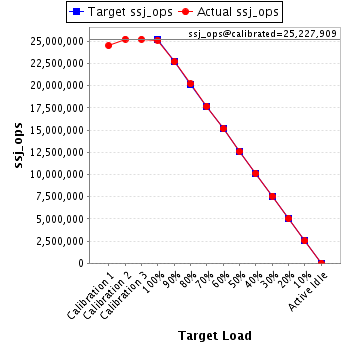
| Target Load | Actual Load | ssj_ops | |
|---|---|---|---|
| Target | Actual | ||
| Calibration 1 | 24,514,156 | ||
| Calibration 2 | 25,234,815 | ||
| Calibration 3 | 25,221,003 | ||
| ssj_ops@calibrated=25,227,909 | |||
| 100% | 99.6% | 25,227,909 | 25,132,429 |
| 90% | 90.0% | 22,705,118 | 22,709,440 |
| 80% | 80.0% | 20,182,327 | 20,188,255 |
| 70% | 70.0% | 17,659,536 | 17,665,968 |
| 60% | 60.0% | 15,136,745 | 15,143,340 |
| 50% | 50.0% | 12,613,955 | 12,605,861 |
| 40% | 40.1% | 10,091,164 | 10,105,199 |
| 30% | 30.0% | 7,568,373 | 7,572,612 |
| 20% | 20.0% | 5,045,582 | 5,044,996 |
| 10% | 10.0% | 2,522,791 | 2,518,962 |
| Active Idle | 0 | 0 | |
