
SPECpower_ssj2008
Aggregate Performance Report
Copyright © 2007-2019 Standard Performance Evaluation Corporation
| New H3C Technologies Co., Ltd. H3C UniServer B5700 G3 | ssj_ops@100% = 62,581,687 ssj_ops@100% per Host = 5,689,244 ssj_ops@100% per JVM = 1,422,311 |
||||
| Test Sponsor: | New H3C Technologies Co., Ltd. | SPEC License #: | 9066 | Test Method: | Multi Node |
| Tested By: | New H3C Technologies Co., Ltd. | Test Location: | Hangzhou, Zhejiang, China | Test Date: | May 14, 2019 |
| Hardware Availability: | Jan-2019 | Software Availability: | Jan-2019 | Publication: | Jun 12, 2019 |
| System Source: | Single Supplier | System Designation: | Server | Power Provisioning: | Line-powered |
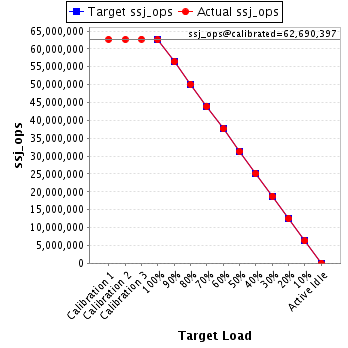
| Target Load | Actual Load | ssj_ops | |
|---|---|---|---|
| Target | Actual | ||
| Calibration 1 | 62,687,902 | ||
| Calibration 2 | 62,641,714 | ||
| Calibration 3 | 62,739,080 | ||
| ssj_ops@calibrated=62,690,397 | |||
| 100% | 99.8% | 62,690,397 | 62,581,687 |
| 90% | 90.0% | 56,421,358 | 56,435,273 |
| 80% | 80.0% | 50,152,318 | 50,124,193 |
| 70% | 70.0% | 43,883,278 | 43,882,331 |
| 60% | 60.0% | 37,614,238 | 37,617,746 |
| 50% | 50.0% | 31,345,199 | 31,341,892 |
| 40% | 40.0% | 25,076,159 | 25,078,191 |
| 30% | 30.0% | 18,807,119 | 18,795,876 |
| 20% | 20.0% | 12,538,079 | 12,542,873 |
| 10% | 10.0% | 6,269,040 | 6,262,364 |
| Active Idle | 0 | 0 | |
| # of Nodes | # of Chips | # of Cores | # of Threads | Total RAM (GB) | # of OS Images | # of JVM Instances |
|---|---|---|---|---|---|---|
| 11 | 22 | 616 | 1,232 | 2,112 | 11 | 44 |
| Set Identifier: | sut |
| Set Description: | System Under Test |
| # of Identical Nodes: | 11 |
| Comment: | SUT |
| Hardware per Node | |
|---|---|
| Hardware Vendor: | New H3C Technologies Co., Ltd. |
| Model: | H3C UniServer B5700 G3 |
| Form Factor: | Other |
| CPU Name: | Intel Xeon Platinum 8180 2.50GHz |
| CPU Characteristics: | 28-Core, 2.50 GHz, 38.5 MB L3 Cache |
| CPU Frequency (MHz): | 2500 |
| CPU(s) Enabled: | 56 cores, 2 chips, 28 cores/chip |
| Hardware Threads: | 112 (2 / core) |
| CPU(s) Orderable: | 1,2 chips |
| Primary Cache: | 32 KB I + 32 KB D on chip per core |
| Secondary Cache: | 1 MB I+D on chip per core |
| Tertiary Cache: | 39424 KB I+D on chip per chip |
| Other Cache: | None |
| Memory Amount (GB): | 192.0 |
| # and size of DIMM: | 12 x 16384 MB |
| Memory Details: | 12 x 16GB 2Rx8 PC4-2666-V ECC;slots A1, A2, A3, A4, A5, A6, B1, B2, B3, B4, B5, B6 populated |
| Power Supply Quantity and Rating (W): | None |
| Power Supply Details: | Shared |
| Disk Drive: | SATA DOM 128GB P/N DESSH-A28D09BCADCA |
| Disk Controller: | Integrated SATA controller |
| # and type of Network Interface Cards (NICs) Installed: | 1 x Intel I350 Gigabit Ethernet Controller |
| NICs Enabled in Firmware / OS / Connected: | 2/2/1 |
| Network Speed (Mbit): | 1000 |
| Keyboard: | None |
| Mouse: | None |
| Monitor: | None |
| Optical Drives: | No |
| Other Hardware: | None |
| Software per Node | |
|---|---|
| Power Management: | Balanced Mode enabled in OS (see SUT Notes) |
| Operating System (OS): | Microsoft Windows Server 2012 R2 Datacenter |
| OS Version: | Version 6.3 (Build 9600) |
| Filesystem: | NTFS |
| JVM Vendor: | Oracle Corporation |
| JVM Version: | Java HotSpot(TM) 64-Bit Server VM (build 24.80-b11, mixed mode), version 1.7.0_80 |
| JVM Command-line Options: | -server -Xmn19g -Xms21g -Xmx21g -XX:SurvivorRatio=1 -XX:TargetSurvivorRatio=99 -XX:ParallelGCThreads=28 -XX:AllocatePrefetchDistance=256 -XX:AllocatePrefetchLines=4 -XX:LoopUnrollLimit=45 -XX:InitialTenuringThreshold=12 -XX:MaxTenuringThreshold=15 -XX:InlineSmallCode=9000 -XX:MaxInlineSize=270 -XX:FreqInlineSize=6000 -XX:+UseLargePages -XX:+UseParallelOldGC -XX:+AggressiveOpts |
| JVM Affinity: | start /NODE [0,2] /AFFINITY [0xFC0FF00FC0FF];start /NODE [1,3] /AFFINITY [0xFF03F00FF03F] |
| JVM Instances: | 4 |
| JVM Initial Heap (MB): | 21000 |
| JVM Maximum Heap (MB): | 21000 |
| JVM Address Bits: | 64 |
| Boot Firmware Version: | 2.00.25 |
| Management Firmware Version: | UIS-OM 1.00.10 |
| Workload Version: | SSJ 1.2.10 |
| Director Location: | Controller |
| Other Software: | Microsoft Windows KB3021910, clearcompressionflag.exe, KB2919355, KB2932046, KB2959977, KB2937592, KB2938439, KB2934018, KB4056898, patched to this test system in May 7,2019 |
| Host | ssj_ops@100% |
|---|---|
| WIN-SUT101 | 5,688,424 |
| WIN-SUT102 | 5,681,309 |
| WIN-SUT103 | 5,715,751 |
| WIN-SUT104 | 5,685,582 |
| WIN-SUT105 | 5,686,793 |
| WIN-SUT106 | 5,674,076 |
| WIN-SUT107 | 5,695,506 |
| WIN-SUT108 | 5,684,016 |
| WIN-SUT109 | 5,697,166 |
| WIN-SUT110 | 5,681,740 |
| WIN-SUT111 | 5,691,324 |
| ssj_ops@100% | 62,581,687 |
| ssj_ops@100% per Host | 5,689,244 |
| ssj_ops@100% per JVM | 1,422,311 |
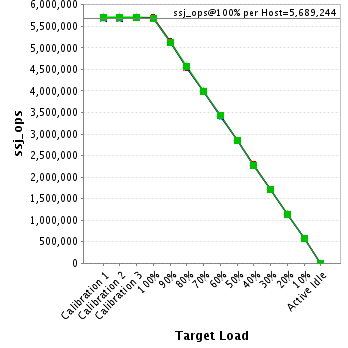
| Target Load | Actual Load | ssj_ops | |
|---|---|---|---|
| Target | Actual | ||
| Calibration 1 | 5,693,070 | ||
| Calibration 2 | 5,687,679 | ||
| Calibration 3 | 5,703,487 | ||
| ssj_ops@calibrated=5,695,583 | |||
| 100% | 99.9% | 5,695,583 | 5,688,424 |
| 90% | 90.2% | 5,126,025 | 5,135,140 |
| 80% | 80.1% | 4,556,466 | 4,563,562 |
| 70% | 69.9% | 3,986,908 | 3,983,959 |
| 60% | 60.1% | 3,417,350 | 3,420,857 |
| 50% | 50.0% | 2,847,792 | 2,849,579 |
| 40% | 40.0% | 2,278,233 | 2,276,629 |
| 30% | 30.0% | 1,708,675 | 1,706,740 |
| 20% | 20.0% | 1,139,117 | 1,139,191 |
| 10% | 10.0% | 569,558 | 568,441 |
| Active Idle | 0 | 0 | |

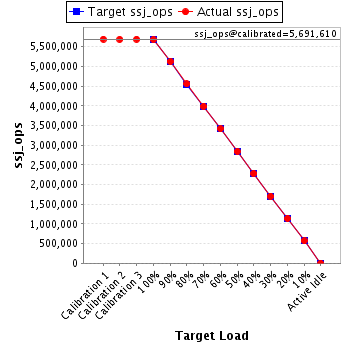
| Target Load | Actual Load | ssj_ops | |
|---|---|---|---|
| Target | Actual | ||
| Calibration 1 | 5,693,258 | ||
| Calibration 2 | 5,689,655 | ||
| Calibration 3 | 5,693,564 | ||
| ssj_ops@calibrated=5,691,610 | |||
| 100% | 99.8% | 5,691,610 | 5,681,309 |
| 90% | 90.1% | 5,122,449 | 5,126,963 |
| 80% | 80.1% | 4,553,288 | 4,557,277 |
| 70% | 70.1% | 3,984,127 | 3,991,612 |
| 60% | 60.0% | 3,414,966 | 3,415,230 |
| 50% | 50.0% | 2,845,805 | 2,843,339 |
| 40% | 40.0% | 2,276,644 | 2,276,856 |
| 30% | 30.0% | 1,707,483 | 1,705,629 |
| 20% | 20.0% | 1,138,322 | 1,138,770 |
| 10% | 10.0% | 569,161 | 570,208 |
| Active Idle | 0 | 0 | |
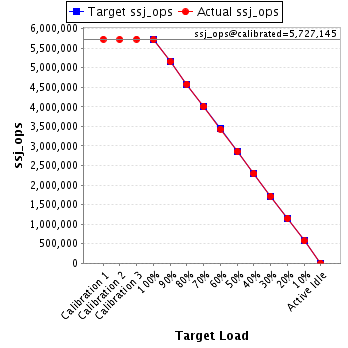
| Target Load | Actual Load | ssj_ops | |
|---|---|---|---|
| Target | Actual | ||
| Calibration 1 | 5,730,491 | ||
| Calibration 2 | 5,723,039 | ||
| Calibration 3 | 5,731,251 | ||
| ssj_ops@calibrated=5,727,145 | |||
| 100% | 99.8% | 5,727,145 | 5,715,751 |
| 90% | 90.0% | 5,154,431 | 5,155,637 |
| 80% | 80.0% | 4,581,716 | 4,579,622 |
| 70% | 70.0% | 4,009,002 | 4,011,388 |
| 60% | 59.9% | 3,436,287 | 3,433,063 |
| 50% | 49.9% | 2,863,573 | 2,858,581 |
| 40% | 40.0% | 2,290,858 | 2,289,420 |
| 30% | 30.0% | 1,718,144 | 1,718,494 |
| 20% | 20.0% | 1,145,429 | 1,147,881 |
| 10% | 10.0% | 572,715 | 573,815 |
| Active Idle | 0 | 0 | |
| Target Load | Actual Load | ssj_ops | |
|---|---|---|---|
| Target | Actual | ||
| Calibration 1 | 5,697,682 | ||
| Calibration 2 | 5,686,889 | ||
| Calibration 3 | 5,699,306 | ||
| ssj_ops@calibrated=5,693,097 | |||
| 100% | 99.9% | 5,693,097 | 5,685,582 |
| 90% | 90.1% | 5,123,788 | 5,131,507 |
| 80% | 80.0% | 4,554,478 | 4,552,289 |
| 70% | 70.1% | 3,985,168 | 3,988,830 |
| 60% | 60.1% | 3,415,858 | 3,423,099 |
| 50% | 50.0% | 2,846,549 | 2,845,834 |
| 40% | 40.0% | 2,277,239 | 2,276,904 |
| 30% | 29.9% | 1,707,929 | 1,703,604 |
| 20% | 20.1% | 1,138,619 | 1,142,467 |
| 10% | 10.0% | 569,310 | 568,429 |
| Active Idle | 0 | 0 | |

| Target Load | Actual Load | ssj_ops | |
|---|---|---|---|
| Target | Actual | ||
| Calibration 1 | 5,694,161 | ||
| Calibration 2 | 5,694,209 | ||
| Calibration 3 | 5,701,480 | ||
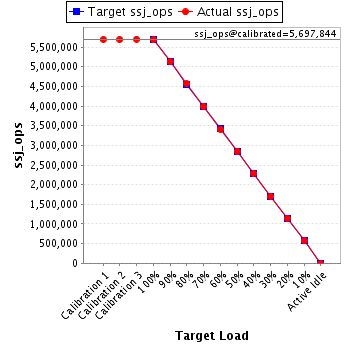
| ssj_ops@calibrated=5,697,844 | |||
| 100% | 99.8% | 5,697,844 | 5,686,793 |
| 90% | 90.0% | 5,128,060 | 5,127,236 |
| 80% | 80.1% | 4,558,275 | 4,562,738 |
| 70% | 70.1% | 3,988,491 | 3,991,468 |
| 60% | 59.9% | 3,418,707 | 3,415,300 |
| 50% | 50.0% | 2,848,922 | 2,851,235 |
| 40% | 40.0% | 2,279,138 | 2,277,095 |
| 30% | 29.9% | 1,709,353 | 1,705,666 |
| 20% | 20.0% | 1,139,569 | 1,142,140 |
| 10% | 10.0% | 569,784 | 568,611 |
| Active Idle | 0 | 0 | |
| Target Load | Actual Load | ssj_ops | |
|---|---|---|---|
| Target | Actual | ||
| Calibration 1 | 5,687,992 | ||
| Calibration 2 | 5,681,651 | ||
| Calibration 3 | 5,693,281 | ||
| ssj_ops@calibrated=5,687,466 | |||
| 100% | 99.8% | 5,687,466 | 5,674,076 |
| 90% | 90.0% | 5,118,719 | 5,117,732 |
| 80% | 80.0% | 4,549,973 | 4,550,231 |
| 70% | 69.9% | 3,981,226 | 3,976,610 |
| 60% | 60.0% | 3,412,480 | 3,409,669 |
| 50% | 49.9% | 2,843,733 | 2,839,435 |
| 40% | 40.0% | 2,274,986 | 2,276,249 |
| 30% | 30.0% | 1,706,240 | 1,708,354 |
| 20% | 20.0% | 1,137,493 | 1,137,482 |
| 10% | 10.0% | 568,747 | 566,245 |
| Active Idle | 0 | 0 | |

| Target Load | Actual Load | ssj_ops | |
|---|---|---|---|
| Target | Actual | ||
| Calibration 1 | 5,701,208 | ||
| Calibration 2 | 5,702,610 | ||
| Calibration 3 | 5,706,094 | ||
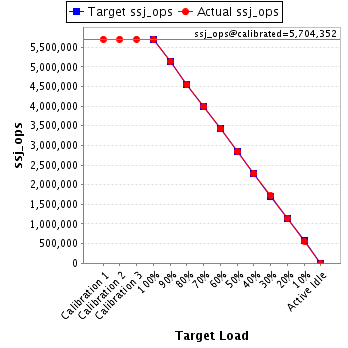
| ssj_ops@calibrated=5,704,352 | |||
| 100% | 99.8% | 5,704,352 | 5,695,506 |
| 90% | 90.0% | 5,133,917 | 5,135,420 |
| 80% | 79.7% | 4,563,481 | 4,548,485 |
| 70% | 70.1% | 3,993,046 | 3,999,607 |
| 60% | 60.0% | 3,422,611 | 3,420,942 |
| 50% | 49.9% | 2,852,176 | 2,849,284 |
| 40% | 40.1% | 2,281,741 | 2,286,425 |
| 30% | 30.0% | 1,711,306 | 1,713,219 |
| 20% | 19.9% | 1,140,870 | 1,137,015 |
| 10% | 9.9% | 570,435 | 566,452 |
| Active Idle | 0 | 0 | |
| Target Load | Actual Load | ssj_ops | |
|---|---|---|---|
| Target | Actual | ||
| Calibration 1 | 5,691,120 | ||
| Calibration 2 | 5,688,633 | ||
| Calibration 3 | 5,700,523 | ||
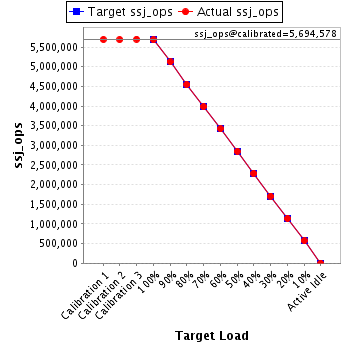
| ssj_ops@calibrated=5,694,578 | |||
| 100% | 99.8% | 5,694,578 | 5,684,016 |
| 90% | 89.9% | 5,125,120 | 5,122,272 |
| 80% | 79.9% | 4,555,662 | 4,547,930 |
| 70% | 69.9% | 3,986,205 | 3,983,177 |
| 60% | 60.0% | 3,416,747 | 3,419,180 |
| 50% | 50.1% | 2,847,289 | 2,850,831 |
| 40% | 40.1% | 2,277,831 | 2,282,818 |
| 30% | 30.0% | 1,708,373 | 1,709,828 |
| 20% | 20.0% | 1,138,916 | 1,137,782 |
| 10% | 10.0% | 569,458 | 571,897 |
| Active Idle | 0 | 0 | |
| Target Load | Actual Load | ssj_ops | |
|---|---|---|---|
| Target | Actual | ||
| Calibration 1 | 5,708,707 | ||
| Calibration 2 | 5,703,882 | ||
| Calibration 3 | 5,713,646 | ||
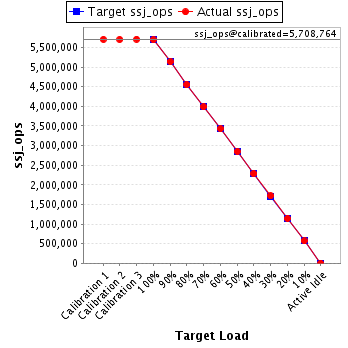
| ssj_ops@calibrated=5,708,764 | |||
| 100% | 99.8% | 5,708,764 | 5,697,166 |
| 90% | 90.0% | 5,137,888 | 5,138,810 |
| 80% | 79.8% | 4,567,012 | 4,554,512 |
| 70% | 69.9% | 3,996,135 | 3,987,953 |
| 60% | 60.0% | 3,425,259 | 3,427,134 |
| 50% | 49.9% | 2,854,382 | 2,850,153 |
| 40% | 40.0% | 2,283,506 | 2,281,121 |
| 30% | 30.0% | 1,712,629 | 1,715,005 |
| 20% | 20.0% | 1,141,753 | 1,141,614 |
| 10% | 10.0% | 570,876 | 568,431 |
| Active Idle | 0 | 0 | |
| Target Load | Actual Load | ssj_ops | |
|---|---|---|---|
| Target | Actual | ||
| Calibration 1 | 5,691,237 | ||
| Calibration 2 | 5,685,414 | ||
| Calibration 3 | 5,695,080 | ||
| ssj_ops@calibrated=5,690,247 | |||
| 100% | 99.9% | 5,690,247 | 5,681,740 |
| 90% | 89.9% | 5,121,223 | 5,116,274 |
| 80% | 79.9% | 4,552,198 | 4,549,329 |
| 70% | 69.9% | 3,983,173 | 3,976,593 |
| 60% | 60.0% | 3,414,148 | 3,413,445 |
| 50% | 50.1% | 2,845,124 | 2,848,541 |
| 40% | 40.0% | 2,276,099 | 2,275,212 |
| 30% | 30.0% | 1,707,074 | 1,705,443 |
| 20% | 20.0% | 1,138,049 | 1,138,273 |
| 10% | 10.0% | 569,025 | 568,106 |
| Active Idle | 0 | 0 | |

| Target Load | Actual Load | ssj_ops | |
|---|---|---|---|
| Target | Actual | ||
| Calibration 1 | 5,698,975 | ||
| Calibration 2 | 5,698,054 | ||
| Calibration 3 | 5,701,368 | ||
| ssj_ops@calibrated=5,699,711 | |||
| 100% | 99.9% | 5,699,711 | 5,691,324 |
| 90% | 90.0% | 5,129,739 | 5,128,283 |
| 80% | 80.0% | 4,559,768 | 4,558,218 |
| 70% | 70.0% | 3,989,797 | 3,991,134 |
| 60% | 60.0% | 3,419,826 | 3,419,827 |
| 50% | 50.1% | 2,849,855 | 2,855,080 |
| 40% | 40.0% | 2,279,884 | 2,279,461 |
| 30% | 29.9% | 1,709,913 | 1,703,894 |
| 20% | 20.0% | 1,139,942 | 1,140,258 |
| 10% | 10.0% | 569,971 | 571,730 |
| Active Idle | 0 | 0 | |
