SPECpower_ssj2008
Aggregate Performance Report
Copyright © 2007-2019 Standard Performance Evaluation Corporation
| Hewlett Packard Enterprise Synergy 660 Gen10 Compute Module | ssj_ops@100% = 22,907,794 ssj_ops@100% per Host = 11,453,897 ssj_ops@100% per JVM = 1,431,737 |
||||
| Test Sponsor: | Hewlett Packard Enterprise | SPEC License #: | 3 | Test Method: | Multi Node |
| Tested By: | Hewlett Packard Enterprise | Test Location: | Houston, TX, USA | Test Date: | Mar 10, 2019 |
| Hardware Availability: | Apr-2019 | Software Availability: | Mar-2019 | Publication: | Apr 2, 2019 |
| System Source: | Single Supplier | System Designation: | Server | Power Provisioning: | Line-powered |
| Target Load | Actual Load | ssj_ops | |
|---|---|---|---|
| Target | Actual | ||
| Calibration 1 | 22,997,359 | ||
| Calibration 2 | 22,959,208 | ||
| Calibration 3 | 22,969,945 | ||
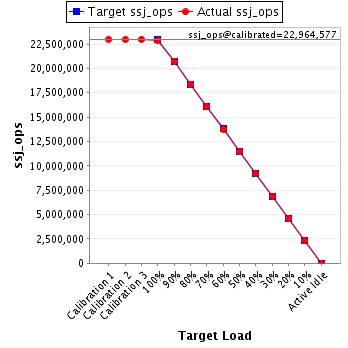
| ssj_ops@calibrated=22,964,577 | |||
| 100% | 99.8% | 22,964,577 | 22,907,794 |
| 90% | 90.0% | 20,668,119 | 20,672,864 |
| 80% | 80.0% | 18,371,661 | 18,379,649 |
| 70% | 70.0% | 16,075,204 | 16,067,080 |
| 60% | 60.0% | 13,778,746 | 13,775,689 |
| 50% | 50.0% | 11,482,288 | 11,491,179 |
| 40% | 40.0% | 9,185,831 | 9,187,369 |
| 30% | 30.0% | 6,889,373 | 6,894,344 |
| 20% | 20.0% | 4,592,915 | 4,602,118 |
| 10% | 10.0% | 2,296,458 | 2,292,141 |
| Active Idle | 0 | 0 | |
| # of Nodes | # of Chips | # of Cores | # of Threads | Total RAM (GB) | # of OS Images | # of JVM Instances |
|---|---|---|---|---|---|---|
| 2 | 8 | 224 | 448 | 768 | 2 | 16 |
| Set Identifier: | SUT |
| Set Description: | System Under Test |
| # of Identical Nodes: | 2 |
| Comment: | SUT |
| Hardware per Node | |
|---|---|
| Hardware Vendor: | Hewlett Packard Enterprise |
| Model: | Synergy 660 Gen10 Compute Module |
| Form Factor: | blade |
| CPU Name: | Intel Xeon Platinum 8280 @ 2.70GHz (Intel Turbo Boost Technology up to 4.00 GHz) |
| CPU Characteristics: | 28-Core, 2.70 GHz, 38.5MB L3 Cache |
| CPU Frequency (MHz): | 2700 |
| CPU(s) Enabled: | 112 cores, 4 chips, 28 cores/chip |
| Hardware Threads: | 224 (2 / core) |
| CPU(s) Orderable: | 1,2,3,4 chips |
| Primary Cache: | 32 KB I + 32 KB D on chip per core |
| Secondary Cache: | 1 MB I+D on chip per core |
| Tertiary Cache: | 39424 KB I+D on chip per chip |
| Other Cache: | None |
| Memory Amount (GB): | 384 |
| # and size of DIMM: | 24 x 16384 MB |
| Memory Details: | 24 x 16GB 2Rx8 PC4-2933Y-R; slots 1, 3, 5, 8, 10 and 12 populated on each socket |
| Power Supply Quantity and Rating (W): | None |
| Power Supply Details: | N/A |
| Disk Drive: | 1 x HPE 480GB SATA 6G M.2 2280 (875498-B21) |
| Disk Controller: | HPE Smart Array S100i SR Gen10 |
| # and type of Network Interface Cards (NICs) Installed: | 1 x HPE Synergy 3820C 10/20Gb CNA |
| NICs Enabled in Firmware / OS / Connected: | 2/2/1 |
| Network Speed (Mbit): | 1000 |
| Keyboard: | None |
| Mouse: | None |
| Monitor: | None |
| Optical Drives: | No |
| Other Hardware: | None |
| Software per Node | |
|---|---|
| Power Management: | Enabled (see SUT Notes) |
| Operating System (OS): | Windows Server 2012 R2 Datacenter |
| OS Version: | Version 6.3 (Build 9600) |
| Filesystem: | NTFS |
| JVM Vendor: | Oracle Corporation |
| JVM Version: | Oracle Java HotSpot(TM) 64-Bit Server VM (build 24.80-b11, mixed mode), version 1.7.0_80 |
| JVM Command-line Options: | -server -Xmn19000m -Xms21000m -Xmx21000m -XX:SurvivorRatio=1 -XX:TargetSurvivorRatio=99 -XX:AllocatePrefetchDistance=256 -XX:AllocatePrefetchLines=4 -XX:LoopUnrollLimit=45 -XX:InitialTenuringThreshold=12 -XX:MaxTenuringThreshold=15 -XX:ParallelGCThreads=28 -XX:InlineSmallCode=3900 -XX:MaxInlineSize=270 -XX:FreqInlineSize=2500 -XX:+AggressiveOpts -XX:+UseLargePages -XX:+UseParallelOldGC |
| JVM Affinity: | start /NODE [0,1,2,3] /AFFINITY [0xFFFFFFF] |
| JVM Instances: | 8 |
| JVM Initial Heap (MB): | 21000 |
| JVM Maximum Heap (MB): | 21000 |
| JVM Address Bits: | 64 |
| Boot Firmware Version: | I43 v2.10 (01/18/2019) |
| Management Firmware Version: | 1.40 Feb 05 2019 |
| Workload Version: | SSJ 1.2.10 |
| Director Location: | Controller |
| Other Software: | HPE Service Pack for ProLiant (SPP) - Version 2019.03.0 (Mar 2019), Microsoft Windows KB4054519, and KB4056898 |
| Host | ssj_ops@100% |
|---|---|
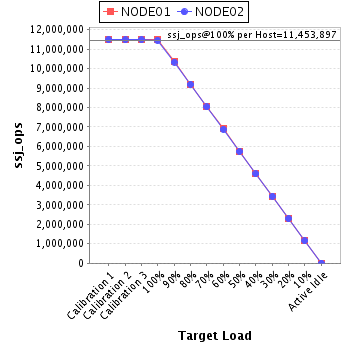
| NODE01 | 11,465,110 |
| NODE02 | 11,442,684 |
| ssj_ops@100% | 22,907,794 |
| ssj_ops@100% per Host | 11,453,897 |
| ssj_ops@100% per JVM | 1,431,737 |
| Target Load | Actual Load | ssj_ops | |
|---|---|---|---|
| Target | Actual | ||
| Calibration 1 | 11,507,711 | ||
| Calibration 2 | 11,489,577 | ||
| Calibration 3 | 11,489,013 | ||
| ssj_ops@calibrated=11,489,295 | |||
| 100% | 99.8% | 11,489,295 | 11,465,110 |
| 90% | 90.0% | 10,340,366 | 10,339,138 |
| 80% | 80.0% | 9,191,436 | 9,192,664 |
| 70% | 70.0% | 8,042,507 | 8,039,687 |
| 60% | 60.0% | 6,893,577 | 6,897,257 |
| 50% | 50.0% | 5,744,648 | 5,748,520 |
| 40% | 40.0% | 4,595,718 | 4,596,618 |
| 30% | 30.0% | 3,446,789 | 3,451,494 |
| 20% | 20.1% | 2,297,859 | 2,313,627 |
| 10% | 10.0% | 1,148,930 | 1,143,490 |
| Active Idle | 0 | 0 | |

| Target Load | Actual Load | ssj_ops | |
|---|---|---|---|
| Target | Actual | ||
| Calibration 1 | 11,489,647 | ||
| Calibration 2 | 11,469,631 | ||
| Calibration 3 | 11,480,932 | ||
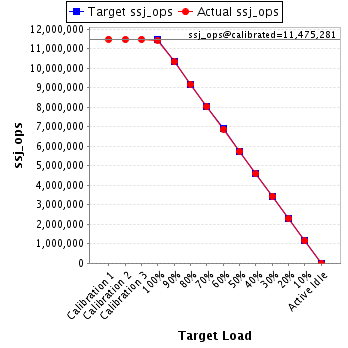
| ssj_ops@calibrated=11,475,281 | |||
| 100% | 99.7% | 11,475,281 | 11,442,684 |
| 90% | 90.1% | 10,327,753 | 10,333,726 |
| 80% | 80.1% | 9,180,225 | 9,186,984 |
| 70% | 70.0% | 8,032,697 | 8,027,392 |
| 60% | 59.9% | 6,885,169 | 6,878,433 |
| 50% | 50.0% | 5,737,641 | 5,742,659 |
| 40% | 40.0% | 4,590,113 | 4,590,752 |
| 30% | 30.0% | 3,442,584 | 3,442,851 |
| 20% | 19.9% | 2,295,056 | 2,288,490 |
| 10% | 10.0% | 1,147,528 | 1,148,651 |
| Active Idle | 0 | 0 | |