SPECpower_ssj2008
Aggregate Performance Report
Copyright © 2007-2010 Standard Performance Evaluation Corporation
| Hewlett-Packard Company ProLiant DL170h G6 (2.4 GHz, Intel Xeon L5530) | ssj_ops@100% = 2,116,272 ssj_ops@100% per Host = 529,068 ssj_ops@100% per JVM = 132,267 |
||||
| Test Sponsor: | Hewlett-Packard Company | SPEC License #: | 3 | Test Method: | Multi Node |
| Tested By: | Hewlett-Packard Company | Test Location: | Houston, TX, USA | Test Date: | Nov 18, 2009 |
| Hardware Availability: | Oct-2009 | Software Availability: | Jul-2009 | Publication: | Jan 13, 2010 |
| System Source: | Single Supplier | System Designation: | Server | Power Provisioning: | Line-powered |
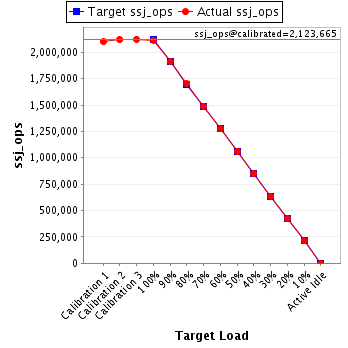
| Target Load | Actual Load | ssj_ops | |
|---|---|---|---|
| Target | Actual | ||
| Calibration 1 | 2,101,167 | ||
| Calibration 2 | 2,122,288 | ||
| Calibration 3 | 2,125,041 | ||
| ssj_ops@calibrated=2,123,665 | |||
| 100% | 99.7% | 2,123,665 | 2,116,272 |
| 90% | 90.0% | 1,911,298 | 1,910,597 |
| 80% | 80.2% | 1,698,932 | 1,704,173 |
| 70% | 70.1% | 1,486,565 | 1,488,876 |
| 60% | 60.0% | 1,274,199 | 1,274,458 |
| 50% | 49.9% | 1,061,832 | 1,060,658 |
| 40% | 40.0% | 849,466 | 849,322 |
| 30% | 30.0% | 637,099 | 637,687 |
| 20% | 19.9% | 424,733 | 422,932 |
| 10% | 9.9% | 212,366 | 211,240 |
| Active Idle | 0 | 0 | |
| # of Nodes | # of Chips | # of Cores | # of Threads | Total RAM (GB) | # of OS Images | # of JVM Instances |
|---|---|---|---|---|---|---|
| 4 | 8 | 32 | 64 | 32.0 | 4 | 16 |
| Set Identifier: | sut |
| Set Description: | ProLiant DL4x170h G6 |
| # of Identical Nodes: | 4 |
| Comment: | None |
| Hardware per Node | |
|---|---|
| Hardware Vendor: | Hewlett-Packard Company |
| Model: | ProLiant DL170h G6 (2.4 GHz, Intel Xeon L5530) |
| Form Factor: | 1U |
| CPU Name: | Intel Xeon L5530 |
| CPU Characteristics: | Quad-Core, 2.40 GHz, 8 MB L3 cache |
| CPU Frequency (MHz): | 2400 |
| CPU(s) Enabled: | 8 cores, 2 chips, 4 cores/chip |
| Hardware Threads: | 16 (2 / core) |
| CPU(s) Orderable: | 1,2 chips |
| Primary Cache: | 32 KB I + 32 KB D on chip per core |
| Secondary Cache: | 256 MB I+D on chip per core |
| Tertiary Cache: | 8 MB I+D on chip per chip |
| Other Cache: | None |
| Memory Amount (GB): | 8 |
| # and size of DIMM: | 4 x 2048 MB |
| Memory Details: | 2GB 2Rx4 PC3-10600E; slots 1 and 4 are populated on each processor |
| Power Supply Quantity and Rating (W): | None |
| Power Supply Details: | Shared |
| Disk Drive: | 1 x 60GB SSD 3.5" SATA, HP part #:570761-B21 |
| Disk Controller: | Integrated SATA |
| # and type of Network Interface Cards (NICs) Installed: | 2 x HP NC362i Dual Port Multifunction Gigabit Server Adapters |
| NICs Enabled in Firmware / OS / Connected: | 2/2/1 |
| Network Speed (Mbit): | 1000 |
| Keyboard: | None |
| Mouse: | None |
| Monitor: | None |
| Optical Drives: | No |
| Other Hardware: | None |
| Software per Node | |
|---|---|
| Power Management: | Power saver plan in OS |
| Operating System (OS): | Windows Server 2008 x64, Enterprise Edition |
| OS Version: | R2 |
| Filesystem: | NTFS |
| JVM Vendor: | IBM Corporation |
| JVM Version: | IBM J9 VM (build 2.4, J2RE 1.6.0 IBM J9 2.4 Windows Server 2008 amd64-64 jvmwa6460sr5-20090519_35743 (JIT enabled, AOT enabled) |
| JVM Command-line Options: | -Xaggressive -Xcompressedrefs -Xgcpolicy:gencon -Xmn1100m -Xms1500m -Xmx1500m -XlockReservation -Xnoloa -XtlhPrefetch -Xlp -Xgcthreads4 |
| JVM Affinity: | start /affinity [0xF, 0xF0, 0xF00, 0xF000] |
| JVM Instances: | 4 |
| JVM Initial Heap (MB): | 1500 |
| JVM Maximum Heap (MB): | 1500 |
| JVM Address Bits: | 64 |
| Boot Firmware Version: | O34 8/25/09 |
| Management Firmware Version: | 4.04 7/1/09 |
| Workload Version: | SSJ 1.2.6 |
| Director Location: | Controller |
| Other Software: | None |
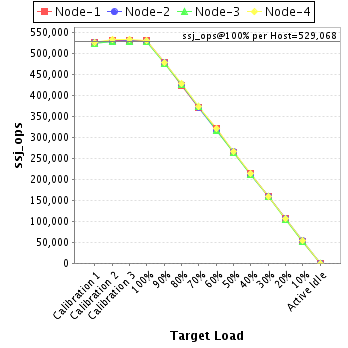
| Host | ssj_ops@100% |
|---|---|
| Node-1 | 530,160 |
| Node-2 | 528,406 |
| Node-3 | 527,395 |
| Node-4 | 530,311 |
| ssj_ops@100% | 2,116,272 |
| ssj_ops@100% per Host | 529,068 |
| ssj_ops@100% per JVM | 132,267 |
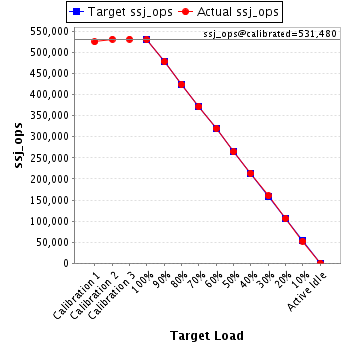
| Target Load | Actual Load | ssj_ops | |
|---|---|---|---|
| Target | Actual | ||
| Calibration 1 | 525,036 | ||
| Calibration 2 | 531,375 | ||
| Calibration 3 | 531,584 | ||
| ssj_ops@calibrated=531,480 | |||
| 100% | 99.8% | 531,480 | 530,160 |
| 90% | 90.0% | 478,332 | 478,240 |
| 80% | 79.8% | 425,184 | 423,921 |
| 70% | 69.9% | 372,036 | 371,474 |
| 60% | 60.2% | 318,888 | 320,029 |
| 50% | 49.7% | 265,740 | 264,201 |
| 40% | 40.1% | 212,592 | 213,366 |
| 30% | 30.1% | 159,444 | 159,853 |
| 20% | 20.0% | 106,296 | 106,088 |
| 10% | 9.9% | 53,148 | 52,554 |
| Active Idle | 0 | 0 | |
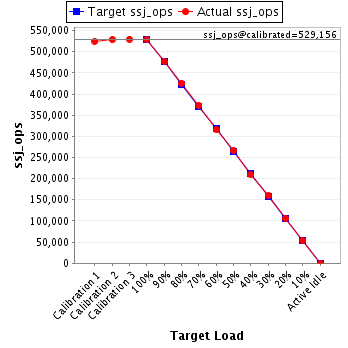
| Target Load | Actual Load | ssj_ops | |
|---|---|---|---|
| Target | Actual | ||
| Calibration 1 | 524,926 | ||
| Calibration 2 | 528,508 | ||
| Calibration 3 | 529,803 | ||
| ssj_ops@calibrated=529,156 | |||
| 100% | 99.9% | 529,156 | 528,406 |
| 90% | 90.2% | 476,240 | 477,315 |
| 80% | 80.5% | 423,324 | 425,935 |
| 70% | 70.3% | 370,409 | 371,993 |
| 60% | 59.7% | 317,493 | 315,873 |
| 50% | 50.3% | 264,578 | 266,234 |
| 40% | 39.8% | 211,662 | 210,499 |
| 30% | 30.1% | 158,747 | 159,360 |
| 20% | 20.0% | 105,831 | 105,821 |
| 10% | 10.1% | 52,916 | 53,262 |
| Active Idle | 0 | 0 | |
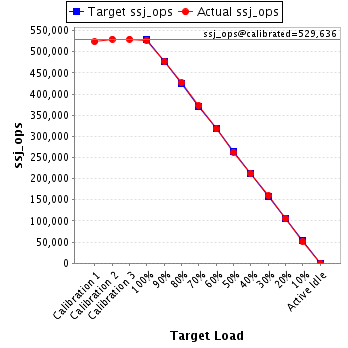
| Target Load | Actual Load | ssj_ops | |
|---|---|---|---|
| Target | Actual | ||
| Calibration 1 | 523,967 | ||
| Calibration 2 | 529,641 | ||
| Calibration 3 | 529,631 | ||
| ssj_ops@calibrated=529,636 | |||
| 100% | 99.6% | 529,636 | 527,395 |
| 90% | 90.0% | 476,672 | 476,828 |
| 80% | 80.6% | 423,709 | 427,016 |
| 70% | 70.3% | 370,745 | 372,409 |
| 60% | 59.9% | 317,782 | 317,363 |
| 50% | 49.6% | 264,818 | 262,944 |
| 40% | 40.0% | 211,854 | 211,671 |
| 30% | 30.0% | 158,891 | 159,129 |
| 20% | 19.9% | 105,927 | 105,259 |
| 10% | 9.9% | 52,964 | 52,212 |
| Active Idle | 0 | 0 | |
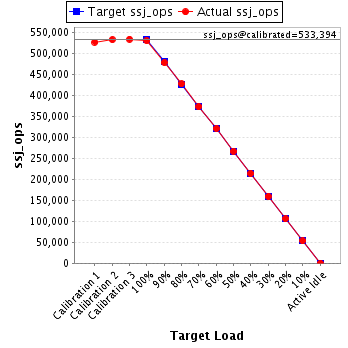
| Target Load | Actual Load | ssj_ops | |
|---|---|---|---|
| Target | Actual | ||
| Calibration 1 | 527,239 | ||
| Calibration 2 | 532,765 | ||
| Calibration 3 | 534,022 | ||
| ssj_ops@calibrated=533,394 | |||
| 100% | 99.4% | 533,394 | 530,311 |
| 90% | 89.7% | 480,054 | 478,215 |
| 80% | 80.1% | 426,715 | 427,300 |
| 70% | 69.9% | 373,375 | 373,000 |
| 60% | 60.2% | 320,036 | 321,193 |
| 50% | 50.1% | 266,697 | 267,278 |
| 40% | 40.1% | 213,357 | 213,785 |
| 30% | 29.9% | 160,018 | 159,346 |
| 20% | 19.8% | 106,679 | 105,763 |
| 10% | 10.0% | 53,339 | 53,212 |
| Active Idle | 0 | 0 | |