
SPECpower_ssj2008
Host 'Node-2' Performance Report
Copyright © 2007-2010 Standard Performance Evaluation Corporation
| Hewlett-Packard Company ProLiant DL170h G6 (2.4 GHz, Intel Xeon L5530) | ssj_ops@100% = 528,406 ssj_ops@100% per JVM = 132,101 |
||||
| Test Sponsor: | Hewlett-Packard Company | SPEC License #: | 3 | Test Method: | Multi Node |
| Tested By: | Hewlett-Packard Company | Test Location: | Houston, TX, USA | Test Date: | Nov 18, 2009 |
| Hardware Availability: | Oct-2009 | Software Availability: | Jul-2009 | Publication: | Jan 13, 2010 |
| System Source: | Single Supplier | System Designation: | Server | Power Provisioning: | Line-powered |
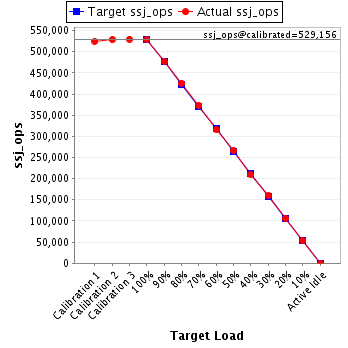
| Target Load | Actual Load | ssj_ops | |
|---|---|---|---|
| Target | Actual | ||
| Calibration 1 | 524,926 | ||
| Calibration 2 | 528,508 | ||
| Calibration 3 | 529,803 | ||
| ssj_ops@calibrated=529,156 | |||
| 100% | 99.9% | 529,156 | 528,406 |
| 90% | 90.2% | 476,240 | 477,315 |
| 80% | 80.5% | 423,324 | 425,935 |
| 70% | 70.3% | 370,409 | 371,993 |
| 60% | 59.7% | 317,493 | 315,873 |
| 50% | 50.3% | 264,578 | 266,234 |
| 40% | 39.8% | 211,662 | 210,499 |
| 30% | 30.1% | 158,747 | 159,360 |
| 20% | 20.0% | 105,831 | 105,821 |
| 10% | 10.1% | 52,916 | 53,262 |
| Active Idle | 0 | 0 | |
| Set Identifier: | sut |
| Set Description: | ProLiant DL4x170h G6 |
| # of Identical Nodes: | 4 |
| Comment: | None |
| Hardware | |
|---|---|
| Hardware Vendor: | Hewlett-Packard Company |
| Model: | ProLiant DL170h G6 (2.4 GHz, Intel Xeon L5530) |
| Form Factor: | 1U |
| CPU Name: | Intel Xeon L5530 |
| CPU Characteristics: | Quad-Core, 2.40 GHz, 8 MB L3 cache |
| CPU Frequency (MHz): | 2400 |
| CPU(s) Enabled: | 8 cores, 2 chips, 4 cores/chip |
| Hardware Threads: | 16 (2 / core) |
| CPU(s) Orderable: | 1,2 chips |
| Primary Cache: | 32 KB I + 32 KB D on chip per core |
| Secondary Cache: | 256 MB I+D on chip per core |
| Tertiary Cache: | 8 MB I+D on chip per chip |
| Other Cache: | None |
| Memory Amount (GB): | 8 |
| # and size of DIMM: | 4 x 2048 MB |
| Memory Details: | 2GB 2Rx4 PC3-10600E; slots 1 and 4 are populated on each processor |
| Power Supply Quantity and Rating (W): | None |
| Power Supply Details: | Shared |
| Disk Drive: | 1 x 60GB SSD 3.5" SATA, HP part #:570761-B21 |
| Disk Controller: | Integrated SATA |
| # and type of Network Interface Cards (NICs) Installed: | 2 x HP NC362i Dual Port Multifunction Gigabit Server Adapters |
| NICs Enabled in Firmware / OS / Connected: | 2/2/1 |
| Network Speed (Mbit): | 1000 |
| Keyboard: | None |
| Mouse: | None |
| Monitor: | None |
| Optical Drives: | No |
| Other Hardware: | None |
| Software | |
|---|---|
| Power Management: | Power saver plan in OS |
| Operating System (OS): | Windows Server 2008 x64, Enterprise Edition |
| OS Version: | R2 |
| Filesystem: | NTFS |
| JVM Vendor: | IBM Corporation |
| JVM Version: | IBM J9 VM (build 2.4, J2RE 1.6.0 IBM J9 2.4 Windows Server 2008 amd64-64 jvmwa6460sr5-20090519_35743 (JIT enabled, AOT enabled) |
| JVM Command-line Options: | -Xaggressive -Xcompressedrefs -Xgcpolicy:gencon -Xmn1100m -Xms1500m -Xmx1500m -XlockReservation -Xnoloa -XtlhPrefetch -Xlp -Xgcthreads4 |
| JVM Affinity: | start /affinity [0xF, 0xF0, 0xF00, 0xF000] |
| JVM Instances: | 4 |
| JVM Initial Heap (MB): | 1500 |
| JVM Maximum Heap (MB): | 1500 |
| JVM Address Bits: | 64 |
| Boot Firmware Version: | O34 8/25/09 |
| Management Firmware Version: | 4.04 7/1/09 |
| Workload Version: | SSJ 1.2.6 |
| Director Location: | Controller |
| Other Software: | None |
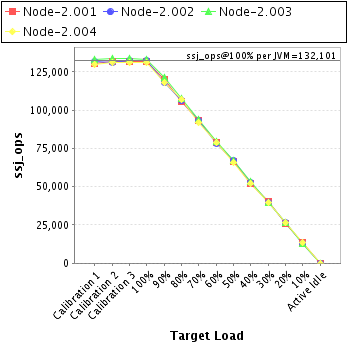
| JVM Instance | ssj_ops@100% |
|---|---|
| Node-2.001 | 131,986 |
| Node-2.002 | 132,395 |
| Node-2.003 | 132,767 |
| Node-2.004 | 131,257 |
| ssj_ops@100% | 528,406 |
| ssj_ops@100% per JVM | 132,101 |
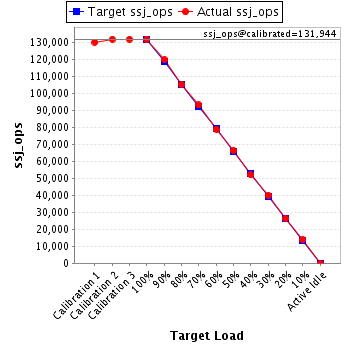
| Target Load | Actual Load | ssj_ops | |
|---|---|---|---|
| Target | Actual | ||
| Calibration 1 | 130,221 | ||
| Calibration 2 | 131,909 | ||
| Calibration 3 | 131,979 | ||
| ssj_ops@calibrated=131,944 | |||
| 100% | 100.0% | 131,944 | 131,986 |
| 90% | 90.9% | 118,750 | 119,900 |
| 80% | 79.9% | 105,555 | 105,455 |
| 70% | 70.7% | 92,361 | 93,242 |
| 60% | 59.9% | 79,166 | 79,027 |
| 50% | 50.3% | 65,972 | 66,319 |
| 40% | 39.5% | 52,778 | 52,147 |
| 30% | 30.3% | 39,583 | 40,015 |
| 20% | 19.9% | 26,389 | 26,275 |
| 10% | 10.4% | 13,194 | 13,749 |
| Active Idle | 0 | 0 | |
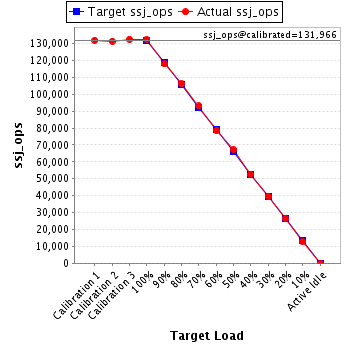
| Target Load | Actual Load | ssj_ops | |
|---|---|---|---|
| Target | Actual | ||
| Calibration 1 | 131,876 | ||
| Calibration 2 | 131,346 | ||
| Calibration 3 | 132,587 | ||
| ssj_ops@calibrated=131,966 | |||
| 100% | 100.3% | 131,966 | 132,395 |
| 90% | 89.4% | 118,770 | 117,982 |
| 80% | 80.5% | 105,573 | 106,179 |
| 70% | 70.5% | 92,377 | 93,045 |
| 60% | 59.5% | 79,180 | 78,508 |
| 50% | 50.8% | 65,983 | 67,051 |
| 40% | 39.9% | 52,787 | 52,656 |
| 30% | 30.1% | 39,590 | 39,782 |
| 20% | 19.9% | 26,393 | 26,307 |
| 10% | 9.8% | 13,197 | 12,977 |
| Active Idle | 0 | 0 | |
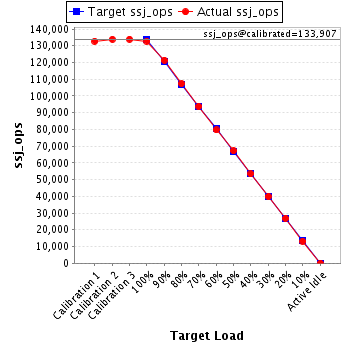
| Target Load | Actual Load | ssj_ops | |
|---|---|---|---|
| Target | Actual | ||
| Calibration 1 | 132,789 | ||
| Calibration 2 | 133,880 | ||
| Calibration 3 | 133,935 | ||
| ssj_ops@calibrated=133,907 | |||
| 100% | 99.1% | 133,907 | 132,767 |
| 90% | 90.7% | 120,517 | 121,439 |
| 80% | 80.1% | 107,126 | 107,319 |
| 70% | 70.0% | 93,735 | 93,757 |
| 60% | 59.5% | 80,344 | 79,665 |
| 50% | 50.2% | 66,954 | 67,170 |
| 40% | 39.8% | 53,563 | 53,355 |
| 30% | 29.8% | 40,172 | 39,920 |
| 20% | 20.1% | 26,781 | 26,936 |
| 10% | 9.9% | 13,391 | 13,213 |
| Active Idle | 0 | 0 | |
| Target Load | Actual Load | ssj_ops | |
|---|---|---|---|
| Target | Actual | ||
| Calibration 1 | 130,041 | ||
| Calibration 2 | 131,373 | ||
| Calibration 3 | 131,302 | ||
| ssj_ops@calibrated=131,338 | |||
| 100% | 99.9% | 131,338 | 131,257 |
| 90% | 89.8% | 118,204 | 117,994 |
| 80% | 81.5% | 105,070 | 106,983 |
| 70% | 70.0% | 91,936 | 91,950 |
| 60% | 59.9% | 78,803 | 78,674 |
| 50% | 50.0% | 65,669 | 65,694 |
| 40% | 39.9% | 52,535 | 52,342 |
| 30% | 30.2% | 39,401 | 39,643 |
| 20% | 20.0% | 26,268 | 26,303 |
| 10% | 10.1% | 13,134 | 13,322 |
| Active Idle | 0 | 0 | |
