SPECpower_ssj2008
Aggregate Performance Report
Copyright © 2007-2022 Standard Performance Evaluation Corporation
| FALINUX, Inc. AnyStor-700EC | ssj_ops@100% = 3,005,115 ssj_ops@100% per Host = 1,502,558 ssj_ops@100% per JVM = 23,477 |
||||
| Test Sponsor: | Telecommunications Technology Association | SPEC License #: | 83 | Test Method: | Multi Node |
| Tested By: | Telecommunications Technology Association | Test Location: | TTA, Seongnam-city, Korea | Test Date: | Nov 11, 2022 |
| Hardware Availability: | Dec-2022 | Software Availability: | Oct-2022 | Publication: | Dec 8, 2022 |
| System Source: | Single Supplier | System Designation: | Server | Power Provisioning: | Line-powered |
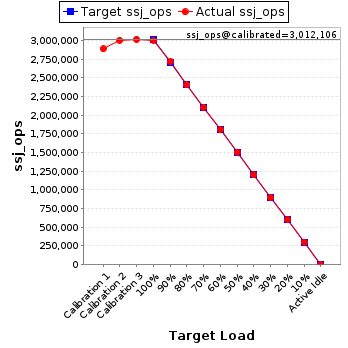
| Target Load | Actual Load | ssj_ops | |
|---|---|---|---|
| Target | Actual | ||
| Calibration 1 | 2,888,283 | ||
| Calibration 2 | 3,005,507 | ||
| Calibration 3 | 3,018,705 | ||
| ssj_ops@calibrated=3,012,106 | |||
| 100% | 99.8% | 3,012,106 | 3,005,115 |
| 90% | 90.1% | 2,710,896 | 2,714,871 |
| 80% | 79.9% | 2,409,685 | 2,407,480 |
| 70% | 70.0% | 2,108,474 | 2,107,575 |
| 60% | 60.0% | 1,807,264 | 1,808,557 |
| 50% | 50.0% | 1,506,053 | 1,507,263 |
| 40% | 39.9% | 1,204,843 | 1,201,400 |
| 30% | 29.9% | 903,632 | 901,120 |
| 20% | 20.1% | 602,421 | 605,636 |
| 10% | 10.0% | 301,211 | 302,522 |
| Active Idle | 0 | 0 | |
| # of Nodes | # of Chips | # of Cores | # of Threads | Total RAM (GB) | # of OS Images | # of JVM Instances |
|---|---|---|---|---|---|---|
| 2 | 2 | 128 | 128 | 64.0 | 2 | 128 |
| Set Identifier: | sut |
| Set Description: | System Under Test |
| # of Identical Nodes: | 2 |
| Comment: | SUT |
| Hardware per Node | |
|---|---|
| Hardware Vendor: | FALINUX, Inc. |
| Model: | AnyStor-700EC |
| Form Factor: | 1U |
| CPU Name: | Ampere® Altra® 64-Bit Multi-Core Processor Q64-30 |
| CPU Characteristics: | 64 Core, 3.0GHz |
| CPU Frequency (MHz): | 3000 |
| CPU(s) Enabled: | 64 cores, 1 chip, 64 cores/chip |
| Hardware Threads: | 64 (1 / core) |
| CPU(s) Orderable: | 1 chip |
| Primary Cache: | 64 KB I + 64 KB D on chip per core |
| Secondary Cache: | 1 MB I+D on chip per core |
| Tertiary Cache: | None |
| Other Cache: | 32 MB I+D on chip per chip (SLC) |
| Memory Amount (GB): | 32 |
| # and size of DIMM: | 2 x 16 GB |
| Memory Details: | 2 x 16GB 2Rx8 PC4-32003G2-R; slots 1 and 8 populated |
| Power Supply Quantity and Rating (W): | None |
| Power Supply Details: | Delta DPS-1200AB-4 E Rev.S0F P/N: ISBD2135007209 |
| Disk Drive: | NMVe M.2 SSD 256 GB |
| Disk Controller: | Non-Volatile Memory Host Controller Interface |
| # and type of Network Interface Cards (NICs) Installed: | 1 x 1Gbps with Intel Corporation I350 Gigabit Network Connection |
| NICs Enabled in Firmware / OS / Connected: | 1/1/1 |
| Network Speed (Mbit): | 1000 |
| Keyboard: | None |
| Mouse: | None |
| Monitor: | None |
| Optical Drives: | No |
| Other Hardware: | None |
| Software per Node | |
|---|---|
| Power Management: | Enabled |
| Operating System (OS): | Red Hat Enterprise Linux Server release 7.8 (Maipo) |
| OS Version: | Kernel 3.10.0-1127.el7.x86_64 |
| Filesystem: | xfs |
| JVM Vendor: | Oracle Corporation |
| JVM Version: | Java HotSpot(TM) 64-Bit Server VM 18.9 (build 11.0.17+10-LTS-269, mixed mode) |
| JVM Command-line Options: | -server -Djava.awt.headless=true -Xms256m -Xmx256m -Djava.net.preferIPv4Stack=true -XX:ParallelGCThreads=15 -XX:SurvivorRatio=60 -XX:TargetSurvivorRatio=90 -XX:InlineSmallCode=3900 -XX:MaxInlineSize=270 -XX:FreqInlineSize=2500 -XX:AllocatePrefetchDistance=256 -XX:AllocatePrefetchLines=4 -XX:InitialTenuringThreshold=12 -XX:MaxTenuringThreshold=15 -XX:LoopUnrollLimit=45 -XX:+UseParallelGC |
| JVM Affinity: | numactl --physcpubind=[0-63] --localalloc |
| JVM Instances: | 64 |
| JVM Initial Heap (MB): | 256 |
| JVM Maximum Heap (MB): | 256 |
| JVM Address Bits: | 64 |
| Boot Firmware Version: | R01 |
| Management Firmware Version: | TianoCore 2.06.100 |
| Workload Version: | SSJ 1.2.10 |
| Director Location: | Controller |
| Other Software: | None |
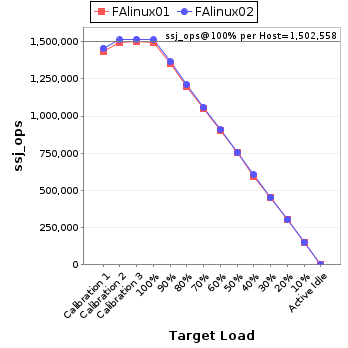
| Host | ssj_ops@100% |
|---|---|
| FAlinux01 | 1,492,669 |
| FAlinux02 | 1,512,446 |
| ssj_ops@100% | 3,005,115 |
| ssj_ops@100% per Host | 1,502,558 |
| ssj_ops@100% per JVM | 23,477 |
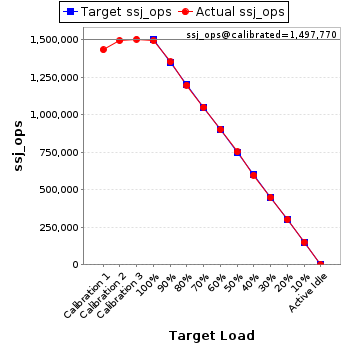
| Target Load | Actual Load | ssj_ops | |
|---|---|---|---|
| Target | Actual | ||
| Calibration 1 | 1,431,827 | ||
| Calibration 2 | 1,493,206 | ||
| Calibration 3 | 1,502,334 | ||
| ssj_ops@calibrated=1,497,770 | |||
| 100% | 99.7% | 1,497,770 | 1,492,669 |
| 90% | 90.2% | 1,347,993 | 1,350,967 |
| 80% | 79.9% | 1,198,216 | 1,196,574 |
| 70% | 70.0% | 1,048,439 | 1,048,929 |
| 60% | 60.1% | 898,662 | 900,778 |
| 50% | 50.2% | 748,885 | 751,442 |
| 40% | 39.8% | 599,108 | 595,647 |
| 30% | 30.0% | 449,331 | 448,833 |
| 20% | 20.1% | 299,554 | 301,649 |
| 10% | 10.0% | 149,777 | 150,254 |
| Active Idle | 0 | 0 | |
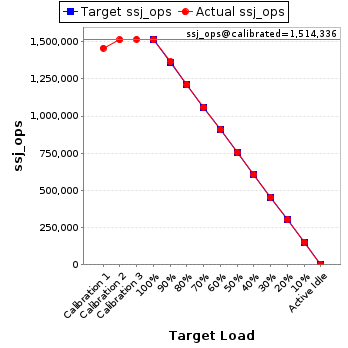
| Target Load | Actual Load | ssj_ops | |
|---|---|---|---|
| Target | Actual | ||
| Calibration 1 | 1,456,456 | ||
| Calibration 2 | 1,512,301 | ||
| Calibration 3 | 1,516,371 | ||
| ssj_ops@calibrated=1,514,336 | |||
| 100% | 99.9% | 1,514,336 | 1,512,446 |
| 90% | 90.1% | 1,362,903 | 1,363,905 |
| 80% | 80.0% | 1,211,469 | 1,210,906 |
| 70% | 69.9% | 1,060,035 | 1,058,646 |
| 60% | 59.9% | 908,602 | 907,780 |
| 50% | 49.9% | 757,168 | 755,821 |
| 40% | 40.0% | 605,734 | 605,753 |
| 30% | 29.9% | 454,301 | 452,287 |
| 20% | 20.1% | 302,867 | 303,987 |
| 10% | 10.1% | 151,434 | 152,268 |
| Active Idle | 0 | 0 | |