SPECpower_ssj2008
Host 'WIN-SUT103' Performance Report
Copyright © 2007-2019 Standard Performance Evaluation Corporation
| New H3C Technologies Co., Ltd. H3C UniServer B5700 G3 | ssj_ops@100% = 5,688,854 ssj_ops@100% per JVM = 1,422,213 |
||||
| Test Sponsor: | New H3C Technologies Co., Ltd. | SPEC License #: | 9066 | Test Method: | Multi Node |
| Tested By: | New H3C Technologies Co., Ltd. | Test Location: | Hangzhou, Zhejiang, China | Test Date: | May 15, 2019 |
| Hardware Availability: | Jan-2019 | Software Availability: | Jan-2019 | Publication: | Jun 12, 2019 |
| System Source: | Single Supplier | System Designation: | Server | Power Provisioning: | Line-powered |
| Target Load | Actual Load | ssj_ops | |
|---|---|---|---|
| Target | Actual | ||
| Calibration 1 | 5,698,483 | ||
| Calibration 2 | 5,689,222 | ||
| Calibration 3 | 5,703,141 | ||
| ssj_ops@calibrated=5,696,181 | |||
| 100% | 99.9% | 5,696,181 | 5,688,854 |
| 90% | 89.9% | 5,126,563 | 5,121,985 |
| 80% | 79.9% | 4,556,945 | 4,553,909 |
| 70% | 70.0% | 3,987,327 | 3,986,568 |
| 60% | 60.0% | 3,417,709 | 3,415,288 |
| 50% | 50.0% | 2,848,091 | 2,848,234 |
| 40% | 39.8% | 2,278,473 | 2,267,292 |
| 30% | 30.0% | 1,708,854 | 1,706,406 |
| 20% | 20.0% | 1,139,236 | 1,140,432 |
| 10% | 10.0% | 569,618 | 570,381 |
| Active Idle | 0 | 0 | |

| Set Identifier: | sut |
| Set Description: | System Under Test |
| # of Identical Nodes: | 10 |
| Comment: | SUT |
| Hardware | |
|---|---|
| Hardware Vendor: | New H3C Technologies Co., Ltd. |
| Model: | H3C UniServer B5700 G3 |
| Form Factor: | Other |
| CPU Name: | Intel Xeon Platinum 8180 2.50GHz |
| CPU Characteristics: | 28-Core, 2.50 GHz, 38.5 MB L3 Cache |
| CPU Frequency (MHz): | 2500 |
| CPU(s) Enabled: | 56 cores, 2 chips, 28 cores/chip |
| Hardware Threads: | 112 (2 / core) |
| CPU(s) Orderable: | 1,2 chips |
| Primary Cache: | 32 KB I + 32 KB D on chip per core |
| Secondary Cache: | 1 MB I+D on chip per core |
| Tertiary Cache: | 39424 KB I+D on chip per chip |
| Other Cache: | None |
| Memory Amount (GB): | 192.0 |
| # and size of DIMM: | 12 x 16384 MB |
| Memory Details: | 12 x 16GB 2Rx8 PC4-2666-V ECC;slots A1, A2, A3, A4, A5, A6, B1, B2, B3, B4, B5, B6 populated |
| Power Supply Quantity and Rating (W): | None |
| Power Supply Details: | Shared |
| Disk Drive: | SATA DOM 128GB P/N DESSH-A28D09BCADCA |
| Disk Controller: | Integrated SATA controller |
| # and type of Network Interface Cards (NICs) Installed: | 1 x Intel I350 Gigabit Ethernet Controller |
| NICs Enabled in Firmware / OS / Connected: | 2/2/1 |
| Network Speed (Mbit): | 1000 |
| Keyboard: | None |
| Mouse: | None |
| Monitor: | None |
| Optical Drives: | No |
| Other Hardware: | None |
| Software | |
|---|---|
| Power Management: | Balanced Mode enabled in OS (see SUT Notes) |
| Operating System (OS): | Microsoft Windows Server 2012 R2 Datacenter |
| OS Version: | Version 6.3 (Build 9600) |
| Filesystem: | NTFS |
| JVM Vendor: | Oracle Corporation |
| JVM Version: | Java HotSpot(TM) 64-Bit Server VM (build 24.80-b11, mixed mode), version 1.7.0_80 |
| JVM Command-line Options: | -server -Xmn19g -Xms21g -Xmx21g -XX:SurvivorRatio=1 -XX:TargetSurvivorRatio=99 -XX:ParallelGCThreads=28 -XX:AllocatePrefetchDistance=256 -XX:AllocatePrefetchLines=4 -XX:LoopUnrollLimit=45 -XX:InitialTenuringThreshold=12 -XX:MaxTenuringThreshold=15 -XX:InlineSmallCode=9000 -XX:MaxInlineSize=270 -XX:FreqInlineSize=6000 -XX:+UseLargePages -XX:+UseParallelOldGC -XX:+AggressiveOpts |
| JVM Affinity: | start /NODE [0,2] /AFFINITY [0xFC0FF00FC0FF];start /NODE [1,3] /AFFINITY [0xFF03F00FF03F] |
| JVM Instances: | 4 |
| JVM Initial Heap (MB): | 21000 |
| JVM Maximum Heap (MB): | 21000 |
| JVM Address Bits: | 64 |
| Boot Firmware Version: | 2.00.25 |
| Management Firmware Version: | UIS-OM 1.00.10 |
| Workload Version: | SSJ 1.2.10 |
| Director Location: | Controller |
| Other Software: | Microsoft Windows KB3021910, clearcompressionflag.exe, KB2919355, KB2932046, KB2959977, KB2937592, KB2938439, KB2934018, KB4056898, patched to this test system in May 6, 2019 |
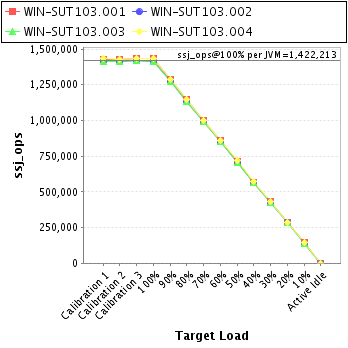
| JVM Instance | ssj_ops@100% |
|---|---|
| WIN-SUT103.001 | 1,430,345 |
| WIN-SUT103.002 | 1,414,258 |
| WIN-SUT103.003 | 1,412,689 |
| WIN-SUT103.004 | 1,431,562 |
| ssj_ops@100% | 5,688,854 |
| ssj_ops@100% per JVM | 1,422,213 |
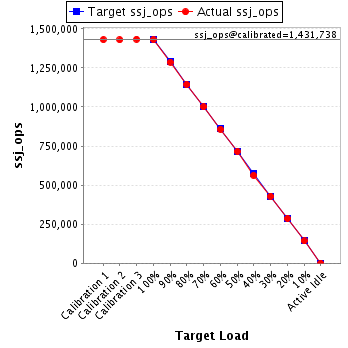
| Target Load | Actual Load | ssj_ops | |
|---|---|---|---|
| Target | Actual | ||
| Calibration 1 | 1,430,012 | ||
| Calibration 2 | 1,429,662 | ||
| Calibration 3 | 1,433,813 | ||
| ssj_ops@calibrated=1,431,738 | |||
| 100% | 99.9% | 1,431,738 | 1,430,345 |
| 90% | 89.9% | 1,288,564 | 1,287,060 |
| 80% | 79.9% | 1,145,390 | 1,143,968 |
| 70% | 69.9% | 1,002,216 | 1,000,384 |
| 60% | 59.9% | 859,043 | 857,684 |
| 50% | 49.9% | 715,869 | 714,978 |
| 40% | 39.3% | 572,695 | 562,090 |
| 30% | 30.0% | 429,521 | 429,269 |
| 20% | 19.9% | 286,348 | 285,613 |
| 10% | 10.0% | 143,174 | 142,687 |
| Active Idle | 0 | 0 | |
| Target Load | Actual Load | ssj_ops | |
|---|---|---|---|
| Target | Actual | ||
| Calibration 1 | 1,417,034 | ||
| Calibration 2 | 1,415,863 | ||
| Calibration 3 | 1,417,704 | ||
| ssj_ops@calibrated=1,416,784 | |||
| 100% | 99.8% | 1,416,784 | 1,414,258 |
| 90% | 90.1% | 1,275,105 | 1,276,861 |
| 80% | 79.8% | 1,133,427 | 1,131,292 |
| 70% | 70.0% | 991,749 | 992,334 |
| 60% | 60.0% | 850,070 | 850,092 |
| 50% | 50.0% | 708,392 | 708,926 |
| 40% | 39.9% | 566,714 | 564,791 |
| 30% | 29.9% | 425,035 | 423,496 |
| 20% | 20.0% | 283,357 | 283,554 |
| 10% | 10.0% | 141,678 | 141,323 |
| Active Idle | 0 | 0 | |

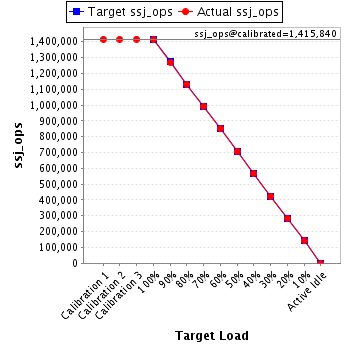
| Target Load | Actual Load | ssj_ops | |
|---|---|---|---|
| Target | Actual | ||
| Calibration 1 | 1,415,614 | ||
| Calibration 2 | 1,415,064 | ||
| Calibration 3 | 1,416,615 | ||
| ssj_ops@calibrated=1,415,840 | |||
| 100% | 99.8% | 1,415,840 | 1,412,689 |
| 90% | 89.7% | 1,274,256 | 1,269,697 |
| 80% | 80.0% | 1,132,672 | 1,132,276 |
| 70% | 70.1% | 991,088 | 992,223 |
| 60% | 60.0% | 849,504 | 849,442 |
| 50% | 50.0% | 707,920 | 707,665 |
| 40% | 40.0% | 566,336 | 566,601 |
| 30% | 30.0% | 424,752 | 424,323 |
| 20% | 20.0% | 283,168 | 283,013 |
| 10% | 10.0% | 141,584 | 141,533 |
| Active Idle | 0 | 0 | |
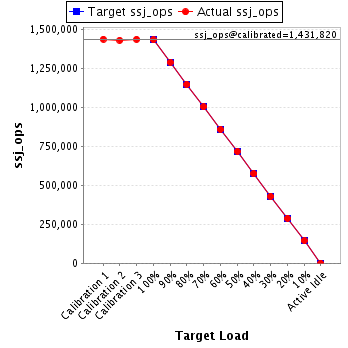
| Target Load | Actual Load | ssj_ops | |
|---|---|---|---|
| Target | Actual | ||
| Calibration 1 | 1,435,823 | ||
| Calibration 2 | 1,428,633 | ||
| Calibration 3 | 1,435,008 | ||
| ssj_ops@calibrated=1,431,820 | |||
| 100% | 100.0% | 1,431,820 | 1,431,562 |
| 90% | 90.0% | 1,288,638 | 1,288,368 |
| 80% | 80.1% | 1,145,456 | 1,146,374 |
| 70% | 70.0% | 1,002,274 | 1,001,627 |
| 60% | 59.9% | 859,092 | 858,070 |
| 50% | 50.1% | 715,910 | 716,664 |
| 40% | 40.1% | 572,728 | 573,810 |
| 30% | 30.0% | 429,546 | 429,317 |
| 20% | 20.1% | 286,364 | 288,251 |
| 10% | 10.1% | 143,182 | 144,838 |
| Active Idle | 0 | 0 | |