SPECpower_ssj2008
Aggregate Performance Report
Copyright © 2007-2019 Standard Performance Evaluation Corporation
| Hewlett Packard Enterprise Synergy 480 Gen10 Compute Module | ssj_ops@100% = 69,086,440 ssj_ops@100% per Host = 5,757,203 ssj_ops@100% per JVM = 1,439,301 |
||||
| Test Sponsor: | Hewlett Packard Enterprise | SPEC License #: | 3 | Test Method: | Multi Node |
| Tested By: | Hewlett Packard Enterprise | Test Location: | Houston, TX, USA | Test Date: | Apr 8, 2019 |
| Hardware Availability: | Apr-2019 | Software Availability: | Mar-2019 | Publication: | May 8, 2019 |
| System Source: | Single Supplier | System Designation: | Server | Power Provisioning: | Line-powered |
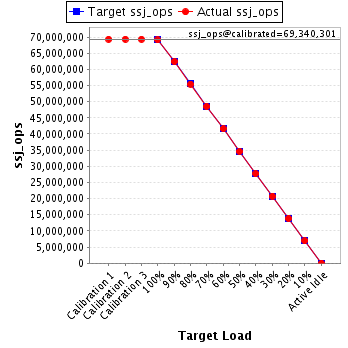
| Target Load | Actual Load | ssj_ops | |
|---|---|---|---|
| Target | Actual | ||
| Calibration 1 | 69,335,169 | ||
| Calibration 2 | 69,339,945 | ||
| Calibration 3 | 69,340,657 | ||
| ssj_ops@calibrated=69,340,301 | |||
| 100% | 99.6% | 69,340,301 | 69,086,440 |
| 90% | 90.0% | 62,406,271 | 62,410,813 |
| 80% | 80.0% | 55,472,241 | 55,454,906 |
| 70% | 70.0% | 48,538,211 | 48,541,784 |
| 60% | 60.0% | 41,604,181 | 41,617,209 |
| 50% | 50.0% | 34,670,151 | 34,673,544 |
| 40% | 40.0% | 27,736,120 | 27,715,117 |
| 30% | 30.0% | 20,802,090 | 20,788,854 |
| 20% | 20.0% | 13,868,060 | 13,877,844 |
| 10% | 10.0% | 6,934,030 | 6,940,921 |
| Active Idle | 0 | 0 | |
| # of Nodes | # of Chips | # of Cores | # of Threads | Total RAM (GB) | # of OS Images | # of JVM Instances |
|---|---|---|---|---|---|---|
| 12 | 24 | 672 | 1,344 | 2,304 | 12 | 48 |
| Set Identifier: | SUT |
| Set Description: | System Under Test |
| # of Identical Nodes: | 12 |
| Comment: | SUT |
| Hardware per Node | |
|---|---|
| Hardware Vendor: | Hewlett Packard Enterprise |
| Model: | Synergy 480 Gen10 Compute Module |
| Form Factor: | 7U |
| CPU Name: | Intel Xeon Platinum 8280 @ 2.70GHz (Intel Turbo Boost Technology up to 4.00 GHz) |
| CPU Characteristics: | 28-Core, 2.70 GHz, 38.5MB L3 Cache |
| CPU Frequency (MHz): | 2700 |
| CPU(s) Enabled: | 56 cores, 2 chips, 28 cores/chip |
| Hardware Threads: | 112 (2 / core) |
| CPU(s) Orderable: | 1,2 chips |
| Primary Cache: | 32 KB I + 32 KB D on chip per core |
| Secondary Cache: | 1 MB I+D on chip per core |
| Tertiary Cache: | 39424 KB I+D on chip per chip |
| Other Cache: | None |
| Memory Amount (GB): | 192 |
| # and size of DIMM: | 12 x 16384 MB |
| Memory Details: | 12 x 16GB 2Rx8 PC4-2933Y-R; slots 1, 3, 5, 8, 10 and 12 populated in each socket |
| Power Supply Quantity and Rating (W): | None |
| Power Supply Details: | N/A |
| Disk Drive: | 1 x HPE 240GB 6G SATA M.2 SSD (875488-B21) |
| Disk Controller: | HPE Smart Array S100i SR Gen10 |
| # and type of Network Interface Cards (NICs) Installed: | 1 x HPE Synergy 3820C 10/20Gb CNA |
| NICs Enabled in Firmware / OS / Connected: | 2/2/1 |
| Network Speed (Mbit): | 1000 |
| Keyboard: | None |
| Mouse: | None |
| Monitor: | None |
| Optical Drives: | No |
| Other Hardware: | H/S: Standard |
| Software per Node | |
|---|---|
| Power Management: | Enabled (see SUT Notes) |
| Operating System (OS): | Windows Server 2012 R2 Datacenter |
| OS Version: | Version 6.3 (Build 9600) |
| Filesystem: | NTFS |
| JVM Vendor: | Oracle Corporation |
| JVM Version: | Oracle Java HotSpot(TM) 64-Bit Server VM (build 24.80-b11, mixed mode), version 1.7.0_80 |
| JVM Command-line Options: | -server -Xmn19000m -Xms21000m -Xmx21000m -XX:SurvivorRatio=1 -XX:TargetSurvivorRatio=99 -XX:AllocatePrefetchDistance=256 -XX:AllocatePrefetchLines=4 -XX:LoopUnrollLimit=45 -XX:InitialTenuringThreshold=12 -XX:MaxTenuringThreshold=15 -XX:ParallelGCThreads=28 -XX:InlineSmallCode=3900 -XX:MaxInlineSize=270 -XX:FreqInlineSize=2500 -XX:+AggressiveOpts -XX:+UseLargePages -XX:+UseParallelOldGC |
| JVM Affinity: | start /NODE [0,1,2,3] /AFFINITY [0xFFFFFFF] |
| JVM Instances: | 4 |
| JVM Initial Heap (MB): | 21000 |
| JVM Maximum Heap (MB): | 21000 |
| JVM Address Bits: | 64 |
| Boot Firmware Version: | I42 v2.00 (02/02/2019) |
| Management Firmware Version: | 1.40 Feb 05 2019 |
| Workload Version: | SSJ 1.2.10 |
| Director Location: | Controller |
| Other Software: | HPE Service Pack for ProLiant (SPP) Version: 2019.03.0, Microsoft Windows KB4056898, KB4338815 |
| Host | ssj_ops@100% |
|---|---|
| NODE01 | 5,762,552 |
| NODE02 | 5,734,191 |
| NODE03 | 5,759,851 |
| NODE04 | 5,783,375 |
| NODE05 | 5,745,922 |
| NODE06 | 5,782,860 |
| NODE07 | 5,752,351 |
| NODE08 | 5,748,411 |
| NODE09 | 5,732,357 |
| NODE10 | 5,744,486 |
| NODE11 | 5,761,544 |
| NODE12 | 5,778,540 |
| ssj_ops@100% | 69,086,440 |
| ssj_ops@100% per Host | 5,757,203 |
| ssj_ops@100% per JVM | 1,439,301 |

| Target Load | Actual Load | ssj_ops | |
|---|---|---|---|
| Target | Actual | ||
| Calibration 1 | 5,780,630 | ||
| Calibration 2 | 5,779,963 | ||
| Calibration 3 | 5,780,328 | ||
| ssj_ops@calibrated=5,780,145 | |||
| 100% | 99.7% | 5,780,145 | 5,762,552 |
| 90% | 90.0% | 5,202,131 | 5,201,358 |
| 80% | 80.0% | 4,624,116 | 4,623,988 |
| 70% | 69.9% | 4,046,102 | 4,042,657 |
| 60% | 60.0% | 3,468,087 | 3,466,472 |
| 50% | 50.0% | 2,890,073 | 2,890,468 |
| 40% | 39.8% | 2,312,058 | 2,302,743 |
| 30% | 30.0% | 1,734,044 | 1,734,664 |
| 20% | 20.0% | 1,156,029 | 1,156,593 |
| 10% | 10.0% | 578,015 | 577,751 |
| Active Idle | 0 | 0 | |

| Target Load | Actual Load | ssj_ops | |
|---|---|---|---|
| Target | Actual | ||
| Calibration 1 | 5,761,339 | ||
| Calibration 2 | 5,761,265 | ||
| Calibration 3 | 5,759,027 | ||
| ssj_ops@calibrated=5,760,146 | |||
| 100% | 99.5% | 5,760,146 | 5,734,191 |
| 90% | 90.1% | 5,184,131 | 5,189,375 |
| 80% | 80.0% | 4,608,117 | 4,605,522 |
| 70% | 70.1% | 4,032,102 | 4,035,822 |
| 60% | 60.0% | 3,456,087 | 3,454,174 |
| 50% | 50.0% | 2,880,073 | 2,881,528 |
| 40% | 40.0% | 2,304,058 | 2,304,289 |
| 30% | 30.0% | 1,728,044 | 1,727,102 |
| 20% | 20.0% | 1,152,029 | 1,151,627 |
| 10% | 10.0% | 576,015 | 578,791 |
| Active Idle | 0 | 0 | |

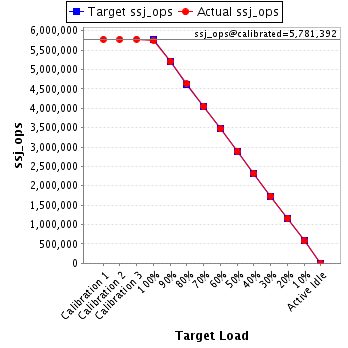
| Target Load | Actual Load | ssj_ops | |
|---|---|---|---|
| Target | Actual | ||
| Calibration 1 | 5,777,862 | ||
| Calibration 2 | 5,778,397 | ||
| Calibration 3 | 5,784,388 | ||
| ssj_ops@calibrated=5,781,392 | |||
| 100% | 99.6% | 5,781,392 | 5,759,851 |
| 90% | 90.1% | 5,203,253 | 5,208,026 |
| 80% | 80.0% | 4,625,114 | 4,627,710 |
| 70% | 70.0% | 4,046,975 | 4,046,598 |
| 60% | 59.9% | 3,468,835 | 3,465,741 |
| 50% | 50.0% | 2,890,696 | 2,891,651 |
| 40% | 40.0% | 2,312,557 | 2,314,244 |
| 30% | 30.0% | 1,734,418 | 1,733,945 |
| 20% | 20.0% | 1,156,278 | 1,156,777 |
| 10% | 10.0% | 578,139 | 577,972 |
| Active Idle | 0 | 0 | |
| Target Load | Actual Load | ssj_ops | |
|---|---|---|---|
| Target | Actual | ||
| Calibration 1 | 5,798,736 | ||
| Calibration 2 | 5,802,764 | ||
| Calibration 3 | 5,800,733 | ||
| ssj_ops@calibrated=5,801,748 | |||
| 100% | 99.7% | 5,801,748 | 5,783,375 |
| 90% | 90.0% | 5,221,574 | 5,221,928 |
| 80% | 80.0% | 4,641,399 | 4,640,563 |
| 70% | 70.2% | 4,061,224 | 4,070,148 |
| 60% | 60.0% | 3,481,049 | 3,481,692 |
| 50% | 50.0% | 2,900,874 | 2,901,003 |
| 40% | 39.9% | 2,320,699 | 2,316,724 |
| 30% | 30.0% | 1,740,525 | 1,738,087 |
| 20% | 20.0% | 1,160,350 | 1,162,938 |
| 10% | 10.0% | 580,175 | 580,527 |
| Active Idle | 0 | 0 | |

| Target Load | Actual Load | ssj_ops | |
|---|---|---|---|
| Target | Actual | ||
| Calibration 1 | 5,773,637 | ||
| Calibration 2 | 5,770,422 | ||
| Calibration 3 | 5,766,856 | ||
| ssj_ops@calibrated=5,768,639 | |||
| 100% | 99.6% | 5,768,639 | 5,745,922 |
| 90% | 90.0% | 5,191,775 | 5,191,767 |
| 80% | 79.9% | 4,614,911 | 4,611,820 |
| 70% | 70.0% | 4,038,047 | 4,036,429 |
| 60% | 60.1% | 3,461,183 | 3,467,090 |
| 50% | 50.0% | 2,884,319 | 2,882,719 |
| 40% | 40.0% | 2,307,456 | 2,306,233 |
| 30% | 30.0% | 1,730,592 | 1,731,894 |
| 20% | 20.1% | 1,153,728 | 1,157,047 |
| 10% | 10.0% | 576,864 | 578,650 |
| Active Idle | 0 | 0 | |

| Target Load | Actual Load | ssj_ops | |
|---|---|---|---|
| Target | Actual | ||
| Calibration 1 | 5,804,108 | ||
| Calibration 2 | 5,807,573 | ||
| Calibration 3 | 5,803,827 | ||
| ssj_ops@calibrated=5,805,700 | |||
| 100% | 99.6% | 5,805,700 | 5,782,860 |
| 90% | 89.9% | 5,225,130 | 5,222,155 |
| 80% | 80.0% | 4,644,560 | 4,643,332 |
| 70% | 70.0% | 4,063,990 | 4,063,428 |
| 60% | 60.0% | 3,483,420 | 3,483,074 |
| 50% | 50.1% | 2,902,850 | 2,907,122 |
| 40% | 40.1% | 2,322,280 | 2,326,758 |
| 30% | 30.0% | 1,741,710 | 1,740,469 |
| 20% | 20.0% | 1,161,140 | 1,161,080 |
| 10% | 10.0% | 580,570 | 579,034 |
| Active Idle | 0 | 0 | |

| Target Load | Actual Load | ssj_ops | |
|---|---|---|---|
| Target | Actual | ||
| Calibration 1 | 5,775,216 | ||
| Calibration 2 | 5,772,257 | ||
| Calibration 3 | 5,774,560 | ||
| ssj_ops@calibrated=5,773,409 | |||
| 100% | 99.6% | 5,773,409 | 5,752,351 |
| 90% | 89.9% | 5,196,068 | 5,187,871 |
| 80% | 80.0% | 4,618,727 | 4,621,446 |
| 70% | 69.9% | 4,041,386 | 4,034,772 |
| 60% | 60.1% | 3,464,045 | 3,470,092 |
| 50% | 50.0% | 2,886,704 | 2,889,484 |
| 40% | 39.9% | 2,309,363 | 2,303,551 |
| 30% | 30.0% | 1,732,023 | 1,733,120 |
| 20% | 20.0% | 1,154,682 | 1,157,108 |
| 10% | 10.0% | 577,341 | 576,162 |
| Active Idle | 0 | 0 | |

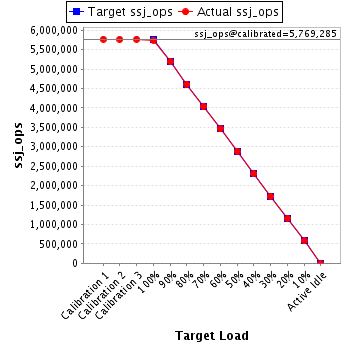
| Target Load | Actual Load | ssj_ops | |
|---|---|---|---|
| Target | Actual | ||
| Calibration 1 | 5,769,158 | ||
| Calibration 2 | 5,766,350 | ||
| Calibration 3 | 5,772,221 | ||
| ssj_ops@calibrated=5,769,285 | |||
| 100% | 99.6% | 5,769,285 | 5,748,411 |
| 90% | 90.0% | 5,192,357 | 5,194,877 |
| 80% | 80.0% | 4,615,428 | 4,614,081 |
| 70% | 70.1% | 4,038,500 | 4,042,004 |
| 60% | 60.0% | 3,461,571 | 3,461,469 |
| 50% | 50.1% | 2,884,643 | 2,888,555 |
| 40% | 39.9% | 2,307,714 | 2,303,731 |
| 30% | 29.9% | 1,730,786 | 1,726,949 |
| 20% | 20.0% | 1,153,857 | 1,155,542 |
| 10% | 10.0% | 576,929 | 578,720 |
| Active Idle | 0 | 0 | |
| Target Load | Actual Load | ssj_ops | |
|---|---|---|---|
| Target | Actual | ||
| Calibration 1 | 5,759,360 | ||
| Calibration 2 | 5,754,199 | ||
| Calibration 3 | 5,754,356 | ||
| ssj_ops@calibrated=5,754,278 | |||
| 100% | 99.6% | 5,754,278 | 5,732,357 |
| 90% | 90.1% | 5,178,850 | 5,182,489 |
| 80% | 79.9% | 4,603,422 | 4,598,575 |
| 70% | 70.0% | 4,027,994 | 4,028,739 |
| 60% | 60.0% | 3,452,567 | 3,451,249 |
| 50% | 49.9% | 2,877,139 | 2,871,367 |
| 40% | 40.1% | 2,301,711 | 2,304,824 |
| 30% | 30.0% | 1,726,283 | 1,727,661 |
| 20% | 20.0% | 1,150,856 | 1,150,206 |
| 10% | 10.0% | 575,428 | 575,267 |
| Active Idle | 0 | 0 | |

| Target Load | Actual Load | ssj_ops | |
|---|---|---|---|
| Target | Actual | ||
| Calibration 1 | 5,758,343 | ||
| Calibration 2 | 5,764,383 | ||
| Calibration 3 | 5,757,339 | ||
| ssj_ops@calibrated=5,760,861 | |||
| 100% | 99.7% | 5,760,861 | 5,744,486 |
| 90% | 90.0% | 5,184,775 | 5,186,754 |
| 80% | 80.0% | 4,608,689 | 4,609,767 |
| 70% | 70.0% | 4,032,603 | 4,034,763 |
| 60% | 60.0% | 3,456,517 | 3,455,244 |
| 50% | 50.0% | 2,880,431 | 2,878,237 |
| 40% | 40.0% | 2,304,344 | 2,302,573 |
| 30% | 29.9% | 1,728,258 | 1,723,274 |
| 20% | 20.0% | 1,152,172 | 1,154,631 |
| 10% | 10.0% | 576,086 | 577,681 |
| Active Idle | 0 | 0 | |

| Target Load | Actual Load | ssj_ops | |
|---|---|---|---|
| Target | Actual | ||
| Calibration 1 | 5,785,083 | ||
| Calibration 2 | 5,781,466 | ||
| Calibration 3 | 5,785,281 | ||
| ssj_ops@calibrated=5,783,374 | |||
| 100% | 99.6% | 5,783,374 | 5,761,544 |
| 90% | 90.1% | 5,205,036 | 5,209,461 |
| 80% | 80.0% | 4,626,699 | 4,626,691 |
| 70% | 70.0% | 4,048,362 | 4,048,294 |
| 60% | 60.1% | 3,470,024 | 3,475,122 |
| 50% | 50.0% | 2,891,687 | 2,892,515 |
| 40% | 40.0% | 2,313,349 | 2,313,581 |
| 30% | 29.9% | 1,735,012 | 1,731,859 |
| 20% | 20.0% | 1,156,675 | 1,156,554 |
| 10% | 10.0% | 578,337 | 580,893 |
| Active Idle | 0 | 0 | |

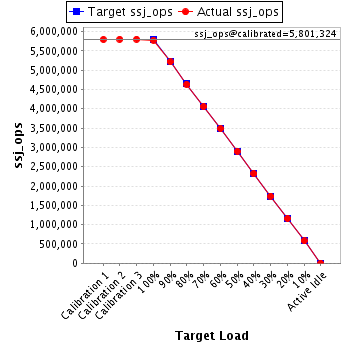
| Target Load | Actual Load | ssj_ops | |
|---|---|---|---|
| Target | Actual | ||
| Calibration 1 | 5,791,696 | ||
| Calibration 2 | 5,800,906 | ||
| Calibration 3 | 5,801,742 | ||
| ssj_ops@calibrated=5,801,324 | |||
| 100% | 99.6% | 5,801,324 | 5,778,540 |
| 90% | 89.9% | 5,221,192 | 5,214,751 |
| 80% | 79.8% | 4,641,059 | 4,631,411 |
| 70% | 70.0% | 4,060,927 | 4,058,131 |
| 60% | 60.1% | 3,480,794 | 3,485,790 |
| 50% | 50.0% | 2,900,662 | 2,898,895 |
| 40% | 39.9% | 2,320,530 | 2,315,867 |
| 30% | 30.0% | 1,740,397 | 1,739,830 |
| 20% | 20.0% | 1,160,265 | 1,157,742 |
| 10% | 10.0% | 580,132 | 579,472 |
| Active Idle | 0 | 0 | |