
SPECpower_ssj2008
Host 'NODE06' Performance Report
Copyright © 2007-2019 Standard Performance Evaluation Corporation
| Hewlett Packard Enterprise Synergy 480 Gen10 Compute Module | ssj_ops@100% = 5,752,696 ssj_ops@100% per JVM = 1,438,174 |
||||
| Test Sponsor: | Hewlett Packard Enterprise | SPEC License #: | 3 | Test Method: | Multi Node |
| Tested By: | Hewlett Packard Enterprise | Test Location: | Houston, TX, USA | Test Date: | Mar 26, 2019 |
| Hardware Availability: | Apr-2019 | Software Availability: | Mar-2019 | Publication: | May 8, 2019 |
| System Source: | Single Supplier | System Designation: | Server | Power Provisioning: | Line-powered |
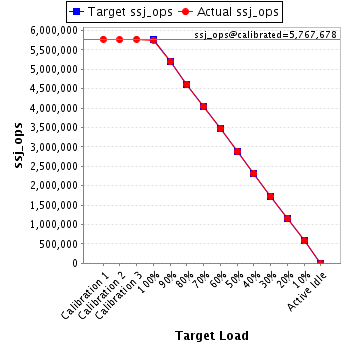
| Target Load | Actual Load | ssj_ops | |
|---|---|---|---|
| Target | Actual | ||
| Calibration 1 | 5,775,620 | ||
| Calibration 2 | 5,760,187 | ||
| Calibration 3 | 5,775,169 | ||
| ssj_ops@calibrated=5,767,678 | |||
| 100% | 99.7% | 5,767,678 | 5,752,696 |
| 90% | 90.1% | 5,190,910 | 5,196,883 |
| 80% | 80.0% | 4,614,143 | 4,613,351 |
| 70% | 70.0% | 4,037,375 | 4,035,106 |
| 60% | 60.0% | 3,460,607 | 3,462,677 |
| 50% | 50.1% | 2,883,839 | 2,888,465 |
| 40% | 40.2% | 2,307,071 | 2,315,904 |
| 30% | 30.0% | 1,730,303 | 1,730,282 |
| 20% | 20.0% | 1,153,536 | 1,152,439 |
| 10% | 10.0% | 576,768 | 577,860 |
| Active Idle | 0 | 0 | |
| Set Identifier: | SUT |
| Set Description: | System Under Test |
| # of Identical Nodes: | 8 |
| Comment: | SUT |
| Hardware | |
|---|---|
| Hardware Vendor: | Hewlett Packard Enterprise |
| Model: | Synergy 480 Gen10 Compute Module |
| Form Factor: | 7U |
| CPU Name: | Intel Xeon Platinum 8280 @ 2.70GHz (Intel Turbo Boost Technology up to 4.00 GHz) |
| CPU Characteristics: | 28-Core, 2.70 GHz, 38.5MB L3 Cache |
| CPU Frequency (MHz): | 2700 |
| CPU(s) Enabled: | 56 cores, 2 chips, 28 cores/chip |
| Hardware Threads: | 112 (2 / core) |
| CPU(s) Orderable: | 1,2 chips |
| Primary Cache: | 32 KB I + 32 KB D on chip per core |
| Secondary Cache: | 1 MB I+D on chip per core |
| Tertiary Cache: | 39424 KB I+D on chip per chip |
| Other Cache: | None |
| Memory Amount (GB): | 192 |
| # and size of DIMM: | 12 x 16384 MB |
| Memory Details: | 12 x 16GB 2Rx8 PC4-2933Y-R; slots 1, 3, 5, 8, 10 and 12 populated in each socket |
| Power Supply Quantity and Rating (W): | None |
| Power Supply Details: | N/A |
| Disk Drive: | 1 x HPE 240GB 6G SATA M.2 SSD (875488-B21) |
| Disk Controller: | HPE Smart Array S100i SR Gen10 |
| # and type of Network Interface Cards (NICs) Installed: | 1 x HPE Synergy 3820C 10/20Gb CNA |
| NICs Enabled in Firmware / OS / Connected: | 2/2/1 |
| Network Speed (Mbit): | 1000 |
| Keyboard: | None |
| Mouse: | None |
| Monitor: | None |
| Optical Drives: | No |
| Other Hardware: | H/S: Standard |
| Software | |
|---|---|
| Power Management: | Enabled (see SUT Notes) |
| Operating System (OS): | Windows Server 2012 R2 Datacenter |
| OS Version: | Version 6.3 (Build 9600) |
| Filesystem: | NTFS |
| JVM Vendor: | Oracle Corporation |
| JVM Version: | Oracle Java HotSpot(TM) 64-Bit Server VM (build 24.80-b11, mixed mode), version 1.7.0_80 |
| JVM Command-line Options: | -server -Xmn21000m -Xms24000m -Xmx24000m -XX:SurvivorRatio=1 -XX:TargetSurvivorRatio=99 -XX:AllocatePrefetchDistance=256 -XX:AllocatePrefetchLines=4 -XX:LoopUnrollLimit=45 -XX:InitialTenuringThreshold=12 -XX:MaxTenuringThreshold=15 -XX:ParallelGCThreads=28 -XX:InlineSmallCode=3900 -XX:MaxInlineSize=270 -XX:FreqInlineSize=2500 -XX:+AggressiveOpts -XX:+UseLargePages -XX:+UseParallelOldGC |
| JVM Affinity: | start /NODE [0,1,2,3] /AFFINITY [0xFFFFFFF] |
| JVM Instances: | 4 |
| JVM Initial Heap (MB): | 24000 |
| JVM Maximum Heap (MB): | 24000 |
| JVM Address Bits: | 64 |
| Boot Firmware Version: | I42 v2.00 (02/02/2019) |
| Management Firmware Version: | 1.40 Feb 05 2019 |
| Workload Version: | SSJ 1.2.10 |
| Director Location: | Controller |
| Other Software: | HPE Service Pack for ProLiant (SPP) Version: 2019.03.0, Microsoft Windows KB4056898, KB4338815 |
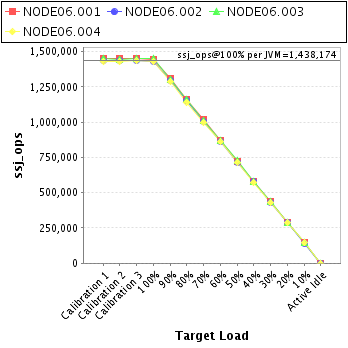
| JVM Instance | ssj_ops@100% |
|---|---|
| NODE06.001 | 1,444,183 |
| NODE06.002 | 1,433,372 |
| NODE06.003 | 1,448,131 |
| NODE06.004 | 1,427,010 |
| ssj_ops@100% | 5,752,696 |
| ssj_ops@100% per JVM | 1,438,174 |
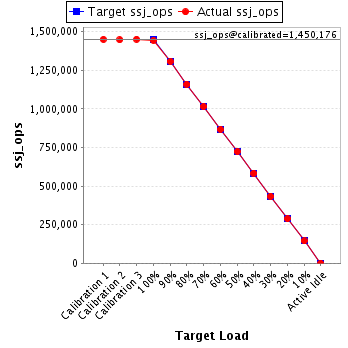
| Target Load | Actual Load | ssj_ops | |
|---|---|---|---|
| Target | Actual | ||
| Calibration 1 | 1,451,321 | ||
| Calibration 2 | 1,448,065 | ||
| Calibration 3 | 1,452,286 | ||
| ssj_ops@calibrated=1,450,176 | |||
| 100% | 99.6% | 1,450,176 | 1,444,183 |
| 90% | 90.2% | 1,305,158 | 1,308,534 |
| 80% | 80.0% | 1,160,141 | 1,159,794 |
| 70% | 70.1% | 1,015,123 | 1,016,218 |
| 60% | 59.9% | 870,105 | 868,678 |
| 50% | 49.9% | 725,088 | 723,535 |
| 40% | 40.2% | 580,070 | 583,042 |
| 30% | 30.0% | 435,053 | 434,333 |
| 20% | 19.8% | 290,035 | 287,258 |
| 10% | 10.0% | 145,018 | 144,602 |
| Active Idle | 0 | 0 | |
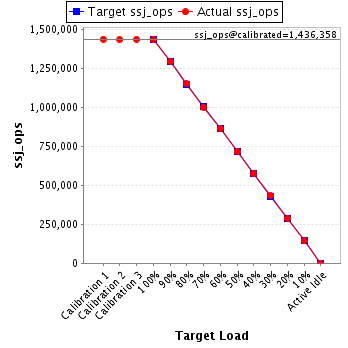
| Target Load | Actual Load | ssj_ops | |
|---|---|---|---|
| Target | Actual | ||
| Calibration 1 | 1,438,215 | ||
| Calibration 2 | 1,435,425 | ||
| Calibration 3 | 1,437,291 | ||
| ssj_ops@calibrated=1,436,358 | |||
| 100% | 99.8% | 1,436,358 | 1,433,372 |
| 90% | 90.2% | 1,292,722 | 1,295,020 |
| 80% | 80.1% | 1,149,086 | 1,150,783 |
| 70% | 69.8% | 1,005,451 | 1,002,809 |
| 60% | 60.0% | 861,815 | 862,437 |
| 50% | 49.9% | 718,179 | 716,632 |
| 40% | 40.1% | 574,543 | 576,375 |
| 30% | 30.1% | 430,907 | 432,367 |
| 20% | 20.1% | 287,272 | 289,171 |
| 10% | 10.0% | 143,636 | 143,482 |
| Active Idle | 0 | 0 | |
| Target Load | Actual Load | ssj_ops | |
|---|---|---|---|
| Target | Actual | ||
| Calibration 1 | 1,453,582 | ||
| Calibration 2 | 1,447,552 | ||
| Calibration 3 | 1,451,961 | ||
| ssj_ops@calibrated=1,449,756 | |||
| 100% | 99.9% | 1,449,756 | 1,448,131 |
| 90% | 90.0% | 1,304,781 | 1,304,809 |
| 80% | 80.0% | 1,159,805 | 1,160,161 |
| 70% | 70.0% | 1,014,829 | 1,015,347 |
| 60% | 60.1% | 869,854 | 872,001 |
| 50% | 50.4% | 724,878 | 730,764 |
| 40% | 40.2% | 579,903 | 582,500 |
| 30% | 30.0% | 434,927 | 434,772 |
| 20% | 20.0% | 289,951 | 289,461 |
| 10% | 10.0% | 144,976 | 145,308 |
| Active Idle | 0 | 0 | |

| Target Load | Actual Load | ssj_ops | |
|---|---|---|---|
| Target | Actual | ||
| Calibration 1 | 1,432,502 | ||
| Calibration 2 | 1,429,145 | ||
| Calibration 3 | 1,433,632 | ||
| ssj_ops@calibrated=1,431,388 | |||
| 100% | 99.7% | 1,431,388 | 1,427,010 |
| 90% | 90.0% | 1,288,249 | 1,288,519 |
| 80% | 79.8% | 1,145,111 | 1,142,613 |
| 70% | 69.9% | 1,001,972 | 1,000,732 |
| 60% | 60.1% | 858,833 | 859,560 |
| 50% | 50.1% | 715,694 | 717,534 |
| 40% | 40.1% | 572,555 | 573,988 |
| 30% | 30.0% | 429,416 | 428,811 |
| 20% | 20.0% | 286,278 | 286,549 |
| 10% | 10.1% | 143,139 | 144,467 |
| Active Idle | 0 | 0 | |
