SPECpower_ssj2008
Host 'NODE08' Performance Report
Copyright © 2007-2019 Standard Performance Evaluation Corporation
| Hewlett Packard Enterprise Synergy 480 Gen10 Compute Module | ssj_ops@100% = 5,750,359 ssj_ops@100% per JVM = 1,437,590 |
||||
| Test Sponsor: | Hewlett Packard Enterprise | SPEC License #: | 3 | Test Method: | Multi Node |
| Tested By: | Hewlett Packard Enterprise | Test Location: | Houston, TX, USA | Test Date: | Mar 26, 2019 |
| Hardware Availability: | Apr-2019 | Software Availability: | Mar-2019 | Publication: | May 8, 2019 |
| System Source: | Single Supplier | System Designation: | Server | Power Provisioning: | Line-powered |
| Target Load | Actual Load | ssj_ops | |
|---|---|---|---|
| Target | Actual | ||
| Calibration 1 | 5,768,011 | ||
| Calibration 2 | 5,760,107 | ||
| Calibration 3 | 5,766,783 | ||
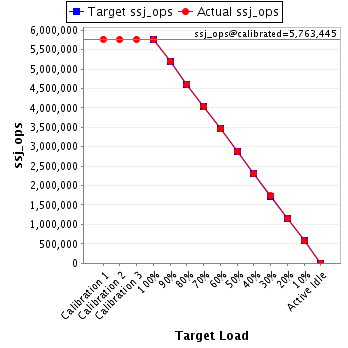
| ssj_ops@calibrated=5,763,445 | |||
| 100% | 99.8% | 5,763,445 | 5,750,359 |
| 90% | 90.1% | 5,187,101 | 5,193,680 |
| 80% | 80.0% | 4,610,756 | 4,611,266 |
| 70% | 70.0% | 4,034,412 | 4,035,008 |
| 60% | 60.0% | 3,458,067 | 3,457,607 |
| 50% | 50.0% | 2,881,723 | 2,882,920 |
| 40% | 40.0% | 2,305,378 | 2,304,910 |
| 30% | 30.1% | 1,729,034 | 1,732,490 |
| 20% | 20.0% | 1,152,689 | 1,151,485 |
| 10% | 10.0% | 576,345 | 575,828 |
| Active Idle | 0 | 0 | |
| Set Identifier: | SUT |
| Set Description: | System Under Test |
| # of Identical Nodes: | 9 |
| Comment: | SUT |
| Hardware | |
|---|---|
| Hardware Vendor: | Hewlett Packard Enterprise |
| Model: | Synergy 480 Gen10 Compute Module |
| Form Factor: | 7U |
| CPU Name: | Intel Xeon Platinum 8280 @ 2.70GHz (Intel Turbo Boost Technology up to 4.00 GHz) |
| CPU Characteristics: | 28-Core, 2.70 GHz, 38.5MB L3 Cache |
| CPU Frequency (MHz): | 2700 |
| CPU(s) Enabled: | 56 cores, 2 chips, 28 cores/chip |
| Hardware Threads: | 112 (2 / core) |
| CPU(s) Orderable: | 1,2 chips |
| Primary Cache: | 32 KB I + 32 KB D on chip per core |
| Secondary Cache: | 1 MB I+D on chip per core |
| Tertiary Cache: | 39424 KB I+D on chip per chip |
| Other Cache: | None |
| Memory Amount (GB): | 192 |
| # and size of DIMM: | 12 x 16384 MB |
| Memory Details: | 12 x 16GB 2Rx8 PC4-2933Y-R; slots 1, 3, 5, 8, 10 and 12 populated in each socket |
| Power Supply Quantity and Rating (W): | None |
| Power Supply Details: | N/A |
| Disk Drive: | 1 x HPE 240GB 6G SATA M.2 SSD (875488-B21) |
| Disk Controller: | HPE Smart Array S100i SR Gen10 |
| # and type of Network Interface Cards (NICs) Installed: | 1 x HPE Synergy 3820C 10/20Gb CNA |
| NICs Enabled in Firmware / OS / Connected: | 2/2/1 |
| Network Speed (Mbit): | 1000 |
| Keyboard: | None |
| Mouse: | None |
| Monitor: | None |
| Optical Drives: | No |
| Other Hardware: | H/S: Standard |
| Software | |
|---|---|
| Power Management: | Enabled (see SUT Notes) |
| Operating System (OS): | Windows Server 2012 R2 Datacenter |
| OS Version: | Version 6.3 (Build 9600) |
| Filesystem: | NTFS |
| JVM Vendor: | Oracle Corporation |
| JVM Version: | Oracle Java HotSpot(TM) 64-Bit Server VM (build 24.80-b11, mixed mode), version 1.7.0_80 |
| JVM Command-line Options: | -server -Xmn21000m -Xms24000m -Xmx24000m -XX:SurvivorRatio=1 -XX:TargetSurvivorRatio=99 -XX:AllocatePrefetchDistance=256 -XX:AllocatePrefetchLines=4 -XX:LoopUnrollLimit=45 -XX:InitialTenuringThreshold=12 -XX:MaxTenuringThreshold=15 -XX:ParallelGCThreads=28 -XX:InlineSmallCode=3900 -XX:MaxInlineSize=270 -XX:FreqInlineSize=2500 -XX:+AggressiveOpts -XX:+UseLargePages -XX:+UseParallelOldGC |
| JVM Affinity: | start /NODE [0,1,2,3] /AFFINITY [0xFFFFFFF] |
| JVM Instances: | 4 |
| JVM Initial Heap (MB): | 24000 |
| JVM Maximum Heap (MB): | 24000 |
| JVM Address Bits: | 64 |
| Boot Firmware Version: | I42 v2.00 (02/02/2019) |
| Management Firmware Version: | 1.40 Feb 05 2019 |
| Workload Version: | SSJ 1.2.10 |
| Director Location: | Controller |
| Other Software: | HPE Service Pack for ProLiant (SPP) Version: 2019.03.0, Microsoft Windows KB4056898, KB4338815 |
| JVM Instance | ssj_ops@100% |
|---|---|
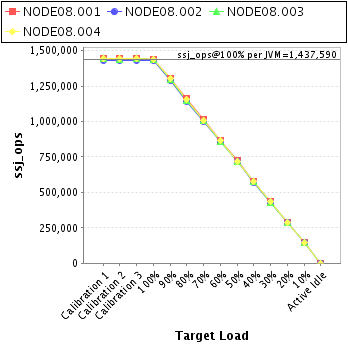
| NODE08.001 | 1,441,420 |
| NODE08.002 | 1,429,037 |
| NODE08.003 | 1,439,115 |
| NODE08.004 | 1,440,787 |
| ssj_ops@100% | 5,750,359 |
| ssj_ops@100% per JVM | 1,437,590 |
| Target Load | Actual Load | ssj_ops | |
|---|---|---|---|
| Target | Actual | ||
| Calibration 1 | 1,447,321 | ||
| Calibration 2 | 1,446,696 | ||
| Calibration 3 | 1,446,158 | ||
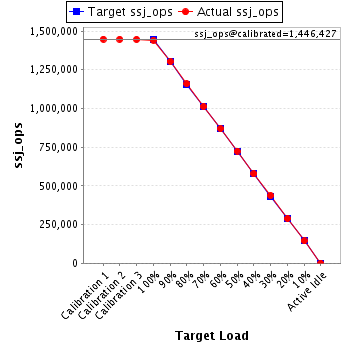
| ssj_ops@calibrated=1,446,427 | |||
| 100% | 99.7% | 1,446,427 | 1,441,420 |
| 90% | 90.1% | 1,301,784 | 1,303,253 |
| 80% | 80.2% | 1,157,141 | 1,159,326 |
| 70% | 70.0% | 1,012,499 | 1,012,990 |
| 60% | 60.1% | 867,856 | 869,051 |
| 50% | 50.1% | 723,213 | 724,719 |
| 40% | 39.9% | 578,571 | 577,636 |
| 30% | 30.3% | 433,928 | 437,575 |
| 20% | 19.9% | 289,285 | 287,943 |
| 10% | 10.0% | 144,643 | 144,368 |
| Active Idle | 0 | 0 | |
| Target Load | Actual Load | ssj_ops | |
|---|---|---|---|
| Target | Actual | ||
| Calibration 1 | 1,433,752 | ||
| Calibration 2 | 1,430,569 | ||
| Calibration 3 | 1,433,674 | ||
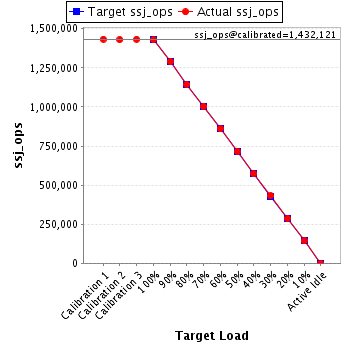
| ssj_ops@calibrated=1,432,121 | |||
| 100% | 99.8% | 1,432,121 | 1,429,037 |
| 90% | 90.1% | 1,288,909 | 1,290,297 |
| 80% | 79.9% | 1,145,697 | 1,144,847 |
| 70% | 70.0% | 1,002,485 | 1,002,602 |
| 60% | 60.0% | 859,273 | 859,984 |
| 50% | 50.0% | 716,061 | 715,787 |
| 40% | 40.0% | 572,848 | 572,246 |
| 30% | 30.1% | 429,636 | 431,433 |
| 20% | 20.0% | 286,424 | 286,358 |
| 10% | 10.0% | 143,212 | 143,499 |
| Active Idle | 0 | 0 | |
| Target Load | Actual Load | ssj_ops | |
|---|---|---|---|
| Target | Actual | ||
| Calibration 1 | 1,443,469 | ||
| Calibration 2 | 1,439,622 | ||
| Calibration 3 | 1,441,901 | ||
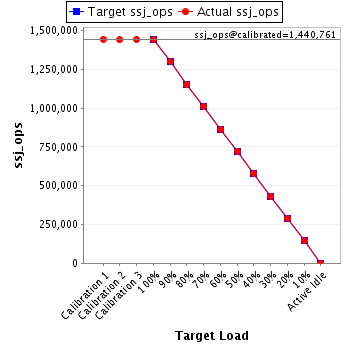
| ssj_ops@calibrated=1,440,761 | |||
| 100% | 99.9% | 1,440,761 | 1,439,115 |
| 90% | 90.1% | 1,296,685 | 1,298,111 |
| 80% | 79.8% | 1,152,609 | 1,149,553 |
| 70% | 70.1% | 1,008,533 | 1,009,297 |
| 60% | 59.8% | 864,457 | 862,249 |
| 50% | 50.1% | 720,381 | 721,273 |
| 40% | 40.1% | 576,305 | 577,327 |
| 30% | 29.9% | 432,228 | 430,824 |
| 20% | 20.0% | 288,152 | 287,625 |
| 10% | 10.0% | 144,076 | 143,955 |
| Active Idle | 0 | 0 | |
| Target Load | Actual Load | ssj_ops | |
|---|---|---|---|
| Target | Actual | ||
| Calibration 1 | 1,443,470 | ||
| Calibration 2 | 1,443,221 | ||
| Calibration 3 | 1,445,050 | ||
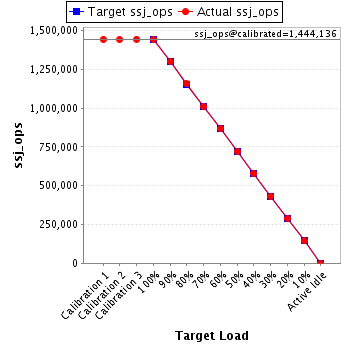
| ssj_ops@calibrated=1,444,136 | |||
| 100% | 99.8% | 1,444,136 | 1,440,787 |
| 90% | 90.2% | 1,299,722 | 1,302,019 |
| 80% | 80.2% | 1,155,309 | 1,157,540 |
| 70% | 69.9% | 1,010,895 | 1,010,119 |
| 60% | 60.0% | 866,481 | 866,323 |
| 50% | 49.9% | 722,068 | 721,141 |
| 40% | 40.0% | 577,654 | 577,701 |
| 30% | 30.0% | 433,241 | 432,658 |
| 20% | 20.1% | 288,827 | 289,559 |
| 10% | 10.0% | 144,414 | 144,006 |
| Active Idle | 0 | 0 | |