SPECpower_ssj2008
Host 'NODE06' Performance Report
Copyright © 2007-2019 Standard Performance Evaluation Corporation
| Hewlett Packard Enterprise Synergy 480 Gen10 Compute Module | ssj_ops@100% = 5,758,865 ssj_ops@100% per JVM = 1,439,716 |
||||
| Test Sponsor: | Hewlett Packard Enterprise | SPEC License #: | 3 | Test Method: | Multi Node |
| Tested By: | Hewlett Packard Enterprise | Test Location: | Houston, TX, USA | Test Date: | Mar 26, 2019 |
| Hardware Availability: | Apr-2019 | Software Availability: | Mar-2019 | Publication: | May 8, 2019 |
| System Source: | Single Supplier | System Designation: | Server | Power Provisioning: | Line-powered |
| Target Load | Actual Load | ssj_ops | |
|---|---|---|---|
| Target | Actual | ||
| Calibration 1 | 5,773,805 | ||
| Calibration 2 | 5,769,365 | ||
| Calibration 3 | 5,778,846 | ||
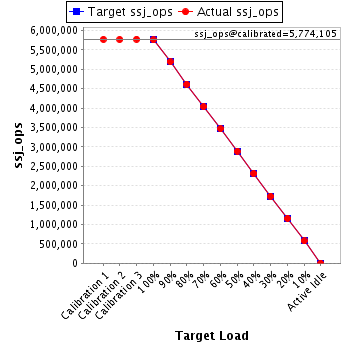
| ssj_ops@calibrated=5,774,105 | |||
| 100% | 99.7% | 5,774,105 | 5,758,865 |
| 90% | 89.9% | 5,196,695 | 5,192,632 |
| 80% | 79.9% | 4,619,284 | 4,614,709 |
| 70% | 70.0% | 4,041,874 | 4,039,712 |
| 60% | 60.0% | 3,464,463 | 3,464,989 |
| 50% | 50.1% | 2,887,053 | 2,891,196 |
| 40% | 40.0% | 2,309,642 | 2,311,367 |
| 30% | 30.0% | 1,732,232 | 1,732,852 |
| 20% | 20.0% | 1,154,821 | 1,156,294 |
| 10% | 10.0% | 577,411 | 574,851 |
| Active Idle | 0 | 0 | |
| Set Identifier: | SUT |
| Set Description: | System Under Test |
| # of Identical Nodes: | 9 |
| Comment: | SUT |
| Hardware | |
|---|---|
| Hardware Vendor: | Hewlett Packard Enterprise |
| Model: | Synergy 480 Gen10 Compute Module |
| Form Factor: | 7U |
| CPU Name: | Intel Xeon Platinum 8280 @ 2.70GHz (Intel Turbo Boost Technology up to 4.00 GHz) |
| CPU Characteristics: | 28-Core, 2.70 GHz, 38.5MB L3 Cache |
| CPU Frequency (MHz): | 2700 |
| CPU(s) Enabled: | 56 cores, 2 chips, 28 cores/chip |
| Hardware Threads: | 112 (2 / core) |
| CPU(s) Orderable: | 1,2 chips |
| Primary Cache: | 32 KB I + 32 KB D on chip per core |
| Secondary Cache: | 1 MB I+D on chip per core |
| Tertiary Cache: | 39424 KB I+D on chip per chip |
| Other Cache: | None |
| Memory Amount (GB): | 192 |
| # and size of DIMM: | 12 x 16384 MB |
| Memory Details: | 12 x 16GB 2Rx8 PC4-2933Y-R; slots 1, 3, 5, 8, 10 and 12 populated in each socket |
| Power Supply Quantity and Rating (W): | None |
| Power Supply Details: | N/A |
| Disk Drive: | 1 x HPE 240GB 6G SATA M.2 SSD (875488-B21) |
| Disk Controller: | HPE Smart Array S100i SR Gen10 |
| # and type of Network Interface Cards (NICs) Installed: | 1 x HPE Synergy 3820C 10/20Gb CNA |
| NICs Enabled in Firmware / OS / Connected: | 2/2/1 |
| Network Speed (Mbit): | 1000 |
| Keyboard: | None |
| Mouse: | None |
| Monitor: | None |
| Optical Drives: | No |
| Other Hardware: | H/S: Standard |
| Software | |
|---|---|
| Power Management: | Enabled (see SUT Notes) |
| Operating System (OS): | Windows Server 2012 R2 Datacenter |
| OS Version: | Version 6.3 (Build 9600) |
| Filesystem: | NTFS |
| JVM Vendor: | Oracle Corporation |
| JVM Version: | Oracle Java HotSpot(TM) 64-Bit Server VM (build 24.80-b11, mixed mode), version 1.7.0_80 |
| JVM Command-line Options: | -server -Xmn21000m -Xms24000m -Xmx24000m -XX:SurvivorRatio=1 -XX:TargetSurvivorRatio=99 -XX:AllocatePrefetchDistance=256 -XX:AllocatePrefetchLines=4 -XX:LoopUnrollLimit=45 -XX:InitialTenuringThreshold=12 -XX:MaxTenuringThreshold=15 -XX:ParallelGCThreads=28 -XX:InlineSmallCode=3900 -XX:MaxInlineSize=270 -XX:FreqInlineSize=2500 -XX:+AggressiveOpts -XX:+UseLargePages -XX:+UseParallelOldGC |
| JVM Affinity: | start /NODE [0,1,2,3] /AFFINITY [0xFFFFFFF] |
| JVM Instances: | 4 |
| JVM Initial Heap (MB): | 24000 |
| JVM Maximum Heap (MB): | 24000 |
| JVM Address Bits: | 64 |
| Boot Firmware Version: | I42 v2.00 (02/02/2019) |
| Management Firmware Version: | 1.40 Feb 05 2019 |
| Workload Version: | SSJ 1.2.10 |
| Director Location: | Controller |
| Other Software: | HPE Service Pack for ProLiant (SPP) Version: 2019.03.0, Microsoft Windows KB4056898, KB4338815 |
| JVM Instance | ssj_ops@100% |
|---|---|
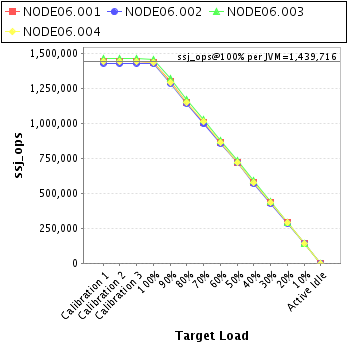
| NODE06.001 | 1,437,660 |
| NODE06.002 | 1,426,103 |
| NODE06.003 | 1,458,333 |
| NODE06.004 | 1,436,769 |
| ssj_ops@100% | 5,758,865 |
| ssj_ops@100% per JVM | 1,439,716 |
| Target Load | Actual Load | ssj_ops | |
|---|---|---|---|
| Target | Actual | ||
| Calibration 1 | 1,440,642 | ||
| Calibration 2 | 1,439,498 | ||
| Calibration 3 | 1,442,841 | ||
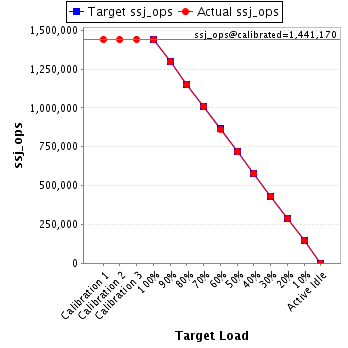
| ssj_ops@calibrated=1,441,170 | |||
| 100% | 99.8% | 1,441,170 | 1,437,660 |
| 90% | 89.9% | 1,297,053 | 1,296,058 |
| 80% | 79.8% | 1,152,936 | 1,149,473 |
| 70% | 70.0% | 1,008,819 | 1,008,681 |
| 60% | 59.9% | 864,702 | 862,692 |
| 50% | 50.0% | 720,585 | 720,298 |
| 40% | 40.1% | 576,468 | 578,462 |
| 30% | 30.0% | 432,351 | 432,263 |
| 20% | 20.0% | 288,234 | 288,785 |
| 10% | 10.0% | 144,117 | 144,525 |
| Active Idle | 0 | 0 | |
| Target Load | Actual Load | ssj_ops | |
|---|---|---|---|
| Target | Actual | ||
| Calibration 1 | 1,430,146 | ||
| Calibration 2 | 1,428,879 | ||
| Calibration 3 | 1,430,411 | ||
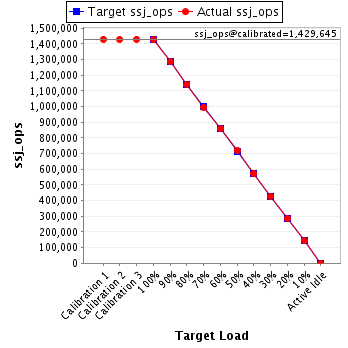
| ssj_ops@calibrated=1,429,645 | |||
| 100% | 99.8% | 1,429,645 | 1,426,103 |
| 90% | 90.0% | 1,286,681 | 1,286,987 |
| 80% | 80.0% | 1,143,716 | 1,143,083 |
| 70% | 69.7% | 1,000,752 | 996,266 |
| 60% | 60.0% | 857,787 | 857,770 |
| 50% | 50.3% | 714,823 | 718,830 |
| 40% | 39.9% | 571,858 | 570,278 |
| 30% | 29.9% | 428,894 | 428,112 |
| 20% | 20.1% | 285,929 | 287,124 |
| 10% | 10.0% | 142,965 | 142,717 |
| Active Idle | 0 | 0 | |
| Target Load | Actual Load | ssj_ops | |
|---|---|---|---|
| Target | Actual | ||
| Calibration 1 | 1,461,884 | ||
| Calibration 2 | 1,463,037 | ||
| Calibration 3 | 1,465,174 | ||
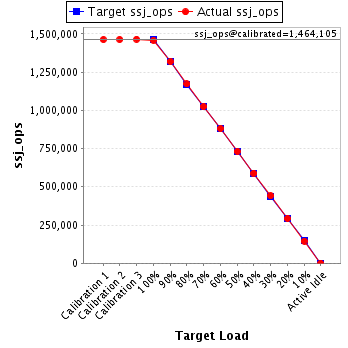
| ssj_ops@calibrated=1,464,105 | |||
| 100% | 99.6% | 1,464,105 | 1,458,333 |
| 90% | 90.1% | 1,317,695 | 1,318,891 |
| 80% | 80.1% | 1,171,284 | 1,172,200 |
| 70% | 70.0% | 1,024,874 | 1,024,452 |
| 60% | 60.1% | 878,463 | 880,389 |
| 50% | 50.0% | 732,053 | 731,628 |
| 40% | 40.2% | 585,642 | 588,283 |
| 30% | 30.1% | 439,232 | 440,344 |
| 20% | 20.0% | 292,821 | 292,311 |
| 10% | 9.9% | 146,411 | 144,732 |
| Active Idle | 0 | 0 | |
| Target Load | Actual Load | ssj_ops | |
|---|---|---|---|
| Target | Actual | ||
| Calibration 1 | 1,441,132 | ||
| Calibration 2 | 1,437,951 | ||
| Calibration 3 | 1,440,420 | ||
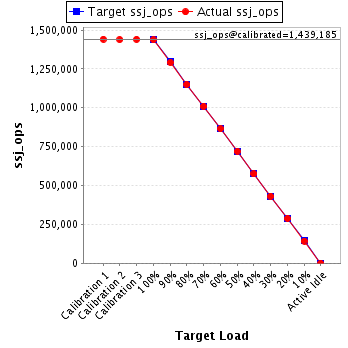
| ssj_ops@calibrated=1,439,185 | |||
| 100% | 99.8% | 1,439,185 | 1,436,769 |
| 90% | 89.7% | 1,295,267 | 1,290,696 |
| 80% | 79.9% | 1,151,348 | 1,149,954 |
| 70% | 70.2% | 1,007,430 | 1,010,313 |
| 60% | 60.0% | 863,511 | 864,138 |
| 50% | 50.1% | 719,593 | 720,440 |
| 40% | 39.9% | 575,674 | 574,344 |
| 30% | 30.0% | 431,756 | 432,133 |
| 20% | 20.0% | 287,837 | 288,073 |
| 10% | 9.9% | 143,919 | 142,877 |
| Active Idle | 0 | 0 | |