SPECpower_ssj2008
Host 'NODE03' Performance Report
Copyright © 2007-2019 Standard Performance Evaluation Corporation
| Hewlett Packard Enterprise Synergy 480 Gen10 Compute Module | ssj_ops@100% = 5,760,807 ssj_ops@100% per JVM = 1,440,202 |
||||
| Test Sponsor: | Hewlett Packard Enterprise | SPEC License #: | 3 | Test Method: | Multi Node |
| Tested By: | Hewlett Packard Enterprise | Test Location: | Houston, TX, USA | Test Date: | Mar 26, 2019 |
| Hardware Availability: | Apr-2019 | Software Availability: | Mar-2019 | Publication: | May 8, 2019 |
| System Source: | Single Supplier | System Designation: | Server | Power Provisioning: | Line-powered |
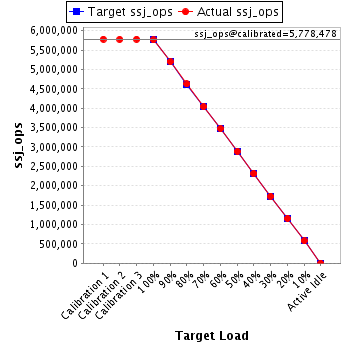
| Target Load | Actual Load | ssj_ops | |
|---|---|---|---|
| Target | Actual | ||
| Calibration 1 | 5,781,331 | ||
| Calibration 2 | 5,776,133 | ||
| Calibration 3 | 5,780,823 | ||
| ssj_ops@calibrated=5,778,478 | |||
| 100% | 99.7% | 5,778,478 | 5,760,807 |
| 90% | 90.0% | 5,200,630 | 5,199,530 |
| 80% | 80.0% | 4,622,782 | 4,625,326 |
| 70% | 69.9% | 4,044,935 | 4,039,422 |
| 60% | 60.0% | 3,467,087 | 3,469,631 |
| 50% | 50.0% | 2,889,239 | 2,887,636 |
| 40% | 40.0% | 2,311,391 | 2,310,925 |
| 30% | 30.0% | 1,733,543 | 1,730,843 |
| 20% | 20.0% | 1,155,696 | 1,153,898 |
| 10% | 10.0% | 577,848 | 578,425 |
| Active Idle | 0 | 0 | |
| Set Identifier: | SUT |
| Set Description: | System Under Test |
| # of Identical Nodes: | 9 |
| Comment: | SUT |
| Hardware | |
|---|---|
| Hardware Vendor: | Hewlett Packard Enterprise |
| Model: | Synergy 480 Gen10 Compute Module |
| Form Factor: | 7U |
| CPU Name: | Intel Xeon Platinum 8280 @ 2.70GHz (Intel Turbo Boost Technology up to 4.00 GHz) |
| CPU Characteristics: | 28-Core, 2.70 GHz, 38.5MB L3 Cache |
| CPU Frequency (MHz): | 2700 |
| CPU(s) Enabled: | 56 cores, 2 chips, 28 cores/chip |
| Hardware Threads: | 112 (2 / core) |
| CPU(s) Orderable: | 1,2 chips |
| Primary Cache: | 32 KB I + 32 KB D on chip per core |
| Secondary Cache: | 1 MB I+D on chip per core |
| Tertiary Cache: | 39424 KB I+D on chip per chip |
| Other Cache: | None |
| Memory Amount (GB): | 192 |
| # and size of DIMM: | 12 x 16384 MB |
| Memory Details: | 12 x 16GB 2Rx8 PC4-2933Y-R; slots 1, 3, 5, 8, 10 and 12 populated in each socket |
| Power Supply Quantity and Rating (W): | None |
| Power Supply Details: | N/A |
| Disk Drive: | 1 x HPE 240GB 6G SATA M.2 SSD (875488-B21) |
| Disk Controller: | HPE Smart Array S100i SR Gen10 |
| # and type of Network Interface Cards (NICs) Installed: | 1 x HPE Synergy 3820C 10/20Gb CNA |
| NICs Enabled in Firmware / OS / Connected: | 2/2/1 |
| Network Speed (Mbit): | 1000 |
| Keyboard: | None |
| Mouse: | None |
| Monitor: | None |
| Optical Drives: | No |
| Other Hardware: | H/S: Standard |
| Software | |
|---|---|
| Power Management: | Enabled (see SUT Notes) |
| Operating System (OS): | Windows Server 2012 R2 Datacenter |
| OS Version: | Version 6.3 (Build 9600) |
| Filesystem: | NTFS |
| JVM Vendor: | Oracle Corporation |
| JVM Version: | Oracle Java HotSpot(TM) 64-Bit Server VM (build 24.80-b11, mixed mode), version 1.7.0_80 |
| JVM Command-line Options: | -server -Xmn21000m -Xms24000m -Xmx24000m -XX:SurvivorRatio=1 -XX:TargetSurvivorRatio=99 -XX:AllocatePrefetchDistance=256 -XX:AllocatePrefetchLines=4 -XX:LoopUnrollLimit=45 -XX:InitialTenuringThreshold=12 -XX:MaxTenuringThreshold=15 -XX:ParallelGCThreads=28 -XX:InlineSmallCode=3900 -XX:MaxInlineSize=270 -XX:FreqInlineSize=2500 -XX:+AggressiveOpts -XX:+UseLargePages -XX:+UseParallelOldGC |
| JVM Affinity: | start /NODE [0,1,2,3] /AFFINITY [0xFFFFFFF] |
| JVM Instances: | 4 |
| JVM Initial Heap (MB): | 24000 |
| JVM Maximum Heap (MB): | 24000 |
| JVM Address Bits: | 64 |
| Boot Firmware Version: | I42 v2.00 (02/02/2019) |
| Management Firmware Version: | 1.40 Feb 05 2019 |
| Workload Version: | SSJ 1.2.10 |
| Director Location: | Controller |
| Other Software: | HPE Service Pack for ProLiant (SPP) Version: 2019.03.0, Microsoft Windows KB4056898, KB4338815 |
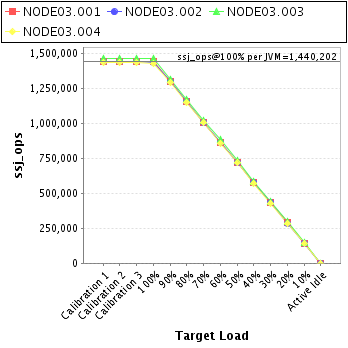
| JVM Instance | ssj_ops@100% |
|---|---|
| NODE03.001 | 1,437,407 |
| NODE03.002 | 1,436,339 |
| NODE03.003 | 1,459,669 |
| NODE03.004 | 1,427,391 |
| ssj_ops@100% | 5,760,807 |
| ssj_ops@100% per JVM | 1,440,202 |
| Target Load | Actual Load | ssj_ops | |
|---|---|---|---|
| Target | Actual | ||
| Calibration 1 | 1,442,091 | ||
| Calibration 2 | 1,439,297 | ||
| Calibration 3 | 1,441,942 | ||
| ssj_ops@calibrated=1,440,619 | |||
| 100% | 99.8% | 1,440,619 | 1,437,407 |
| 90% | 90.1% | 1,296,558 | 1,297,425 |
| 80% | 80.2% | 1,152,496 | 1,155,782 |
| 70% | 69.9% | 1,008,434 | 1,006,512 |
| 60% | 60.1% | 864,372 | 865,321 |
| 50% | 50.0% | 720,310 | 720,880 |
| 40% | 40.0% | 576,248 | 576,117 |
| 30% | 30.0% | 432,186 | 432,017 |
| 20% | 20.0% | 288,124 | 287,639 |
| 10% | 10.0% | 144,062 | 144,227 |
| Active Idle | 0 | 0 | |

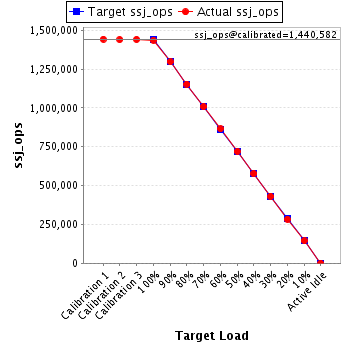
| Target Load | Actual Load | ssj_ops | |
|---|---|---|---|
| Target | Actual | ||
| Calibration 1 | 1,442,742 | ||
| Calibration 2 | 1,439,708 | ||
| Calibration 3 | 1,441,457 | ||
| ssj_ops@calibrated=1,440,582 | |||
| 100% | 99.7% | 1,440,582 | 1,436,339 |
| 90% | 90.0% | 1,296,524 | 1,297,194 |
| 80% | 80.0% | 1,152,466 | 1,153,107 |
| 70% | 70.0% | 1,008,408 | 1,008,077 |
| 60% | 60.1% | 864,349 | 865,098 |
| 50% | 50.0% | 720,291 | 720,366 |
| 40% | 40.0% | 576,233 | 576,342 |
| 30% | 29.9% | 432,175 | 431,113 |
| 20% | 19.7% | 288,116 | 284,378 |
| 10% | 10.0% | 144,058 | 144,566 |
| Active Idle | 0 | 0 | |
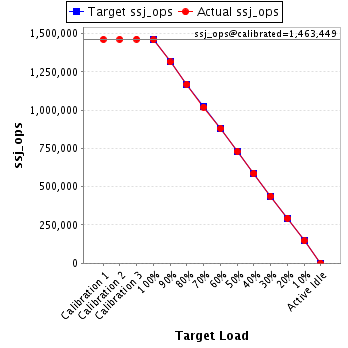
| Target Load | Actual Load | ssj_ops | |
|---|---|---|---|
| Target | Actual | ||
| Calibration 1 | 1,461,664 | ||
| Calibration 2 | 1,462,742 | ||
| Calibration 3 | 1,464,156 | ||
| ssj_ops@calibrated=1,463,449 | |||
| 100% | 99.7% | 1,463,449 | 1,459,669 |
| 90% | 89.9% | 1,317,104 | 1,315,200 |
| 80% | 79.9% | 1,170,759 | 1,168,979 |
| 70% | 69.7% | 1,024,414 | 1,020,565 |
| 60% | 60.2% | 878,069 | 880,953 |
| 50% | 49.9% | 731,724 | 730,270 |
| 40% | 40.0% | 585,379 | 585,961 |
| 30% | 30.0% | 439,035 | 439,436 |
| 20% | 20.2% | 292,690 | 295,274 |
| 10% | 10.1% | 146,345 | 147,163 |
| Active Idle | 0 | 0 | |
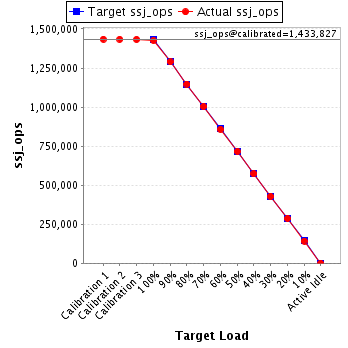
| Target Load | Actual Load | ssj_ops | |
|---|---|---|---|
| Target | Actual | ||
| Calibration 1 | 1,434,834 | ||
| Calibration 2 | 1,434,386 | ||
| Calibration 3 | 1,433,269 | ||
| ssj_ops@calibrated=1,433,827 | |||
| 100% | 99.6% | 1,433,827 | 1,427,391 |
| 90% | 89.9% | 1,290,445 | 1,289,711 |
| 80% | 80.0% | 1,147,062 | 1,147,458 |
| 70% | 70.0% | 1,003,679 | 1,004,268 |
| 60% | 59.9% | 860,296 | 858,259 |
| 50% | 49.9% | 716,914 | 716,120 |
| 40% | 39.9% | 573,531 | 572,505 |
| 30% | 29.9% | 430,148 | 428,278 |
| 20% | 20.0% | 286,765 | 286,607 |
| 10% | 9.9% | 143,383 | 142,468 |
| Active Idle | 0 | 0 | |