SPECpower_ssj2008
Aggregate Performance Report
Copyright © 2007-2019 Standard Performance Evaluation Corporation
| Hewlett Packard Enterprise Synergy 480 Gen10 Compute Module | ssj_ops@100% = 23,118,220 ssj_ops@100% per Host = 5,779,555 ssj_ops@100% per JVM = 1,444,889 |
||||
| Test Sponsor: | Hewlett Packard Enterprise | SPEC License #: | 3 | Test Method: | Multi Node |
| Tested By: | Hewlett Packard Enterprise | Test Location: | Houston, TX, USA | Test Date: | Mar 27, 2019 |
| Hardware Availability: | Apr-2019 | Software Availability: | Mar-2019 | Publication: | May 8, 2019 |
| System Source: | Single Supplier | System Designation: | Server | Power Provisioning: | Line-powered |
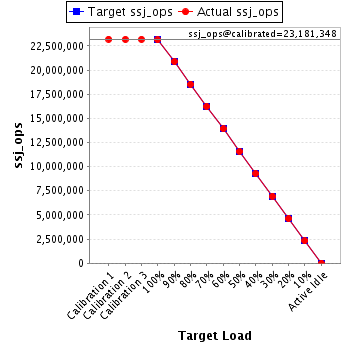
| Target Load | Actual Load | ssj_ops | |
|---|---|---|---|
| Target | Actual | ||
| Calibration 1 | 23,193,283 | ||
| Calibration 2 | 23,173,482 | ||
| Calibration 3 | 23,189,213 | ||
| ssj_ops@calibrated=23,181,348 | |||
| 100% | 99.7% | 23,181,348 | 23,118,220 |
| 90% | 90.0% | 20,863,213 | 20,874,787 |
| 80% | 80.0% | 18,545,078 | 18,536,987 |
| 70% | 70.0% | 16,226,943 | 16,232,502 |
| 60% | 60.0% | 13,908,809 | 13,916,331 |
| 50% | 49.9% | 11,590,674 | 11,577,871 |
| 40% | 40.0% | 9,272,539 | 9,274,092 |
| 30% | 30.0% | 6,954,404 | 6,952,125 |
| 20% | 20.0% | 4,636,270 | 4,628,592 |
| 10% | 10.0% | 2,318,135 | 2,313,897 |
| Active Idle | 0 | 0 | |
| # of Nodes | # of Chips | # of Cores | # of Threads | Total RAM (GB) | # of OS Images | # of JVM Instances |
|---|---|---|---|---|---|---|
| 4 | 8 | 224 | 448 | 768 | 4 | 16 |
| Set Identifier: | SUT |
| Set Description: | System Under Test |
| # of Identical Nodes: | 4 |
| Comment: | SUT |
| Hardware per Node | |
|---|---|
| Hardware Vendor: | Hewlett Packard Enterprise |
| Model: | Synergy 480 Gen10 Compute Module |
| Form Factor: | 7U |
| CPU Name: | Intel Xeon Platinum 8280 @ 2.70GHz (Intel Turbo Boost Technology up to 4.00 GHz) |
| CPU Characteristics: | 28-Core, 2.70 GHz, 38.5MB L3 Cache |
| CPU Frequency (MHz): | 2700 |
| CPU(s) Enabled: | 56 cores, 2 chips, 28 cores/chip |
| Hardware Threads: | 112 (2 / core) |
| CPU(s) Orderable: | 1,2 chips |
| Primary Cache: | 32 KB I + 32 KB D on chip per core |
| Secondary Cache: | 1 MB I+D on chip per core |
| Tertiary Cache: | 39424 KB I+D on chip per chip |
| Other Cache: | None |
| Memory Amount (GB): | 192 |
| # and size of DIMM: | 12 x 16384 MB |
| Memory Details: | 12 x 16GB 2Rx8 PC4-2933Y-R; slots 1, 3, 5, 8, 10 and 12 populated in each socket |
| Power Supply Quantity and Rating (W): | None |
| Power Supply Details: | N/A |
| Disk Drive: | 1 x HPE 240GB 6G SATA M.2 SSD (875488-B21) |
| Disk Controller: | HPE Smart Array S100i SR Gen10 |
| # and type of Network Interface Cards (NICs) Installed: | 1 x HPE Synergy 3820C 10/20Gb CNA |
| NICs Enabled in Firmware / OS / Connected: | 2/2/1 |
| Network Speed (Mbit): | 1000 |
| Keyboard: | None |
| Mouse: | None |
| Monitor: | None |
| Optical Drives: | No |
| Other Hardware: | H/S: Standard |
| Software per Node | |
|---|---|
| Power Management: | Enabled (see SUT Notes) |
| Operating System (OS): | Windows Server 2012 R2 Datacenter |
| OS Version: | Version 6.3 (Build 9600) |
| Filesystem: | NTFS |
| JVM Vendor: | Oracle Corporation |
| JVM Version: | Oracle Java HotSpot(TM) 64-Bit Server VM (build 24.80-b11, mixed mode), version 1.7.0_80 |
| JVM Command-line Options: | -server -Xmn21000m -Xms24000m -Xmx24000m -XX:SurvivorRatio=1 -XX:TargetSurvivorRatio=99 -XX:AllocatePrefetchDistance=256 -XX:AllocatePrefetchLines=4 -XX:LoopUnrollLimit=45 -XX:InitialTenuringThreshold=12 -XX:MaxTenuringThreshold=15 -XX:ParallelGCThreads=28 -XX:InlineSmallCode=3900 -XX:MaxInlineSize=270 -XX:FreqInlineSize=2500 -XX:+AggressiveOpts -XX:+UseLargePages -XX:+UseParallelOldGC |
| JVM Affinity: | start /NODE [0,1,2,3] /AFFINITY [0xFFFFFFF] |
| JVM Instances: | 4 |
| JVM Initial Heap (MB): | 24000 |
| JVM Maximum Heap (MB): | 24000 |
| JVM Address Bits: | 64 |
| Boot Firmware Version: | I42 v2.00 (02/02/2019) |
| Management Firmware Version: | 1.40 Feb 05 2019 |
| Workload Version: | SSJ 1.2.10 |
| Director Location: | Controller |
| Other Software: | HPE Service Pack for ProLiant (SPP) Version: 2019.03.0, Microsoft Windows KB4056898, KB4338815 |
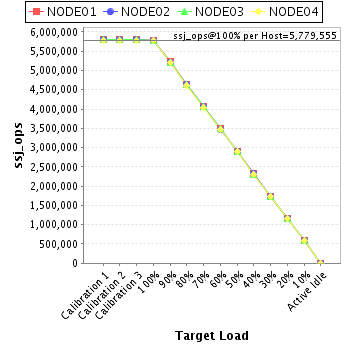
| Host | ssj_ops@100% |
|---|---|
| NODE01 | 5,790,203 |
| NODE02 | 5,780,358 |
| NODE03 | 5,779,198 |
| NODE04 | 5,768,461 |
| ssj_ops@100% | 23,118,220 |
| ssj_ops@100% per Host | 5,779,555 |
| ssj_ops@100% per JVM | 1,444,889 |
| Target Load | Actual Load | ssj_ops | |
|---|---|---|---|
| Target | Actual | ||
| Calibration 1 | 5,812,567 | ||
| Calibration 2 | 5,803,902 | ||
| Calibration 3 | 5,810,742 | ||
| ssj_ops@calibrated=5,807,322 | |||
| 100% | 99.7% | 5,807,322 | 5,790,203 |
| 90% | 90.1% | 5,226,590 | 5,231,064 |
| 80% | 79.9% | 4,645,858 | 4,638,827 |
| 70% | 70.0% | 4,065,126 | 4,067,734 |
| 60% | 60.0% | 3,484,393 | 3,485,037 |
| 50% | 49.9% | 2,903,661 | 2,897,435 |
| 40% | 40.0% | 2,322,929 | 2,325,725 |
| 30% | 30.0% | 1,742,197 | 1,742,619 |
| 20% | 20.0% | 1,161,464 | 1,159,804 |
| 10% | 10.0% | 580,732 | 578,663 |
| Active Idle | 0 | 0 | |
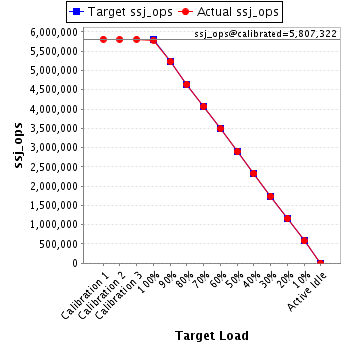
| Target Load | Actual Load | ssj_ops | |
|---|---|---|---|
| Target | Actual | ||
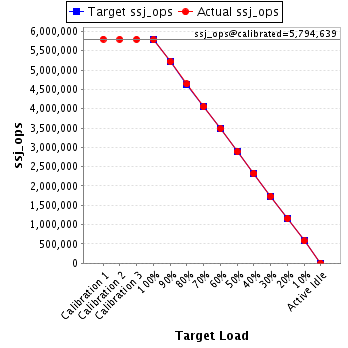
| Calibration 1 | 5,799,291 | ||
| Calibration 2 | 5,794,228 | ||
| Calibration 3 | 5,795,051 | ||
| ssj_ops@calibrated=5,794,639 | |||
| 100% | 99.8% | 5,794,639 | 5,780,358 |
| 90% | 90.1% | 5,215,175 | 5,218,657 |
| 80% | 80.1% | 4,635,711 | 4,640,149 |
| 70% | 70.0% | 4,056,247 | 4,054,153 |
| 60% | 60.1% | 3,476,783 | 3,480,280 |
| 50% | 49.8% | 2,897,320 | 2,887,667 |
| 40% | 40.1% | 2,317,856 | 2,321,476 |
| 30% | 30.0% | 1,738,392 | 1,737,206 |
| 20% | 20.0% | 1,158,928 | 1,158,013 |
| 10% | 10.0% | 579,464 | 577,814 |
| Active Idle | 0 | 0 | |
| Target Load | Actual Load | ssj_ops | |
|---|---|---|---|
| Target | Actual | ||
| Calibration 1 | 5,798,739 | ||
| Calibration 2 | 5,794,670 | ||
| Calibration 3 | 5,798,523 | ||
| ssj_ops@calibrated=5,796,597 | |||
| 100% | 99.7% | 5,796,597 | 5,779,198 |
| 90% | 90.0% | 5,216,937 | 5,218,026 |
| 80% | 80.0% | 4,637,277 | 4,636,733 |
| 70% | 70.1% | 4,057,618 | 4,063,284 |
| 60% | 60.1% | 3,477,958 | 3,484,201 |
| 50% | 50.0% | 2,898,298 | 2,897,165 |
| 40% | 39.9% | 2,318,639 | 2,313,711 |
| 30% | 29.9% | 1,738,979 | 1,735,003 |
| 20% | 19.9% | 1,159,319 | 1,155,445 |
| 10% | 10.0% | 579,660 | 579,919 |
| Active Idle | 0 | 0 | |

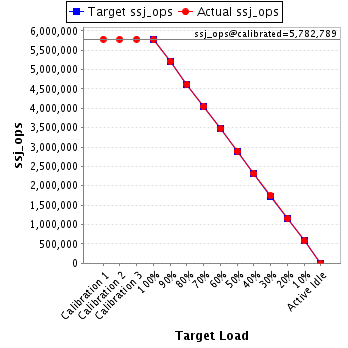
| Target Load | Actual Load | ssj_ops | |
|---|---|---|---|
| Target | Actual | ||
| Calibration 1 | 5,782,685 | ||
| Calibration 2 | 5,780,682 | ||
| Calibration 3 | 5,784,897 | ||
| ssj_ops@calibrated=5,782,789 | |||
| 100% | 99.8% | 5,782,789 | 5,768,461 |
| 90% | 90.0% | 5,204,511 | 5,207,039 |
| 80% | 79.9% | 4,626,232 | 4,621,279 |
| 70% | 70.0% | 4,047,953 | 4,047,332 |
| 60% | 60.0% | 3,469,674 | 3,466,813 |
| 50% | 50.1% | 2,891,395 | 2,895,604 |
| 40% | 40.0% | 2,313,116 | 2,313,179 |
| 30% | 30.0% | 1,734,837 | 1,737,297 |
| 20% | 20.0% | 1,156,558 | 1,155,331 |
| 10% | 10.0% | 578,279 | 577,500 |
| Active Idle | 0 | 0 | |