| Target Load |
Actual Load |
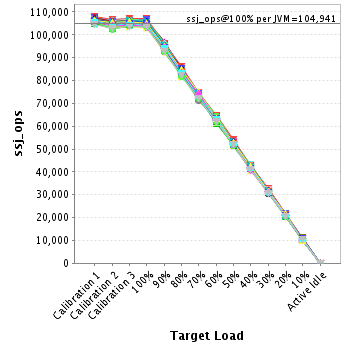
ssj_ops |
| Target |
Actual |
| Calibration 1 |
|
|
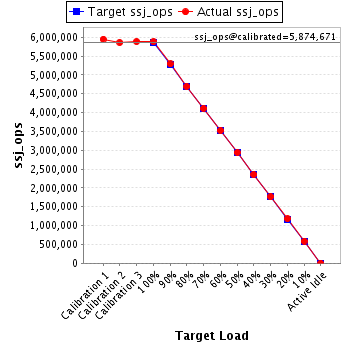
5,950,076 |
| Calibration 2 |
|
|
5,862,966 |
| Calibration 3 |
|
|
5,886,375 |
| ssj_ops@calibrated=5,874,671 |
| 100% |
100.0% |
5,874,671 |
5,876,718 |
| 90% |
90.1% |
5,287,204 |
5,291,447 |
| 80% |
80.0% |
4,699,736 |
4,697,239 |
| 70% |
70.0% |
4,112,269 |
4,114,756 |
| 60% |
60.0% |
3,524,802 |
3,523,892 |
| 50% |
50.0% |
2,937,335 |
2,939,536 |
| 40% |
40.0% |
2,349,868 |
2,352,679 |
| 30% |
30.0% |
1,762,401 |
1,762,859 |
| 20% |
20.1% |
1,174,934 |
1,178,476 |
| 10% |
10.0% |
587,467 |
587,940 |
| Active Idle |
|
0 |
0 |
| Hardware |
| Hardware Vendor: |
Huawei Technologies Co., Ltd |
| Model: |
Fusion Server 2288H V5 |
| Form Factor: |
2U |
| CPU Name: |
Intel Xeon Platinum 8280 |
| CPU Characteristics: |
28-Core, 2.7GHz, 38.5MB L3 Cache |
| CPU Frequency (MHz): |
2700 |
| CPU(s) Enabled: |
56 cores, 2 chips, 28 cores/chip |
| Hardware Threads: |
112 (2 / core) |
| CPU(s) Orderable: |
1,2 chips |
| Primary Cache: |
32 KB I + 32 KB D on chip per core |
| Secondary Cache: |
1 MB I+D on chip per core |
| Tertiary Cache: |
39424 KB I+D on chip per chip |
| Other Cache: |
None |
| Memory Amount (GB): |
192 |
| # and size of DIMM: |
12 x 16 GB |
| Memory Details: |
12 x 16GB 2Rx8 PC4-2933Y ECC RDIMM;slots DIMM000, DIMM010, DIMM020, DIMM030,DIMM040, DIMM050, DIMM100, DIMM110, DIMM120, DIMM130, DIMM140, and DIMM150 populated |
| Power Supply Quantity and Rating (W): |
1 x 550 |
| Power Supply Details: |
Huawei P/N 02312DEP |
| Disk Drive: |
1 x 960GB SSD 2.5" SATA Huawei P/N 02312DXT |
| Disk Controller: |
Integrated SATA controller |
| # and type of Network Interface Cards (NICs) Installed: |
LOM with 2 x 10GbE + 2 x GbE Intel X722 Ethernet controller |
| NICs Enabled in Firmware / OS / Connected: |
4/4/1 |
| Network Speed (Mbit): |
1000 |
| Keyboard: |
None |
| Mouse: |
None |
| Monitor: |
None |
| Optical Drives: |
No |
| Other Hardware: |
None |
| JVM Instance |
ssj_ops@100% |
| localhost.localdomain.001 |
105,154 |
| localhost.localdomain.002 |
106,515 |
| localhost.localdomain.003 |
104,540 |
| localhost.localdomain.004 |
106,109 |
| localhost.localdomain.005 |
104,535 |
| localhost.localdomain.006 |
106,624 |
| localhost.localdomain.007 |
105,411 |
| localhost.localdomain.008 |
106,011 |
| localhost.localdomain.009 |
105,577 |
| localhost.localdomain.010 |
104,071 |
| localhost.localdomain.011 |
103,758 |
| localhost.localdomain.012 |
105,428 |
| localhost.localdomain.013 |
104,699 |
| localhost.localdomain.014 |
103,475 |
| localhost.localdomain.015 |
106,416 |
| localhost.localdomain.016 |
106,927 |
| localhost.localdomain.017 |
104,696 |
| localhost.localdomain.018 |
103,634 |
| localhost.localdomain.019 |
105,612 |
| localhost.localdomain.020 |
105,819 |
| localhost.localdomain.021 |
105,343 |
| localhost.localdomain.022 |
104,357 |
| localhost.localdomain.023 |
105,497 |
| localhost.localdomain.024 |
105,864 |
| localhost.localdomain.025 |
104,143 |
| localhost.localdomain.026 |
105,747 |
| localhost.localdomain.027 |
104,859 |
| localhost.localdomain.028 |
104,317 |
| localhost.localdomain.029 |
104,689 |
| localhost.localdomain.030 |
105,628 |
| localhost.localdomain.031 |
105,445 |
| localhost.localdomain.032 |
103,375 |
| localhost.localdomain.033 |
105,171 |
| localhost.localdomain.034 |
106,047 |
| localhost.localdomain.035 |
103,981 |
| localhost.localdomain.036 |
106,783 |
| localhost.localdomain.037 |
106,218 |
| localhost.localdomain.038 |
102,873 |
| localhost.localdomain.039 |
103,186 |
| localhost.localdomain.040 |
103,720 |
| localhost.localdomain.041 |
104,719 |
| localhost.localdomain.042 |
104,106 |
| localhost.localdomain.043 |
105,505 |
| localhost.localdomain.044 |
105,984 |
| localhost.localdomain.045 |
104,484 |
| localhost.localdomain.046 |
104,344 |
| localhost.localdomain.047 |
105,171 |
| localhost.localdomain.048 |
106,031 |
| localhost.localdomain.049 |
104,608 |
| localhost.localdomain.050 |
104,224 |
| localhost.localdomain.051 |
105,147 |
| localhost.localdomain.052 |
103,459 |
| localhost.localdomain.053 |
104,900 |
| localhost.localdomain.054 |
104,236 |
| localhost.localdomain.055 |
104,162 |
| localhost.localdomain.056 |
103,385 |
| ssj_ops@100% |
5,876,718 |
| ssj_ops@100% per JVM |
104,941 |
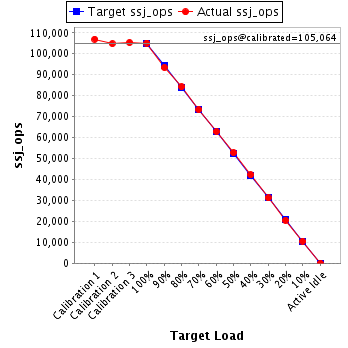
JVM 'localhost.localdomain.001' Scores:
| Target Load |
Actual Load |
ssj_ops |
| Target |
Actual |
| Calibration 1 |
|
|
106,986 |
| Calibration 2 |
|
|
104,810 |
| Calibration 3 |
|
|
105,319 |
| ssj_ops@calibrated=105,064 |
| 100% |
100.1% |
105,064 |
105,154 |
| 90% |
89.0% |
94,558 |
93,456 |
| 80% |
80.1% |
84,051 |
84,184 |
| 70% |
69.8% |
73,545 |
73,341 |
| 60% |
59.9% |
63,038 |
62,882 |
| 50% |
50.2% |
52,532 |
52,733 |
| 40% |
40.2% |
42,026 |
42,225 |
| 30% |
29.7% |
31,519 |
31,158 |
| 20% |
19.6% |
21,013 |
20,554 |
| 10% |
10.0% |
10,506 |
10,546 |
| Active Idle |
|
0 |
0 |
JVM 'localhost.localdomain.002' Scores:
| Target Load |
Actual Load |
ssj_ops |
| Target |
Actual |
| Calibration 1 |
|
|
107,743 |
| Calibration 2 |
|
|
105,612 |
| Calibration 3 |
|
|
106,324 |
| ssj_ops@calibrated=105,968 |
| 100% |
100.5% |
105,968 |
106,515 |
| 90% |
89.5% |
95,371 |
94,858 |
| 80% |
79.5% |
84,774 |
84,282 |
| 70% |
69.9% |
74,178 |
74,037 |
| 60% |
60.4% |
63,581 |
64,029 |
| 50% |
49.8% |
52,984 |
52,797 |
| 40% |
40.3% |
42,387 |
42,696 |
| 30% |
30.0% |
31,790 |
31,792 |
| 20% |
20.1% |
21,194 |
21,317 |
| 10% |
9.9% |
10,597 |
10,450 |
| Active Idle |
|
0 |
0 |
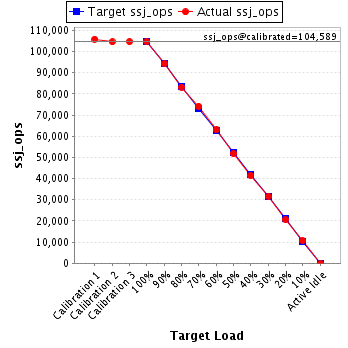
JVM 'localhost.localdomain.003' Scores:
| Target Load |
Actual Load |
ssj_ops |
| Target |
Actual |
| Calibration 1 |
|
|
105,846 |
| Calibration 2 |
|
|
104,541 |
| Calibration 3 |
|
|
104,637 |
| ssj_ops@calibrated=104,589 |
| 100% |
100.0% |
104,589 |
104,540 |
| 90% |
90.1% |
94,130 |
94,204 |
| 80% |
79.6% |
83,671 |
83,251 |
| 70% |
70.9% |
73,212 |
74,124 |
| 60% |
60.2% |
62,753 |
63,006 |
| 50% |
49.5% |
52,294 |
51,805 |
| 40% |
39.6% |
41,836 |
41,424 |
| 30% |
30.3% |
31,377 |
31,700 |
| 20% |
19.6% |
20,918 |
20,471 |
| 10% |
10.1% |
10,459 |
10,558 |
| Active Idle |
|
0 |
0 |
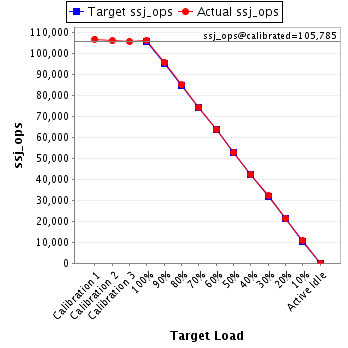
JVM 'localhost.localdomain.004' Scores:
| Target Load |
Actual Load |
ssj_ops |
| Target |
Actual |
| Calibration 1 |
|
|
106,707 |
| Calibration 2 |
|
|
105,929 |
| Calibration 3 |
|
|
105,640 |
| ssj_ops@calibrated=105,785 |
| 100% |
100.3% |
105,785 |
106,109 |
| 90% |
90.5% |
95,206 |
95,759 |
| 80% |
80.4% |
84,628 |
85,025 |
| 70% |
70.1% |
74,049 |
74,200 |
| 60% |
60.3% |
63,471 |
63,829 |
| 50% |
50.0% |
52,892 |
52,896 |
| 40% |
40.0% |
42,314 |
42,308 |
| 30% |
30.4% |
31,735 |
32,106 |
| 20% |
20.1% |
21,157 |
21,269 |
| 10% |
10.2% |
10,578 |
10,762 |
| Active Idle |
|
0 |
0 |
JVM 'localhost.localdomain.005' Scores:
| Target Load |
Actual Load |
ssj_ops |
| Target |
Actual |
| Calibration 1 |
|
|
106,138 |
| Calibration 2 |
|
|
104,533 |
| Calibration 3 |
|
|
105,139 |
| ssj_ops@calibrated=104,836 |
| 100% |
99.7% |
104,836 |
104,535 |
| 90% |
91.1% |
94,352 |
95,536 |
| 80% |
79.6% |
83,869 |
83,485 |
| 70% |
70.6% |
73,385 |
73,965 |
| 60% |
60.1% |
62,902 |
62,984 |
| 50% |
50.3% |
52,418 |
52,718 |
| 40% |
40.3% |
41,934 |
42,233 |
| 30% |
29.9% |
31,451 |
31,379 |
| 20% |
20.0% |
20,967 |
20,933 |
| 10% |
10.1% |
10,484 |
10,587 |
| Active Idle |
|
0 |
0 |
JVM 'localhost.localdomain.006' Scores:
| Target Load |
Actual Load |
ssj_ops |
| Target |
Actual |
| Calibration 1 |
|
|
107,699 |
| Calibration 2 |
|
|
106,814 |
| Calibration 3 |
|
|
107,066 |
| ssj_ops@calibrated=106,940 |
| 100% |
99.7% |
106,940 |
106,624 |
| 90% |
89.4% |
96,246 |
95,645 |
| 80% |
79.5% |
85,552 |
85,060 |
| 70% |
69.5% |
74,858 |
74,290 |
| 60% |
60.5% |
64,164 |
64,673 |
| 50% |
50.2% |
53,470 |
53,664 |
| 40% |
40.3% |
42,776 |
43,121 |
| 30% |
29.6% |
32,082 |
31,697 |
| 20% |
19.9% |
21,388 |
21,229 |
| 10% |
9.7% |
10,694 |
10,421 |
| Active Idle |
|
0 |
0 |
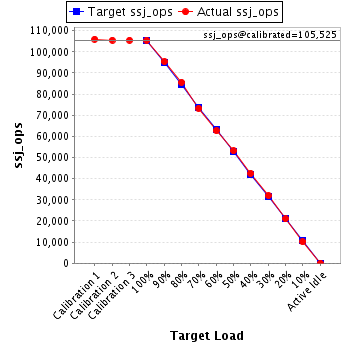
JVM 'localhost.localdomain.007' Scores:
| Target Load |
Actual Load |
ssj_ops |
| Target |
Actual |
| Calibration 1 |
|
|
105,993 |
| Calibration 2 |
|
|
105,518 |
| Calibration 3 |
|
|
105,532 |
| ssj_ops@calibrated=105,525 |
| 100% |
99.9% |
105,525 |
105,411 |
| 90% |
90.4% |
94,973 |
95,356 |
| 80% |
81.1% |
84,420 |
85,618 |
| 70% |
69.5% |
73,868 |
73,307 |
| 60% |
59.4% |
63,315 |
62,697 |
| 50% |
50.4% |
52,763 |
53,142 |
| 40% |
40.3% |
42,210 |
42,548 |
| 30% |
30.3% |
31,658 |
31,975 |
| 20% |
19.9% |
21,105 |
20,981 |
| 10% |
9.7% |
10,553 |
10,204 |
| Active Idle |
|
0 |
0 |
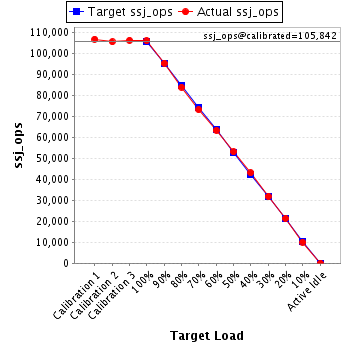
JVM 'localhost.localdomain.008' Scores:
| Target Load |
Actual Load |
ssj_ops |
| Target |
Actual |
| Calibration 1 |
|
|
106,748 |
| Calibration 2 |
|
|
105,450 |
| Calibration 3 |
|
|
106,233 |
| ssj_ops@calibrated=105,842 |
| 100% |
100.2% |
105,842 |
106,011 |
| 90% |
90.0% |
95,257 |
95,252 |
| 80% |
79.3% |
84,673 |
83,922 |
| 70% |
69.2% |
74,089 |
73,191 |
| 60% |
59.8% |
63,505 |
63,286 |
| 50% |
50.1% |
52,921 |
53,065 |
| 40% |
40.7% |
42,337 |
43,033 |
| 30% |
30.1% |
31,752 |
31,842 |
| 20% |
20.2% |
21,168 |
21,362 |
| 10% |
9.5% |
10,584 |
10,104 |
| Active Idle |
|
0 |
0 |
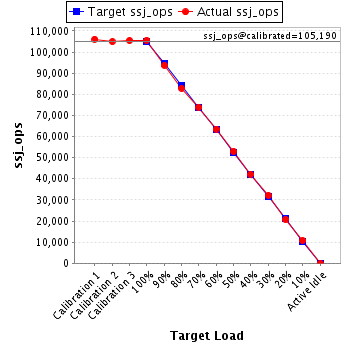
JVM 'localhost.localdomain.009' Scores:
| Target Load |
Actual Load |
ssj_ops |
| Target |
Actual |
| Calibration 1 |
|
|
106,098 |
| Calibration 2 |
|
|
104,953 |
| Calibration 3 |
|
|
105,426 |
| ssj_ops@calibrated=105,190 |
| 100% |
100.4% |
105,190 |
105,577 |
| 90% |
89.1% |
94,671 |
93,750 |
| 80% |
78.8% |
84,152 |
82,841 |
| 70% |
70.3% |
73,633 |
73,952 |
| 60% |
60.4% |
63,114 |
63,557 |
| 50% |
50.4% |
52,595 |
53,033 |
| 40% |
40.1% |
42,076 |
42,208 |
| 30% |
30.5% |
31,557 |
32,130 |
| 20% |
19.7% |
21,038 |
20,750 |
| 10% |
10.2% |
10,519 |
10,750 |
| Active Idle |
|
0 |
0 |
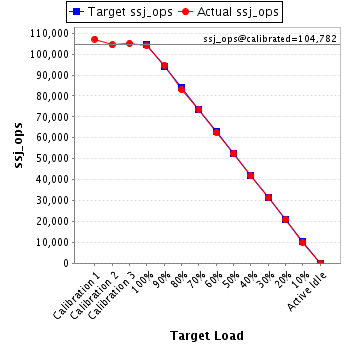
JVM 'localhost.localdomain.010' Scores:
| Target Load |
Actual Load |
ssj_ops |
| Target |
Actual |
| Calibration 1 |
|
|
107,161 |
| Calibration 2 |
|
|
104,394 |
| Calibration 3 |
|
|
105,170 |
| ssj_ops@calibrated=104,782 |
| 100% |
99.3% |
104,782 |
104,071 |
| 90% |
90.4% |
94,304 |
94,766 |
| 80% |
79.2% |
83,825 |
83,029 |
| 70% |
70.2% |
73,347 |
73,542 |
| 60% |
59.7% |
62,869 |
62,596 |
| 50% |
50.1% |
52,391 |
52,469 |
| 40% |
39.8% |
41,913 |
41,736 |
| 30% |
30.0% |
31,435 |
31,437 |
| 20% |
19.9% |
20,956 |
20,892 |
| 10% |
9.6% |
10,478 |
10,080 |
| Active Idle |
|
0 |
0 |
JVM 'localhost.localdomain.011' Scores:
| Target Load |
Actual Load |
ssj_ops |
| Target |
Actual |
| Calibration 1 |
|
|
105,031 |
| Calibration 2 |
|
|
102,814 |
| Calibration 3 |
|
|
104,483 |
| ssj_ops@calibrated=103,648 |
| 100% |
100.1% |
103,648 |
103,758 |
| 90% |
90.0% |
93,283 |
93,254 |
| 80% |
79.6% |
82,919 |
82,531 |
| 70% |
70.4% |
72,554 |
72,925 |
| 60% |
59.2% |
62,189 |
61,359 |
| 50% |
50.0% |
51,824 |
51,797 |
| 40% |
41.0% |
41,459 |
42,503 |
| 30% |
30.2% |
31,094 |
31,285 |
| 20% |
20.6% |
20,730 |
21,308 |
| 10% |
10.2% |
10,365 |
10,595 |
| Active Idle |
|
0 |
0 |
JVM 'localhost.localdomain.012' Scores:
| Target Load |
Actual Load |
ssj_ops |
| Target |
Actual |
| Calibration 1 |
|
|
105,782 |
| Calibration 2 |
|
|
104,573 |
| Calibration 3 |
|
|
105,233 |
| ssj_ops@calibrated=104,903 |
| 100% |
100.5% |
104,903 |
105,428 |
| 90% |
89.3% |
94,413 |
93,690 |
| 80% |
80.5% |
83,922 |
84,402 |
| 70% |
69.8% |
73,432 |
73,270 |
| 60% |
59.4% |
62,942 |
62,292 |
| 50% |
50.5% |
52,451 |
52,960 |
| 40% |
39.4% |
41,961 |
41,325 |
| 30% |
30.7% |
31,471 |
32,251 |
| 20% |
19.9% |
20,981 |
20,850 |
| 10% |
10.0% |
10,490 |
10,521 |
| Active Idle |
|
0 |
0 |
JVM 'localhost.localdomain.013' Scores:
| Target Load |
Actual Load |
ssj_ops |
| Target |
Actual |
| Calibration 1 |
|
|
107,016 |
| Calibration 2 |
|
|
106,087 |
| Calibration 3 |
|
|
106,050 |
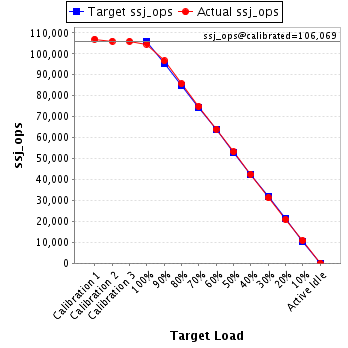
| ssj_ops@calibrated=106,069 |
| 100% |
98.7% |
106,069 |
104,699 |
| 90% |
91.1% |
95,462 |
96,665 |
| 80% |
80.8% |
84,855 |
85,729 |
| 70% |
70.6% |
74,248 |
74,894 |
| 60% |
60.4% |
63,641 |
64,070 |
| 50% |
50.1% |
53,034 |
53,173 |
| 40% |
40.0% |
42,427 |
42,438 |
| 30% |
29.5% |
31,821 |
31,275 |
| 20% |
19.7% |
21,214 |
20,925 |
| 10% |
10.2% |
10,607 |
10,858 |
| Active Idle |
|
0 |
0 |
JVM 'localhost.localdomain.014' Scores:
| Target Load |
Actual Load |
ssj_ops |
| Target |
Actual |
| Calibration 1 |
|
|
105,659 |
| Calibration 2 |
|
|
103,294 |
| Calibration 3 |
|
|
104,912 |
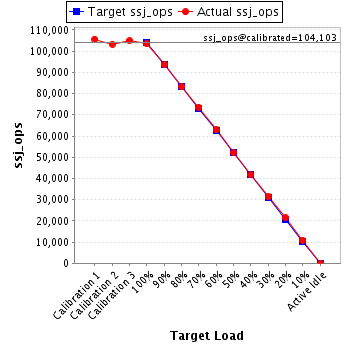
| ssj_ops@calibrated=104,103 |
| 100% |
99.4% |
104,103 |
103,475 |
| 90% |
90.1% |
93,693 |
93,795 |
| 80% |
79.9% |
83,283 |
83,171 |
| 70% |
70.6% |
72,872 |
73,547 |
| 60% |
60.4% |
62,462 |
62,883 |
| 50% |
49.9% |
52,052 |
51,996 |
| 40% |
40.0% |
41,641 |
41,621 |
| 30% |
30.2% |
31,231 |
31,434 |
| 20% |
20.6% |
20,821 |
21,418 |
| 10% |
10.4% |
10,410 |
10,850 |
| Active Idle |
|
0 |
0 |
JVM 'localhost.localdomain.015' Scores:
| Target Load |
Actual Load |
ssj_ops |
| Target |
Actual |
| Calibration 1 |
|
|
106,950 |
| Calibration 2 |
|
|
106,057 |
| Calibration 3 |
|
|
106,401 |
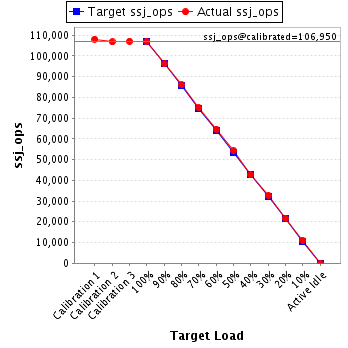
| ssj_ops@calibrated=106,229 |
| 100% |
100.2% |
106,229 |
106,416 |
| 90% |
91.3% |
95,606 |
96,979 |
| 80% |
79.6% |
84,983 |
84,557 |
| 70% |
70.4% |
74,361 |
74,784 |
| 60% |
59.9% |
63,738 |
63,641 |
| 50% |
50.2% |
53,115 |
53,308 |
| 40% |
39.5% |
42,492 |
41,958 |
| 30% |
30.2% |
31,869 |
32,129 |
| 20% |
20.0% |
21,246 |
21,260 |
| 10% |
10.0% |
10,623 |
10,617 |
| Active Idle |
|
0 |
0 |
JVM 'localhost.localdomain.016' Scores:
| Target Load |
Actual Load |
ssj_ops |
| Target |
Actual |
| Calibration 1 |
|
|
108,086 |
| Calibration 2 |
|
|
106,748 |
| Calibration 3 |
|
|
107,152 |
| ssj_ops@calibrated=106,950 |
| 100% |
100.0% |
106,950 |
106,927 |
| 90% |
89.9% |
96,255 |
96,116 |
| 80% |
80.5% |
85,560 |
86,042 |
| 70% |
70.0% |
74,865 |
74,904 |
| 60% |
60.4% |
64,170 |
64,616 |
| 50% |
50.7% |
53,475 |
54,196 |
| 40% |
39.9% |
42,780 |
42,651 |
| 30% |
30.6% |
32,085 |
32,696 |
| 20% |
20.3% |
21,390 |
21,721 |
| 10% |
10.3% |
10,695 |
11,050 |
| Active Idle |
|
0 |
0 |
JVM 'localhost.localdomain.017' Scores:
| Target Load |
Actual Load |
ssj_ops |
| Target |
Actual |
| Calibration 1 |
|
|
105,254 |
| Calibration 2 |
|
|
103,501 |
| Calibration 3 |
|
|
104,265 |
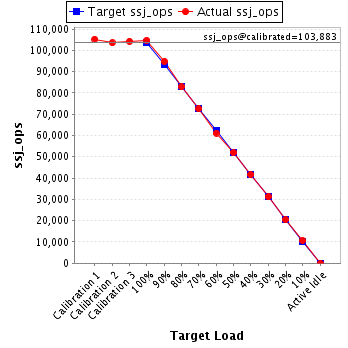
| ssj_ops@calibrated=103,883 |
| 100% |
100.8% |
103,883 |
104,696 |
| 90% |
91.3% |
93,495 |
94,852 |
| 80% |
79.7% |
83,106 |
82,788 |
| 70% |
69.8% |
72,718 |
72,558 |
| 60% |
58.9% |
62,330 |
61,182 |
| 50% |
50.1% |
51,941 |
52,021 |
| 40% |
40.0% |
41,553 |
41,567 |
| 30% |
30.1% |
31,165 |
31,233 |
| 20% |
19.6% |
20,777 |
20,369 |
| 10% |
10.3% |
10,388 |
10,662 |
| Active Idle |
|
0 |
0 |
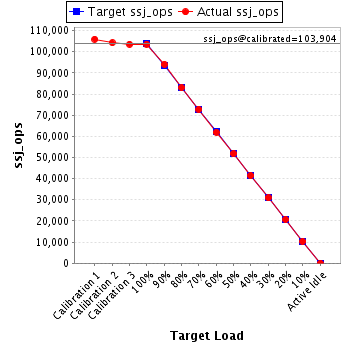
JVM 'localhost.localdomain.018' Scores:
| Target Load |
Actual Load |
ssj_ops |
| Target |
Actual |
| Calibration 1 |
|
|
105,957 |
| Calibration 2 |
|
|
104,214 |
| Calibration 3 |
|
|
103,595 |
| ssj_ops@calibrated=103,904 |
| 100% |
99.7% |
103,904 |
103,634 |
| 90% |
90.6% |
93,514 |
94,111 |
| 80% |
79.9% |
83,123 |
82,977 |
| 70% |
70.1% |
72,733 |
72,802 |
| 60% |
59.6% |
62,343 |
61,932 |
| 50% |
49.8% |
51,952 |
51,725 |
| 40% |
39.8% |
41,562 |
41,375 |
| 30% |
29.8% |
31,171 |
30,946 |
| 20% |
19.9% |
20,781 |
20,717 |
| 10% |
10.0% |
10,390 |
10,364 |
| Active Idle |
|
0 |
0 |
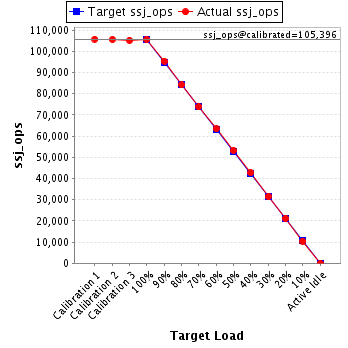
JVM 'localhost.localdomain.019' Scores:
| Target Load |
Actual Load |
ssj_ops |
| Target |
Actual |
| Calibration 1 |
|
|
105,723 |
| Calibration 2 |
|
|
105,572 |
| Calibration 3 |
|
|
105,221 |
| ssj_ops@calibrated=105,396 |
| 100% |
100.2% |
105,396 |
105,612 |
| 90% |
90.5% |
94,857 |
95,350 |
| 80% |
79.8% |
84,317 |
84,114 |
| 70% |
70.0% |
73,777 |
73,774 |
| 60% |
60.2% |
63,238 |
63,462 |
| 50% |
50.6% |
52,698 |
53,286 |
| 40% |
40.5% |
42,158 |
42,716 |
| 30% |
29.9% |
31,619 |
31,497 |
| 20% |
20.1% |
21,079 |
21,196 |
| 10% |
9.9% |
10,540 |
10,441 |
| Active Idle |
|
0 |
0 |
JVM 'localhost.localdomain.020' Scores:
| Target Load |
Actual Load |
ssj_ops |
| Target |
Actual |
| Calibration 1 |
|
|
105,733 |
| Calibration 2 |
|
|
104,700 |
| Calibration 3 |
|
|
105,589 |
| ssj_ops@calibrated=105,144 |
| 100% |
100.6% |
105,144 |
105,819 |
| 90% |
89.9% |
94,630 |
94,506 |
| 80% |
80.4% |
84,116 |
84,537 |
| 70% |
69.7% |
73,601 |
73,248 |
| 60% |
59.7% |
63,087 |
62,779 |
| 50% |
50.6% |
52,572 |
53,210 |
| 40% |
39.8% |
42,058 |
41,883 |
| 30% |
30.0% |
31,543 |
31,510 |
| 20% |
20.5% |
21,029 |
21,526 |
| 10% |
10.0% |
10,514 |
10,465 |
| Active Idle |
|
0 |
0 |
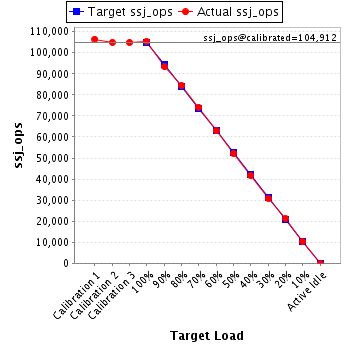
JVM 'localhost.localdomain.021' Scores:
| Target Load |
Actual Load |
ssj_ops |
| Target |
Actual |
| Calibration 1 |
|
|
106,472 |
| Calibration 2 |
|
|
104,957 |
| Calibration 3 |
|
|
104,867 |
| ssj_ops@calibrated=104,912 |
| 100% |
100.4% |
104,912 |
105,343 |
| 90% |
89.0% |
94,421 |
93,390 |
| 80% |
80.6% |
83,930 |
84,535 |
| 70% |
70.7% |
73,438 |
74,152 |
| 60% |
59.9% |
62,947 |
62,869 |
| 50% |
49.8% |
52,456 |
52,220 |
| 40% |
39.8% |
41,965 |
41,722 |
| 30% |
29.5% |
31,474 |
30,976 |
| 20% |
20.2% |
20,982 |
21,158 |
| 10% |
9.9% |
10,491 |
10,367 |
| Active Idle |
|
0 |
0 |
JVM 'localhost.localdomain.022' Scores:
| Target Load |
Actual Load |
ssj_ops |
| Target |
Actual |
| Calibration 1 |
|
|
106,188 |
| Calibration 2 |
|
|
104,610 |
| Calibration 3 |
|
|
104,637 |
| ssj_ops@calibrated=104,623 |
| 100% |
99.7% |
104,623 |
104,357 |
| 90% |
90.1% |
94,161 |
94,263 |
| 80% |
80.1% |
83,699 |
83,849 |
| 70% |
70.6% |
73,236 |
73,882 |
| 60% |
59.9% |
62,774 |
62,652 |
| 50% |
50.0% |
52,312 |
52,293 |
| 40% |
39.9% |
41,849 |
41,763 |
| 30% |
29.8% |
31,387 |
31,180 |
| 20% |
20.1% |
20,925 |
21,067 |
| 10% |
10.2% |
10,462 |
10,683 |
| Active Idle |
|
0 |
0 |
JVM 'localhost.localdomain.023' Scores:
| Target Load |
Actual Load |
ssj_ops |
| Target |
Actual |
| Calibration 1 |
|
|
106,908 |
| Calibration 2 |
|
|
105,671 |
| Calibration 3 |
|
|
105,704 |
| ssj_ops@calibrated=105,687 |
| 100% |
99.8% |
105,687 |
105,497 |
| 90% |
89.9% |
95,119 |
94,979 |
| 80% |
80.7% |
84,550 |
85,303 |
| 70% |
69.6% |
73,981 |
73,541 |
| 60% |
59.9% |
63,412 |
63,346 |
| 50% |
50.0% |
52,844 |
52,885 |
| 40% |
40.4% |
42,275 |
42,708 |
| 30% |
29.4% |
31,706 |
31,108 |
| 20% |
20.1% |
21,137 |
21,217 |
| 10% |
10.0% |
10,569 |
10,531 |
| Active Idle |
|
0 |
0 |
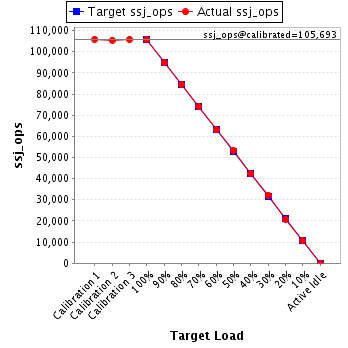
JVM 'localhost.localdomain.024' Scores:
| Target Load |
Actual Load |
ssj_ops |
| Target |
Actual |
| Calibration 1 |
|
|
105,956 |
| Calibration 2 |
|
|
105,523 |
| Calibration 3 |
|
|
105,862 |
| ssj_ops@calibrated=105,693 |
| 100% |
100.2% |
105,693 |
105,864 |
| 90% |
89.6% |
95,124 |
94,707 |
| 80% |
79.8% |
84,554 |
84,342 |
| 70% |
70.0% |
73,985 |
74,006 |
| 60% |
59.7% |
63,416 |
63,083 |
| 50% |
50.5% |
52,846 |
53,385 |
| 40% |
40.3% |
42,277 |
42,546 |
| 30% |
30.5% |
31,708 |
32,229 |
| 20% |
19.8% |
21,139 |
20,910 |
| 10% |
10.1% |
10,569 |
10,675 |
| Active Idle |
|
0 |
0 |
JVM 'localhost.localdomain.025' Scores:
| Target Load |
Actual Load |
ssj_ops |
| Target |
Actual |
| Calibration 1 |
|
|
105,890 |
| Calibration 2 |
|
|
104,448 |
| Calibration 3 |
|
|
103,579 |
| ssj_ops@calibrated=104,013 |
| 100% |
100.1% |
104,013 |
104,143 |
| 90% |
89.6% |
93,612 |
93,204 |
| 80% |
79.5% |
83,211 |
82,674 |
| 70% |
69.9% |
72,809 |
72,713 |
| 60% |
60.4% |
62,408 |
62,788 |
| 50% |
49.1% |
52,007 |
51,032 |
| 40% |
40.0% |
41,605 |
41,579 |
| 30% |
29.7% |
31,204 |
30,862 |
| 20% |
20.3% |
20,803 |
21,070 |
| 10% |
10.0% |
10,401 |
10,396 |
| Active Idle |
|
0 |
0 |
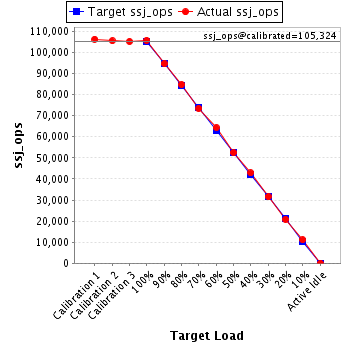
JVM 'localhost.localdomain.026' Scores:
| Target Load |
Actual Load |
ssj_ops |
| Target |
Actual |
| Calibration 1 |
|
|
106,293 |
| Calibration 2 |
|
|
105,454 |
| Calibration 3 |
|
|
105,194 |
| ssj_ops@calibrated=105,324 |
| 100% |
100.4% |
105,324 |
105,747 |
| 90% |
89.8% |
94,792 |
94,628 |
| 80% |
80.5% |
84,259 |
84,742 |
| 70% |
69.8% |
73,727 |
73,483 |
| 60% |
61.1% |
63,194 |
64,350 |
| 50% |
49.8% |
52,662 |
52,454 |
| 40% |
40.7% |
42,130 |
42,832 |
| 30% |
30.0% |
31,597 |
31,562 |
| 20% |
19.8% |
21,065 |
20,802 |
| 10% |
10.5% |
10,532 |
11,100 |
| Active Idle |
|
0 |
0 |
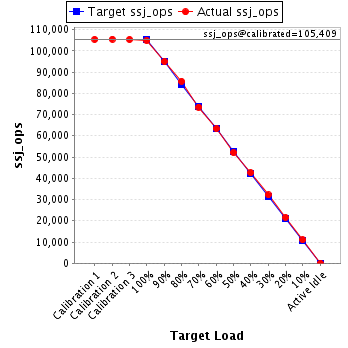
JVM 'localhost.localdomain.027' Scores:
| Target Load |
Actual Load |
ssj_ops |
| Target |
Actual |
| Calibration 1 |
|
|
105,409 |
| Calibration 2 |
|
|
105,492 |
| Calibration 3 |
|
|
105,326 |
| ssj_ops@calibrated=105,409 |
| 100% |
99.5% |
105,409 |
104,859 |
| 90% |
90.1% |
94,868 |
94,981 |
| 80% |
81.3% |
84,327 |
85,666 |
| 70% |
69.8% |
73,786 |
73,532 |
| 60% |
60.1% |
63,245 |
63,359 |
| 50% |
49.4% |
52,704 |
52,073 |
| 40% |
40.4% |
42,164 |
42,637 |
| 30% |
30.6% |
31,623 |
32,221 |
| 20% |
20.5% |
21,082 |
21,619 |
| 10% |
10.4% |
10,541 |
11,000 |
| Active Idle |
|
0 |
0 |
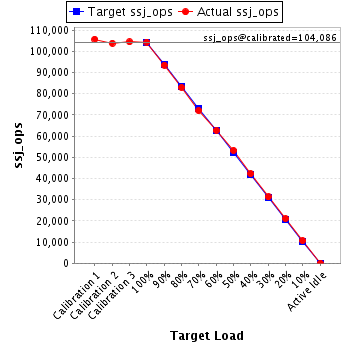
JVM 'localhost.localdomain.028' Scores:
| Target Load |
Actual Load |
ssj_ops |
| Target |
Actual |
| Calibration 1 |
|
|
105,679 |
| Calibration 2 |
|
|
103,827 |
| Calibration 3 |
|
|
104,345 |
| ssj_ops@calibrated=104,086 |
| 100% |
100.2% |
104,086 |
104,317 |
| 90% |
89.8% |
93,678 |
93,453 |
| 80% |
79.7% |
83,269 |
82,916 |
| 70% |
69.1% |
72,860 |
71,957 |
| 60% |
60.2% |
62,452 |
62,644 |
| 50% |
51.1% |
52,043 |
53,181 |
| 40% |
40.6% |
41,635 |
42,233 |
| 30% |
30.0% |
31,226 |
31,252 |
| 20% |
20.2% |
20,817 |
21,034 |
| 10% |
10.2% |
10,409 |
10,637 |
| Active Idle |
|
0 |
0 |
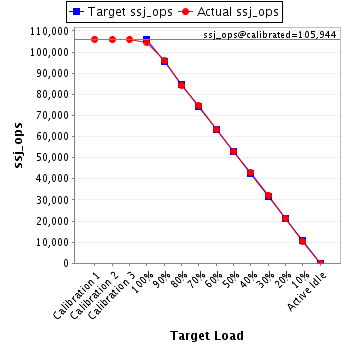
JVM 'localhost.localdomain.029' Scores:
| Target Load |
Actual Load |
ssj_ops |
| Target |
Actual |
| Calibration 1 |
|
|
106,115 |
| Calibration 2 |
|
|
105,866 |
| Calibration 3 |
|
|
106,022 |
| ssj_ops@calibrated=105,944 |
| 100% |
98.8% |
105,944 |
104,689 |
| 90% |
90.5% |
95,350 |
95,862 |
| 80% |
79.7% |
84,755 |
84,386 |
| 70% |
70.4% |
74,161 |
74,616 |
| 60% |
59.8% |
63,567 |
63,321 |
| 50% |
50.1% |
52,972 |
53,029 |
| 40% |
40.5% |
42,378 |
42,950 |
| 30% |
30.4% |
31,783 |
32,196 |
| 20% |
19.8% |
21,189 |
21,005 |
| 10% |
9.9% |
10,594 |
10,442 |
| Active Idle |
|
0 |
0 |
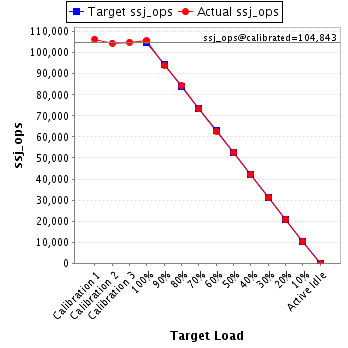
JVM 'localhost.localdomain.030' Scores:
| Target Load |
Actual Load |
ssj_ops |
| Target |
Actual |
| Calibration 1 |
|
|
106,436 |
| Calibration 2 |
|
|
104,601 |
| Calibration 3 |
|
|
105,085 |
| ssj_ops@calibrated=104,843 |
| 100% |
100.7% |
104,843 |
105,628 |
| 90% |
89.6% |
94,359 |
93,962 |
| 80% |
80.4% |
83,875 |
84,249 |
| 70% |
69.9% |
73,390 |
73,309 |
| 60% |
59.8% |
62,906 |
62,693 |
| 50% |
50.2% |
52,422 |
52,596 |
| 40% |
40.1% |
41,937 |
42,070 |
| 30% |
29.7% |
31,453 |
31,146 |
| 20% |
19.9% |
20,969 |
20,828 |
| 10% |
9.9% |
10,484 |
10,425 |
| Active Idle |
|
0 |
0 |
JVM 'localhost.localdomain.031' Scores:
| Target Load |
Actual Load |
ssj_ops |
| Target |
Actual |
| Calibration 1 |
|
|
106,438 |
| Calibration 2 |
|
|
105,104 |
| Calibration 3 |
|
|
105,205 |
| ssj_ops@calibrated=105,155 |
| 100% |
100.3% |
105,155 |
105,445 |
| 90% |
90.2% |
94,639 |
94,881 |
| 80% |
80.1% |
84,124 |
84,186 |
| 70% |
69.7% |
73,608 |
73,294 |
| 60% |
58.5% |
63,093 |
61,504 |
| 50% |
49.9% |
52,577 |
52,474 |
| 40% |
40.4% |
42,062 |
42,499 |
| 30% |
29.8% |
31,546 |
31,354 |
| 20% |
20.1% |
21,031 |
21,108 |
| 10% |
9.8% |
10,515 |
10,300 |
| Active Idle |
|
0 |
0 |
JVM 'localhost.localdomain.032' Scores:
| Target Load |
Actual Load |
ssj_ops |
| Target |
Actual |
| Calibration 1 |
|
|
106,211 |
| Calibration 2 |
|
|
103,253 |
| Calibration 3 |
|
|
103,860 |
| ssj_ops@calibrated=103,557 |
| 100% |
99.8% |
103,557 |
103,375 |
| 90% |
88.9% |
93,201 |
92,079 |
| 80% |
81.0% |
82,845 |
83,840 |
| 70% |
70.0% |
72,490 |
72,509 |
| 60% |
59.9% |
62,134 |
62,028 |
| 50% |
50.1% |
51,778 |
51,901 |
| 40% |
40.5% |
41,423 |
41,969 |
| 30% |
30.2% |
31,067 |
31,325 |
| 20% |
20.1% |
20,711 |
20,817 |
| 10% |
9.9% |
10,356 |
10,237 |
| Active Idle |
|
0 |
0 |
JVM 'localhost.localdomain.033' Scores:
| Target Load |
Actual Load |
ssj_ops |
| Target |
Actual |
| Calibration 1 |
|
|
106,633 |
| Calibration 2 |
|
|
105,092 |
| Calibration 3 |
|
|
105,178 |
| ssj_ops@calibrated=105,135 |
| 100% |
100.0% |
105,135 |
105,171 |
| 90% |
89.6% |
94,622 |
94,184 |
| 80% |
79.8% |
84,108 |
83,904 |
| 70% |
70.6% |
73,595 |
74,240 |
| 60% |
59.8% |
63,081 |
62,888 |
| 50% |
49.8% |
52,568 |
52,400 |
| 40% |
40.3% |
42,054 |
42,413 |
| 30% |
30.3% |
31,541 |
31,883 |
| 20% |
20.0% |
21,027 |
21,028 |
| 10% |
9.8% |
10,514 |
10,342 |
| Active Idle |
|
0 |
0 |
JVM 'localhost.localdomain.034' Scores:
| Target Load |
Actual Load |
ssj_ops |
| Target |
Actual |
| Calibration 1 |
|
|
107,310 |
| Calibration 2 |
|
|
106,281 |
| Calibration 3 |
|
|
106,427 |
| ssj_ops@calibrated=106,354 |
| 100% |
99.7% |
106,354 |
106,047 |
| 90% |
90.3% |
95,718 |
96,089 |
| 80% |
79.8% |
85,083 |
84,833 |
| 70% |
70.3% |
74,448 |
74,799 |
| 60% |
59.7% |
63,812 |
63,527 |
| 50% |
48.9% |
53,177 |
51,958 |
| 40% |
39.9% |
42,542 |
42,396 |
| 30% |
30.3% |
31,906 |
32,276 |
| 20% |
20.1% |
21,271 |
21,338 |
| 10% |
9.8% |
10,635 |
10,464 |
| Active Idle |
|
0 |
0 |
JVM 'localhost.localdomain.035' Scores:
| Target Load |
Actual Load |
ssj_ops |
| Target |
Actual |
| Calibration 1 |
|
|
105,347 |
| Calibration 2 |
|
|
103,658 |
| Calibration 3 |
|
|
103,567 |
| ssj_ops@calibrated=103,613 |
| 100% |
100.4% |
103,613 |
103,981 |
| 90% |
90.3% |
93,251 |
93,570 |
| 80% |
79.4% |
82,890 |
82,241 |
| 70% |
70.4% |
72,529 |
72,939 |
| 60% |
60.2% |
62,168 |
62,377 |
| 50% |
50.1% |
51,806 |
51,947 |
| 40% |
40.1% |
41,445 |
41,558 |
| 30% |
30.2% |
31,084 |
31,308 |
| 20% |
20.0% |
20,723 |
20,704 |
| 10% |
10.4% |
10,361 |
10,804 |
| Active Idle |
|
0 |
0 |
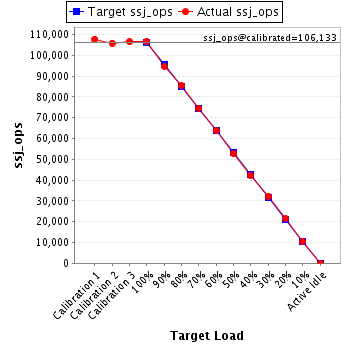
JVM 'localhost.localdomain.036' Scores:
| Target Load |
Actual Load |
ssj_ops |
| Target |
Actual |
| Calibration 1 |
|
|
107,712 |
| Calibration 2 |
|
|
105,865 |
| Calibration 3 |
|
|
106,401 |
| ssj_ops@calibrated=106,133 |
| 100% |
100.6% |
106,133 |
106,783 |
| 90% |
89.2% |
95,520 |
94,721 |
| 80% |
80.4% |
84,907 |
85,372 |
| 70% |
70.1% |
74,293 |
74,439 |
| 60% |
60.1% |
63,680 |
63,785 |
| 50% |
49.6% |
53,067 |
52,616 |
| 40% |
39.9% |
42,453 |
42,321 |
| 30% |
30.2% |
31,840 |
32,063 |
| 20% |
20.3% |
21,227 |
21,587 |
| 10% |
9.9% |
10,613 |
10,546 |
| Active Idle |
|
0 |
0 |
JVM 'localhost.localdomain.037' Scores:
| Target Load |
Actual Load |
ssj_ops |
| Target |
Actual |
| Calibration 1 |
|
|
107,362 |
| Calibration 2 |
|
|
105,519 |
| Calibration 3 |
|
|
106,739 |
| ssj_ops@calibrated=106,129 |
| 100% |
100.1% |
106,129 |
106,218 |
| 90% |
90.6% |
95,516 |
96,151 |
| 80% |
79.8% |
84,903 |
84,663 |
| 70% |
69.9% |
74,290 |
74,157 |
| 60% |
61.0% |
63,677 |
64,719 |
| 50% |
49.8% |
53,064 |
52,836 |
| 40% |
40.4% |
42,452 |
42,841 |
| 30% |
29.8% |
31,839 |
31,604 |
| 20% |
19.6% |
21,226 |
20,842 |
| 10% |
9.9% |
10,613 |
10,484 |
| Active Idle |
|
0 |
0 |
JVM 'localhost.localdomain.038' Scores:
| Target Load |
Actual Load |
ssj_ops |
| Target |
Actual |
| Calibration 1 |
|
|
105,595 |
| Calibration 2 |
|
|
103,187 |
| Calibration 3 |
|
|
103,566 |
| ssj_ops@calibrated=103,377 |
| 100% |
99.5% |
103,377 |
102,873 |
| 90% |
91.1% |
93,039 |
94,174 |
| 80% |
79.0% |
82,701 |
81,646 |
| 70% |
70.5% |
72,364 |
72,829 |
| 60% |
59.7% |
62,026 |
61,740 |
| 50% |
50.0% |
51,688 |
51,733 |
| 40% |
39.2% |
41,351 |
40,488 |
| 30% |
30.0% |
31,013 |
31,029 |
| 20% |
20.8% |
20,675 |
21,546 |
| 10% |
9.9% |
10,338 |
10,279 |
| Active Idle |
|
0 |
0 |
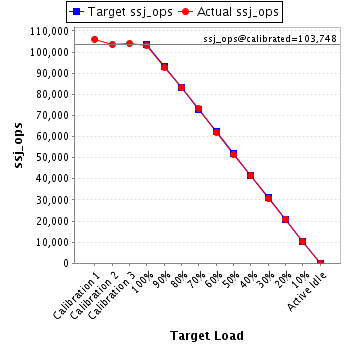
JVM 'localhost.localdomain.039' Scores:
| Target Load |
Actual Load |
ssj_ops |
| Target |
Actual |
| Calibration 1 |
|
|
106,095 |
| Calibration 2 |
|
|
103,512 |
| Calibration 3 |
|
|
103,984 |
| ssj_ops@calibrated=103,748 |
| 100% |
99.5% |
103,748 |
103,186 |
| 90% |
89.5% |
93,373 |
92,875 |
| 80% |
80.0% |
82,998 |
82,999 |
| 70% |
70.4% |
72,624 |
73,036 |
| 60% |
59.7% |
62,249 |
61,892 |
| 50% |
49.7% |
51,874 |
51,542 |
| 40% |
39.8% |
41,499 |
41,343 |
| 30% |
29.4% |
31,124 |
30,537 |
| 20% |
20.2% |
20,750 |
20,921 |
| 10% |
9.9% |
10,375 |
10,317 |
| Active Idle |
|
0 |
0 |
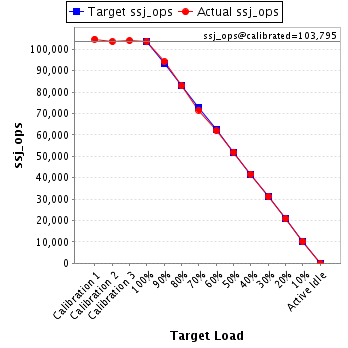
JVM 'localhost.localdomain.040' Scores:
| Target Load |
Actual Load |
ssj_ops |
| Target |
Actual |
| Calibration 1 |
|
|
104,701 |
| Calibration 2 |
|
|
103,593 |
| Calibration 3 |
|
|
103,998 |
| ssj_ops@calibrated=103,795 |
| 100% |
99.9% |
103,795 |
103,720 |
| 90% |
90.7% |
93,416 |
94,151 |
| 80% |
79.8% |
83,036 |
82,880 |
| 70% |
69.0% |
72,657 |
71,598 |
| 60% |
59.6% |
62,277 |
61,886 |
| 50% |
50.1% |
51,898 |
51,974 |
| 40% |
40.2% |
41,518 |
41,676 |
| 30% |
30.0% |
31,139 |
31,102 |
| 20% |
20.0% |
20,759 |
20,717 |
| 10% |
9.9% |
10,380 |
10,283 |
| Active Idle |
|
0 |
0 |
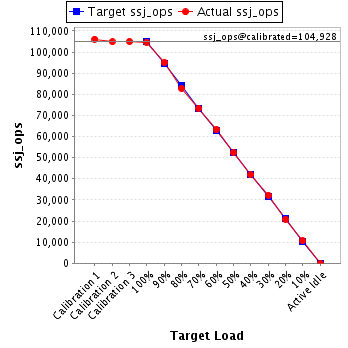
JVM 'localhost.localdomain.041' Scores:
| Target Load |
Actual Load |
ssj_ops |
| Target |
Actual |
| Calibration 1 |
|
|
106,097 |
| Calibration 2 |
|
|
104,881 |
| Calibration 3 |
|
|
104,976 |
| ssj_ops@calibrated=104,928 |
| 100% |
99.8% |
104,928 |
104,719 |
| 90% |
90.6% |
94,435 |
95,023 |
| 80% |
78.8% |
83,943 |
82,726 |
| 70% |
69.9% |
73,450 |
73,371 |
| 60% |
60.4% |
62,957 |
63,346 |
| 50% |
49.9% |
52,464 |
52,387 |
| 40% |
39.9% |
41,971 |
41,884 |
| 30% |
30.7% |
31,478 |
32,200 |
| 20% |
19.9% |
20,986 |
20,875 |
| 10% |
10.1% |
10,493 |
10,621 |
| Active Idle |
|
0 |
0 |
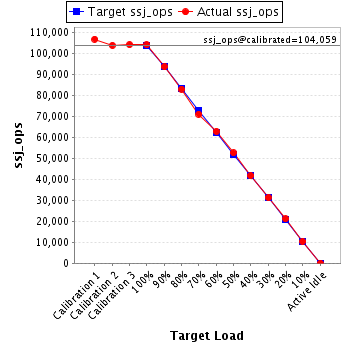
JVM 'localhost.localdomain.042' Scores:
| Target Load |
Actual Load |
ssj_ops |
| Target |
Actual |
| Calibration 1 |
|
|
106,851 |
| Calibration 2 |
|
|
103,915 |
| Calibration 3 |
|
|
104,203 |
| ssj_ops@calibrated=104,059 |
| 100% |
100.0% |
104,059 |
104,106 |
| 90% |
90.1% |
93,653 |
93,725 |
| 80% |
79.8% |
83,247 |
83,069 |
| 70% |
68.3% |
72,842 |
71,110 |
| 60% |
60.5% |
62,436 |
62,909 |
| 50% |
50.6% |
52,030 |
52,642 |
| 40% |
40.1% |
41,624 |
41,693 |
| 30% |
30.1% |
31,218 |
31,277 |
| 20% |
20.3% |
20,812 |
21,175 |
| 10% |
10.0% |
10,406 |
10,450 |
| Active Idle |
|
0 |
0 |
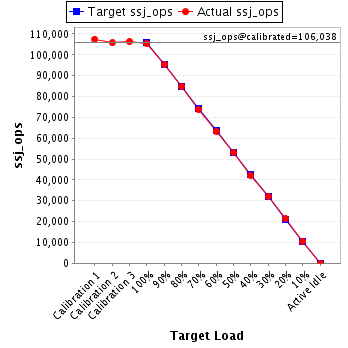
JVM 'localhost.localdomain.043' Scores:
| Target Load |
Actual Load |
ssj_ops |
| Target |
Actual |
| Calibration 1 |
|
|
107,511 |
| Calibration 2 |
|
|
105,744 |
| Calibration 3 |
|
|
106,332 |
| ssj_ops@calibrated=106,038 |
| 100% |
99.5% |
106,038 |
105,505 |
| 90% |
89.9% |
95,434 |
95,354 |
| 80% |
80.0% |
84,830 |
84,778 |
| 70% |
69.6% |
74,227 |
73,853 |
| 60% |
59.8% |
63,623 |
63,368 |
| 50% |
50.0% |
53,019 |
53,050 |
| 40% |
39.8% |
42,415 |
42,196 |
| 30% |
30.2% |
31,811 |
32,038 |
| 20% |
20.1% |
21,208 |
21,296 |
| 10% |
10.0% |
10,604 |
10,612 |
| Active Idle |
|
0 |
0 |
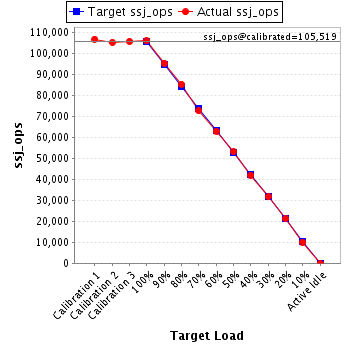
JVM 'localhost.localdomain.044' Scores:
| Target Load |
Actual Load |
ssj_ops |
| Target |
Actual |
| Calibration 1 |
|
|
106,839 |
| Calibration 2 |
|
|
105,287 |
| Calibration 3 |
|
|
105,751 |
| ssj_ops@calibrated=105,519 |
| 100% |
100.4% |
105,519 |
105,984 |
| 90% |
90.4% |
94,967 |
95,433 |
| 80% |
80.9% |
84,415 |
85,316 |
| 70% |
68.9% |
73,863 |
72,695 |
| 60% |
59.7% |
63,311 |
62,996 |
| 50% |
50.4% |
52,760 |
53,155 |
| 40% |
39.9% |
42,208 |
42,052 |
| 30% |
30.1% |
31,656 |
31,746 |
| 20% |
20.2% |
21,104 |
21,271 |
| 10% |
9.6% |
10,552 |
10,125 |
| Active Idle |
|
0 |
0 |
JVM 'localhost.localdomain.045' Scores:
| Target Load |
Actual Load |
ssj_ops |
| Target |
Actual |
| Calibration 1 |
|
|
105,105 |
| Calibration 2 |
|
|
102,898 |
| Calibration 3 |
|
|
103,777 |
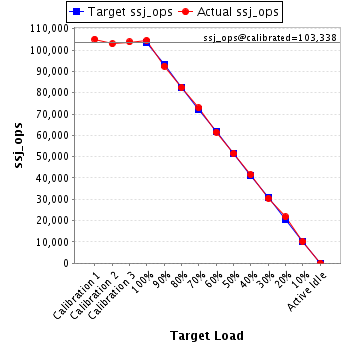
| ssj_ops@calibrated=103,338 |
| 100% |
101.1% |
103,338 |
104,484 |
| 90% |
89.5% |
93,004 |
92,442 |
| 80% |
79.7% |
82,670 |
82,411 |
| 70% |
70.5% |
72,336 |
72,848 |
| 60% |
59.5% |
62,003 |
61,533 |
| 50% |
49.8% |
51,669 |
51,415 |
| 40% |
40.2% |
41,335 |
41,522 |
| 30% |
29.5% |
31,001 |
30,506 |
| 20% |
21.0% |
20,668 |
21,722 |
| 10% |
9.9% |
10,334 |
10,203 |
| Active Idle |
|
0 |
0 |
JVM 'localhost.localdomain.046' Scores:
| Target Load |
Actual Load |
ssj_ops |
| Target |
Actual |
| Calibration 1 |
|
|
106,008 |
| Calibration 2 |
|
|
103,807 |
| Calibration 3 |
|
|
104,124 |
| ssj_ops@calibrated=103,966 |
| 100% |
100.4% |
103,966 |
104,344 |
| 90% |
90.3% |
93,569 |
93,832 |
| 80% |
80.2% |
83,173 |
83,354 |
| 70% |
69.7% |
72,776 |
72,456 |
| 60% |
60.0% |
62,379 |
62,346 |
| 50% |
49.4% |
51,983 |
51,333 |
| 40% |
40.2% |
41,586 |
41,767 |
| 30% |
30.2% |
31,190 |
31,379 |
| 20% |
20.0% |
20,793 |
20,842 |
| 10% |
10.1% |
10,397 |
10,504 |
| Active Idle |
|
0 |
0 |
JVM 'localhost.localdomain.047' Scores:
| Target Load |
Actual Load |
ssj_ops |
| Target |
Actual |
| Calibration 1 |
|
|
105,295 |
| Calibration 2 |
|
|
104,329 |
| Calibration 3 |
|
|
104,637 |
| ssj_ops@calibrated=104,483 |
| 100% |
100.7% |
104,483 |
105,171 |
| 90% |
90.1% |
94,035 |
94,138 |
| 80% |
79.4% |
83,586 |
82,918 |
| 70% |
70.3% |
73,138 |
73,488 |
| 60% |
59.9% |
62,690 |
62,583 |
| 50% |
49.8% |
52,241 |
52,066 |
| 40% |
39.6% |
41,793 |
41,359 |
| 30% |
30.0% |
31,345 |
31,333 |
| 20% |
19.6% |
20,897 |
20,468 |
| 10% |
9.9% |
10,448 |
10,379 |
| Active Idle |
|
0 |
0 |
JVM 'localhost.localdomain.048' Scores:
| Target Load |
Actual Load |
ssj_ops |
| Target |
Actual |
| Calibration 1 |
|
|
106,378 |
| Calibration 2 |
|
|
105,593 |
| Calibration 3 |
|
|
106,195 |
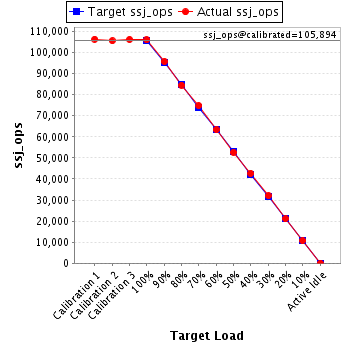
| ssj_ops@calibrated=105,894 |
| 100% |
100.1% |
105,894 |
106,031 |
| 90% |
90.4% |
95,305 |
95,756 |
| 80% |
79.8% |
84,715 |
84,545 |
| 70% |
70.7% |
74,126 |
74,825 |
| 60% |
59.9% |
63,537 |
63,427 |
| 50% |
49.8% |
52,947 |
52,684 |
| 40% |
40.3% |
42,358 |
42,717 |
| 30% |
30.3% |
31,768 |
32,036 |
| 20% |
19.9% |
21,179 |
21,082 |
| 10% |
10.2% |
10,589 |
10,754 |
| Active Idle |
|
0 |
0 |
JVM 'localhost.localdomain.049' Scores:
| Target Load |
Actual Load |
ssj_ops |
| Target |
Actual |
| Calibration 1 |
|
|
105,814 |
| Calibration 2 |
|
|
103,965 |
| Calibration 3 |
|
|
104,336 |
| ssj_ops@calibrated=104,151 |
| 100% |
100.4% |
104,151 |
104,608 |
| 90% |
90.6% |
93,736 |
94,315 |
| 80% |
81.0% |
83,320 |
84,371 |
| 70% |
70.3% |
72,905 |
73,240 |
| 60% |
59.9% |
62,490 |
62,400 |
| 50% |
50.3% |
52,075 |
52,401 |
| 40% |
39.9% |
41,660 |
41,558 |
| 30% |
29.3% |
31,245 |
30,551 |
| 20% |
19.8% |
20,830 |
20,581 |
| 10% |
9.7% |
10,415 |
10,138 |
| Active Idle |
|
0 |
0 |
JVM 'localhost.localdomain.050' Scores:
| Target Load |
Actual Load |
ssj_ops |
| Target |
Actual |
| Calibration 1 |
|
|
106,411 |
| Calibration 2 |
|
|
104,629 |
| Calibration 3 |
|
|
105,107 |
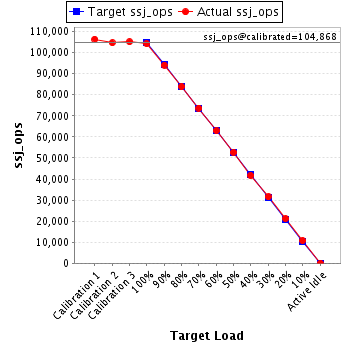
| ssj_ops@calibrated=104,868 |
| 100% |
99.4% |
104,868 |
104,224 |
| 90% |
89.7% |
94,381 |
94,073 |
| 80% |
79.9% |
83,894 |
83,819 |
| 70% |
70.3% |
73,407 |
73,721 |
| 60% |
60.0% |
62,921 |
62,935 |
| 50% |
50.3% |
52,434 |
52,790 |
| 40% |
39.7% |
41,947 |
41,625 |
| 30% |
30.1% |
31,460 |
31,525 |
| 20% |
20.2% |
20,974 |
21,167 |
| 10% |
10.3% |
10,487 |
10,775 |
| Active Idle |
|
0 |
0 |
JVM 'localhost.localdomain.051' Scores:
| Target Load |
Actual Load |
ssj_ops |
| Target |
Actual |
| Calibration 1 |
|
|
106,437 |
| Calibration 2 |
|
|
103,954 |
| Calibration 3 |
|
|
105,092 |
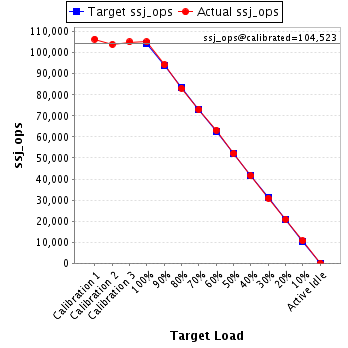
| ssj_ops@calibrated=104,523 |
| 100% |
100.6% |
104,523 |
105,147 |
| 90% |
90.2% |
94,071 |
94,287 |
| 80% |
79.6% |
83,618 |
83,150 |
| 70% |
69.8% |
73,166 |
73,002 |
| 60% |
60.4% |
62,714 |
63,151 |
| 50% |
49.9% |
52,261 |
52,148 |
| 40% |
39.7% |
41,809 |
41,479 |
| 30% |
29.6% |
31,357 |
30,917 |
| 20% |
20.0% |
20,905 |
20,907 |
| 10% |
10.2% |
10,452 |
10,662 |
| Active Idle |
|
0 |
0 |
JVM 'localhost.localdomain.052' Scores:
| Target Load |
Actual Load |
ssj_ops |
| Target |
Actual |
| Calibration 1 |
|
|
105,728 |
| Calibration 2 |
|
|
102,263 |
| Calibration 3 |
|
|
104,161 |
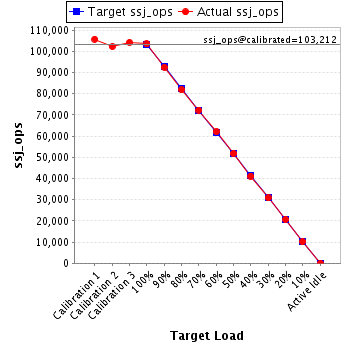
| ssj_ops@calibrated=103,212 |
| 100% |
100.2% |
103,212 |
103,459 |
| 90% |
89.6% |
92,891 |
92,492 |
| 80% |
79.3% |
82,570 |
81,827 |
| 70% |
70.0% |
72,249 |
72,289 |
| 60% |
60.1% |
61,927 |
62,068 |
| 50% |
50.1% |
51,606 |
51,700 |
| 40% |
39.9% |
41,285 |
41,166 |
| 30% |
29.8% |
30,964 |
30,800 |
| 20% |
20.0% |
20,642 |
20,683 |
| 10% |
9.9% |
10,321 |
10,175 |
| Active Idle |
|
0 |
0 |
JVM 'localhost.localdomain.053' Scores:
| Target Load |
Actual Load |
ssj_ops |
| Target |
Actual |
| Calibration 1 |
|
|
106,453 |
| Calibration 2 |
|
|
105,366 |
| Calibration 3 |
|
|
105,776 |
| ssj_ops@calibrated=105,571 |
| 100% |
99.4% |
105,571 |
104,900 |
| 90% |
89.9% |
95,014 |
94,944 |
| 80% |
80.4% |
84,457 |
84,903 |
| 70% |
70.8% |
73,900 |
74,787 |
| 60% |
59.9% |
63,343 |
63,204 |
| 50% |
50.0% |
52,786 |
52,800 |
| 40% |
40.2% |
42,229 |
42,451 |
| 30% |
29.9% |
31,671 |
31,527 |
| 20% |
20.5% |
21,114 |
21,662 |
| 10% |
9.6% |
10,557 |
10,163 |
| Active Idle |
|
0 |
0 |
JVM 'localhost.localdomain.054' Scores:
| Target Load |
Actual Load |
ssj_ops |
| Target |
Actual |
| Calibration 1 |
|
|
105,334 |
| Calibration 2 |
|
|
104,075 |
| Calibration 3 |
|
|
104,296 |
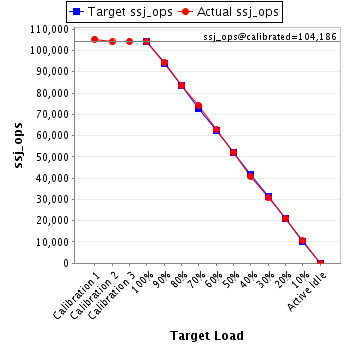
| ssj_ops@calibrated=104,186 |
| 100% |
100.0% |
104,186 |
104,236 |
| 90% |
90.6% |
93,767 |
94,379 |
| 80% |
80.3% |
83,349 |
83,653 |
| 70% |
71.1% |
72,930 |
74,119 |
| 60% |
60.2% |
62,511 |
62,769 |
| 50% |
50.0% |
52,093 |
52,121 |
| 40% |
39.1% |
41,674 |
40,779 |
| 30% |
29.6% |
31,256 |
30,804 |
| 20% |
20.0% |
20,837 |
20,850 |
| 10% |
10.1% |
10,419 |
10,479 |
| Active Idle |
|
0 |
0 |
JVM 'localhost.localdomain.055' Scores:
| Target Load |
Actual Load |
ssj_ops |
| Target |
Actual |
| Calibration 1 |
|
|
106,249 |
| Calibration 2 |
|
|
104,035 |
| Calibration 3 |
|
|
104,892 |
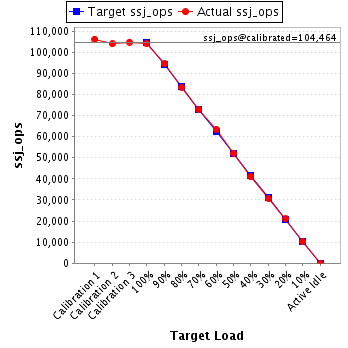
| ssj_ops@calibrated=104,464 |
| 100% |
99.7% |
104,464 |
104,162 |
| 90% |
90.5% |
94,017 |
94,564 |
| 80% |
80.0% |
83,571 |
83,567 |
| 70% |
69.8% |
73,125 |
72,958 |
| 60% |
60.8% |
62,678 |
63,471 |
| 50% |
50.0% |
52,232 |
52,181 |
| 40% |
39.3% |
41,785 |
41,102 |
| 30% |
29.5% |
31,339 |
30,868 |
| 20% |
20.1% |
20,893 |
20,986 |
| 10% |
9.8% |
10,446 |
10,279 |
| Active Idle |
|
0 |
0 |
JVM 'localhost.localdomain.056' Scores:
| Target Load |
Actual Load |
ssj_ops |
| Target |
Actual |
| Calibration 1 |
|
|
104,506 |
| Calibration 2 |
|
|
102,597 |
| Calibration 3 |
|
|
103,786 |
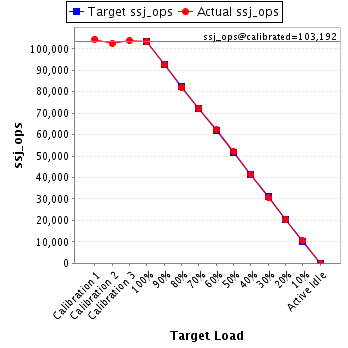
| ssj_ops@calibrated=103,192 |
| 100% |
100.2% |
103,192 |
103,385 |
| 90% |
89.6% |
92,873 |
92,483 |
| 80% |
79.5% |
82,553 |
82,058 |
| 70% |
70.1% |
72,234 |
72,306 |
| 60% |
60.3% |
61,915 |
62,181 |
| 50% |
50.5% |
51,596 |
52,142 |
| 40% |
39.9% |
41,277 |
41,217 |
| 30% |
29.7% |
30,958 |
30,667 |
| 20% |
19.9% |
20,638 |
20,546 |
| 10% |
10.1% |
10,319 |
10,421 |
| Active Idle |
|
0 |
0 |