SPECpower_ssj2008
Aggregate Performance Report
Copyright © 2007-2019 Standard Performance Evaluation Corporation
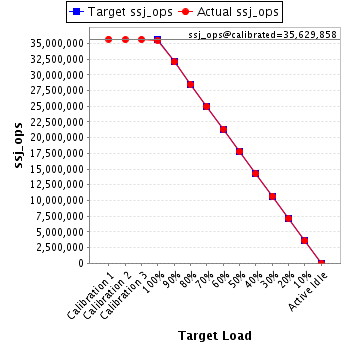
| Hewlett Packard Enterprise Synergy 480 Gen10 Compute Module | ssj_ops@100% = 35,518,206 ssj_ops@100% per Host = 5,919,701 ssj_ops@100% per JVM = 1,479,925 |
||||
| Test Sponsor: | Hewlett Packard Enterprise | SPEC License #: | 3 | Test Method: | Multi Node |
| Tested By: | Hewlett Packard Enterprise | Test Location: | Houston, TX, USA | Test Date: | Mar 12, 2019 |
| Hardware Availability: | Apr-2019 | Software Availability: | Mar-2019 | Publication: | Apr 2, 2019 |
| System Source: | Single Supplier | System Designation: | Server | Power Provisioning: | Line-powered |
| Target Load | Actual Load | ssj_ops | |
|---|---|---|---|
| Target | Actual | ||
| Calibration 1 | 35,687,107 | ||
| Calibration 2 | 35,618,403 | ||
| Calibration 3 | 35,641,313 | ||
| ssj_ops@calibrated=35,629,858 | |||
| 100% | 99.7% | 35,629,858 | 35,518,206 |
| 90% | 90.0% | 32,066,872 | 32,066,973 |
| 80% | 80.0% | 28,503,886 | 28,511,822 |
| 70% | 70.0% | 24,940,901 | 24,936,039 |
| 60% | 60.0% | 21,377,915 | 21,379,297 |
| 50% | 50.0% | 17,814,929 | 17,811,389 |
| 40% | 40.0% | 14,251,943 | 14,246,505 |
| 30% | 30.0% | 10,688,957 | 10,692,363 |
| 20% | 20.0% | 7,125,972 | 7,123,809 |
| 10% | 10.0% | 3,562,986 | 3,563,461 |
| Active Idle | 0 | 0 | |
| # of Nodes | # of Chips | # of Cores | # of Threads | Total RAM (GB) | # of OS Images | # of JVM Instances |
|---|---|---|---|---|---|---|
| 6 | 12 | 336 | 672 | 1,152 | 6 | 24 |
| Set Identifier: | SUT |
| Set Description: | System Under Test |
| # of Identical Nodes: | 6 |
| Comment: | SUT |
| Hardware per Node | |
|---|---|
| Hardware Vendor: | Hewlett Packard Enterprise |
| Model: | Synergy 480 Gen10 Compute Module |
| Form Factor: | blade |
| CPU Name: | Intel Xeon Platinum 8280 @ 2.70GHz |
| CPU Characteristics: | 28-Core, 2.70 GHz, 38.5MB L3 Cache |
| CPU Frequency (MHz): | 2700 |
| CPU(s) Enabled: | 56 cores, 2 chips, 28 cores/chip |
| Hardware Threads: | 112 (2 / core) |
| CPU(s) Orderable: | 1,2 chips |
| Primary Cache: | 32 KB I + 32 KB D on chip per core |
| Secondary Cache: | 1 MB I+D on chip per core |
| Tertiary Cache: | 39424 KB I+D on chip per chip |
| Other Cache: | None |
| Memory Amount (GB): | 192 |
| # and size of DIMM: | 12 x 16384 MB |
| Memory Details: | 12 x 16GB 2Rx8 PC4-2933Y-R; slots 1, 3, 5, 8, 10 and 12 populated on each socket |
| Power Supply Quantity and Rating (W): | None |
| Power Supply Details: | N/A |
| Disk Drive: | 1 x HPE 480GB SATA 6G M.2 2280 (875498-B21) |
| Disk Controller: | HPE Smart Array S100i SR Gen10 |
| # and type of Network Interface Cards (NICs) Installed: | 1 x HPE Synergy 3820C 10/20Gb CNA |
| NICs Enabled in Firmware / OS / Connected: | 2/2/1 |
| Network Speed (Mbit): | 1000 |
| Keyboard: | None |
| Mouse: | None |
| Monitor: | None |
| Optical Drives: | No |
| Other Hardware: | None |
| Software per Node | |
|---|---|
| Power Management: | Enabled (see SUT Notes) |
| Operating System (OS): | SUSE Linux Enterprise Server 12 SP4 |
| OS Version: | 4.12.14-94.41-default |
| Filesystem: | xfs |
| JVM Vendor: | Oracle Corporation |
| JVM Version: | Oracle Java HotSpot(TM) 64-Bit Server VM (build 24.80-b11, mixed mode), version 1.7.0_80 |
| JVM Command-line Options: | -server -Xmn19g -Xms21g -Xmx21g -XX:SurvivorRatio=1 -XX:TargetSurvivorRatio=99 -XX:AllocatePrefetchDistance=384 -XX:AllocatePrefetchLines=4 -XX:LoopUnrollLimit=37 -XX:InitialTenuringThreshold=12 -XX:MaxTenuringThreshold=15 -XX:ParallelGCThreads=28 -XX:InlineSmallCode=3900 -XX:MaxInlineSize=270 -XX:FreqInlineSize=2500 -XX:+AggressiveOpts -XX:+UseLargePages -XX:+UseParallelOldGC |
| JVM Affinity: | numactl --cpunodebind=[0-3] --localalloc |
| JVM Instances: | 4 |
| JVM Initial Heap (MB): | 21000 |
| JVM Maximum Heap (MB): | 21000 |
| JVM Address Bits: | 64 |
| Boot Firmware Version: | I42 v2.00 (02/02/2019) |
| Management Firmware Version: | 1.40 Feb 05 2019 |
| Workload Version: | SSJ 1.2.10 |
| Director Location: | Controller |
| Other Software: | HPE Service Pack for ProLiant (SPP) - Version 2019.03.0 (Mar 2019) |
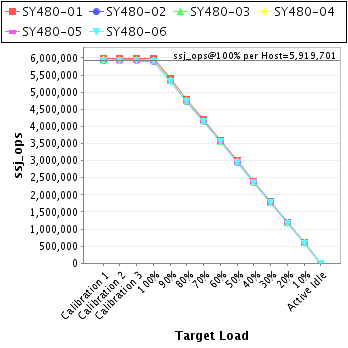
| Host | ssj_ops@100% |
|---|---|
| SY480-01 | 5,974,315 |
| SY480-02 | 5,902,088 |
| SY480-03 | 5,920,959 |
| SY480-04 | 5,917,189 |
| SY480-05 | 5,900,880 |
| SY480-06 | 5,902,773 |
| ssj_ops@100% | 35,518,206 |
| ssj_ops@100% per Host | 5,919,701 |
| ssj_ops@100% per JVM | 1,479,925 |
| Target Load | Actual Load | ssj_ops | |
|---|---|---|---|
| Target | Actual | ||
| Calibration 1 | 5,992,870 | ||
| Calibration 2 | 5,987,594 | ||
| Calibration 3 | 5,992,068 | ||
| ssj_ops@calibrated=5,989,831 | |||
| 100% | 99.7% | 5,989,831 | 5,974,315 |
| 90% | 90.0% | 5,390,848 | 5,392,338 |
| 80% | 80.1% | 4,791,865 | 4,794,987 |
| 70% | 70.0% | 4,192,881 | 4,194,302 |
| 60% | 59.9% | 3,593,898 | 3,589,944 |
| 50% | 50.0% | 2,994,915 | 2,993,037 |
| 40% | 40.0% | 2,395,932 | 2,395,228 |
| 30% | 30.0% | 1,796,949 | 1,798,463 |
| 20% | 20.0% | 1,197,966 | 1,200,878 |
| 10% | 10.0% | 598,983 | 598,625 |
| Active Idle | 0 | 0 | |

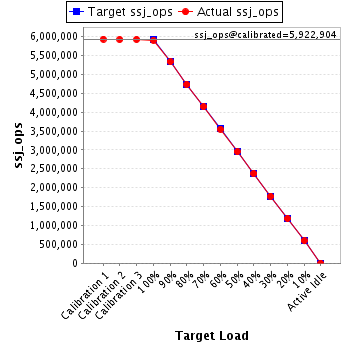
| Target Load | Actual Load | ssj_ops | |
|---|---|---|---|
| Target | Actual | ||
| Calibration 1 | 5,930,365 | ||
| Calibration 2 | 5,921,133 | ||
| Calibration 3 | 5,924,675 | ||
| ssj_ops@calibrated=5,922,904 | |||
| 100% | 99.6% | 5,922,904 | 5,902,088 |
| 90% | 90.0% | 5,330,614 | 5,331,129 |
| 80% | 79.9% | 4,738,323 | 4,733,116 |
| 70% | 70.0% | 4,146,033 | 4,146,301 |
| 60% | 60.0% | 3,553,742 | 3,551,224 |
| 50% | 49.9% | 2,961,452 | 2,952,669 |
| 40% | 40.1% | 2,369,162 | 2,372,833 |
| 30% | 30.0% | 1,776,871 | 1,776,970 |
| 20% | 20.0% | 1,184,581 | 1,185,729 |
| 10% | 10.1% | 592,290 | 595,556 |
| Active Idle | 0 | 0 | |
| Target Load | Actual Load | ssj_ops | |
|---|---|---|---|
| Target | Actual | ||
| Calibration 1 | 5,956,290 | ||
| Calibration 2 | 5,945,490 | ||
| Calibration 3 | 5,947,721 | ||
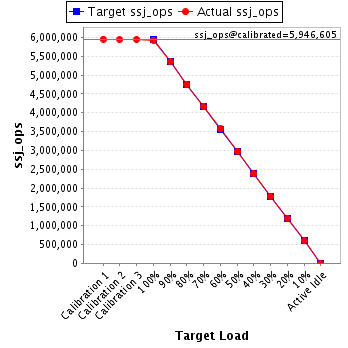
| ssj_ops@calibrated=5,946,605 | |||
| 100% | 99.6% | 5,946,605 | 5,920,959 |
| 90% | 90.0% | 5,351,945 | 5,351,891 |
| 80% | 80.0% | 4,757,284 | 4,757,735 |
| 70% | 70.0% | 4,162,624 | 4,162,705 |
| 60% | 60.1% | 3,567,963 | 3,571,510 |
| 50% | 50.1% | 2,973,303 | 2,977,006 |
| 40% | 40.0% | 2,378,642 | 2,377,011 |
| 30% | 30.0% | 1,783,982 | 1,786,090 |
| 20% | 20.0% | 1,189,321 | 1,188,122 |
| 10% | 10.0% | 594,661 | 593,937 |
| Active Idle | 0 | 0 | |
| Target Load | Actual Load | ssj_ops | |
|---|---|---|---|
| Target | Actual | ||
| Calibration 1 | 5,941,193 | ||
| Calibration 2 | 5,933,277 | ||
| Calibration 3 | 5,938,028 | ||
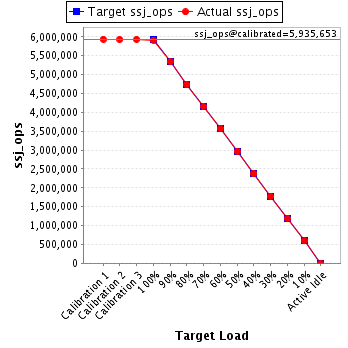
| ssj_ops@calibrated=5,935,653 | |||
| 100% | 99.7% | 5,935,653 | 5,917,189 |
| 90% | 90.1% | 5,342,087 | 5,347,327 |
| 80% | 80.0% | 4,748,522 | 4,749,403 |
| 70% | 69.9% | 4,154,957 | 4,149,531 |
| 60% | 60.1% | 3,561,392 | 3,566,163 |
| 50% | 50.1% | 2,967,826 | 2,973,083 |
| 40% | 39.9% | 2,374,261 | 2,368,284 |
| 30% | 30.0% | 1,780,696 | 1,778,963 |
| 20% | 20.0% | 1,187,131 | 1,187,184 |
| 10% | 10.0% | 593,565 | 592,174 |
| Active Idle | 0 | 0 | |
| Target Load | Actual Load | ssj_ops | |
|---|---|---|---|
| Target | Actual | ||
| Calibration 1 | 5,932,853 | ||
| Calibration 2 | 5,915,294 | ||
| Calibration 3 | 5,922,811 | ||
| ssj_ops@calibrated=5,919,053 | |||
| 100% | 99.7% | 5,919,053 | 5,900,880 |
| 90% | 89.9% | 5,327,147 | 5,319,210 |
| 80% | 80.1% | 4,735,242 | 4,739,822 |
| 70% | 70.0% | 4,143,337 | 4,144,918 |
| 60% | 60.0% | 3,551,432 | 3,552,854 |
| 50% | 50.0% | 2,959,526 | 2,959,686 |
| 40% | 40.0% | 2,367,621 | 2,367,910 |
| 30% | 30.0% | 1,775,716 | 1,774,925 |
| 20% | 20.0% | 1,183,811 | 1,185,392 |
| 10% | 10.0% | 591,905 | 591,168 |
| Active Idle | 0 | 0 | |

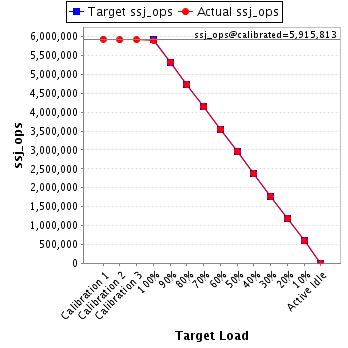
| Target Load | Actual Load | ssj_ops | |
|---|---|---|---|
| Target | Actual | ||
| Calibration 1 | 5,933,536 | ||
| Calibration 2 | 5,915,615 | ||
| Calibration 3 | 5,916,010 | ||
| ssj_ops@calibrated=5,915,813 | |||
| 100% | 99.8% | 5,915,813 | 5,902,773 |
| 90% | 90.0% | 5,324,231 | 5,325,077 |
| 80% | 80.1% | 4,732,650 | 4,736,760 |
| 70% | 70.0% | 4,141,069 | 4,138,282 |
| 60% | 60.0% | 3,549,488 | 3,547,602 |
| 50% | 50.0% | 2,957,906 | 2,955,908 |
| 40% | 40.0% | 2,366,325 | 2,365,239 |
| 30% | 30.0% | 1,774,744 | 1,776,952 |
| 20% | 19.9% | 1,183,163 | 1,176,503 |
| 10% | 10.0% | 591,581 | 592,001 |
| Active Idle | 0 | 0 | |