SPECpower_ssj2008
Aggregate Performance Report
Copyright © 2007-2019 Standard Performance Evaluation Corporation
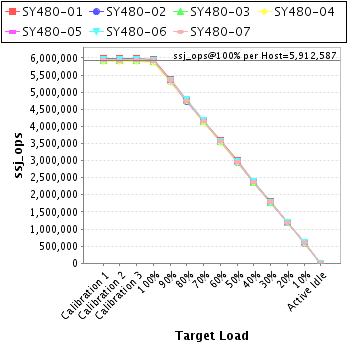
| Hewlett Packard Enterprise Synergy 480 Gen10 Compute Module | ssj_ops@100% = 41,388,106 ssj_ops@100% per Host = 5,912,587 ssj_ops@100% per JVM = 1,478,147 |
||||
| Test Sponsor: | Hewlett Packard Enterprise | SPEC License #: | 3 | Test Method: | Multi Node |
| Tested By: | Hewlett Packard Enterprise | Test Location: | Houston, TX, USA | Test Date: | Mar 12, 2019 |
| Hardware Availability: | Apr-2019 | Software Availability: | Mar-2019 | Publication: | Apr 2, 2019 |
| System Source: | Single Supplier | System Designation: | Server | Power Provisioning: | Line-powered |
| Target Load | Actual Load | ssj_ops | |
|---|---|---|---|
| Target | Actual | ||
| Calibration 1 | 41,571,373 | ||
| Calibration 2 | 41,486,361 | ||
| Calibration 3 | 41,529,522 | ||
| ssj_ops@calibrated=41,507,941 | |||
| 100% | 99.7% | 41,507,941 | 41,388,106 |
| 90% | 90.0% | 37,357,147 | 37,354,977 |
| 80% | 80.2% | 33,206,353 | 33,292,712 |
| 70% | 70.0% | 29,055,559 | 29,048,358 |
| 60% | 60.0% | 24,904,765 | 24,899,026 |
| 50% | 50.0% | 20,753,971 | 20,753,242 |
| 40% | 40.0% | 16,603,177 | 16,603,893 |
| 30% | 30.0% | 12,452,382 | 12,452,936 |
| 20% | 20.0% | 8,301,588 | 8,316,566 |
| 10% | 10.0% | 4,150,794 | 4,148,444 |
| Active Idle | 0 | 0 | |

| # of Nodes | # of Chips | # of Cores | # of Threads | Total RAM (GB) | # of OS Images | # of JVM Instances |
|---|---|---|---|---|---|---|
| 7 | 14 | 392 | 784 | 1,344 | 7 | 28 |
| Set Identifier: | SUT |
| Set Description: | System Under Test |
| # of Identical Nodes: | 7 |
| Comment: | SUT |
| Hardware per Node | |
|---|---|
| Hardware Vendor: | Hewlett Packard Enterprise |
| Model: | Synergy 480 Gen10 Compute Module |
| Form Factor: | blade |
| CPU Name: | Intel Xeon Platinum 8280 @ 2.70GHz |
| CPU Characteristics: | 28-Core, 2.70 GHz, 38.5MB L3 Cache |
| CPU Frequency (MHz): | 2700 |
| CPU(s) Enabled: | 56 cores, 2 chips, 28 cores/chip |
| Hardware Threads: | 112 (2 / core) |
| CPU(s) Orderable: | 1,2 chips |
| Primary Cache: | 32 KB I + 32 KB D on chip per core |
| Secondary Cache: | 1 MB I+D on chip per core |
| Tertiary Cache: | 39424 KB I+D on chip per chip |
| Other Cache: | None |
| Memory Amount (GB): | 192 |
| # and size of DIMM: | 12 x 16384 MB |
| Memory Details: | 12 x 16GB 2Rx8 PC4-2933Y-R; slots 1, 3, 5, 8, 10 and 12 populated on each socket |
| Power Supply Quantity and Rating (W): | None |
| Power Supply Details: | N/A |
| Disk Drive: | 1 x HPE 480GB SATA 6G M.2 2280 (875498-B21) |
| Disk Controller: | HPE Smart Array S100i SR Gen10 |
| # and type of Network Interface Cards (NICs) Installed: | 1 x HPE Synergy 3820C 10/20Gb CNA |
| NICs Enabled in Firmware / OS / Connected: | 2/2/1 |
| Network Speed (Mbit): | 1000 |
| Keyboard: | None |
| Mouse: | None |
| Monitor: | None |
| Optical Drives: | No |
| Other Hardware: | None |
| Software per Node | |
|---|---|
| Power Management: | Enabled (see SUT Notes) |
| Operating System (OS): | SUSE Linux Enterprise Server 12 SP4 |
| OS Version: | 4.12.14-94.41-default |
| Filesystem: | xfs |
| JVM Vendor: | Oracle Corporation |
| JVM Version: | Oracle Java HotSpot(TM) 64-Bit Server VM (build 24.80-b11, mixed mode), version 1.7.0_80 |
| JVM Command-line Options: | -server -Xmn19g -Xms21g -Xmx21g -XX:SurvivorRatio=1 -XX:TargetSurvivorRatio=99 -XX:AllocatePrefetchDistance=384 -XX:AllocatePrefetchLines=4 -XX:LoopUnrollLimit=37 -XX:InitialTenuringThreshold=12 -XX:MaxTenuringThreshold=15 -XX:ParallelGCThreads=28 -XX:InlineSmallCode=3900 -XX:MaxInlineSize=270 -XX:FreqInlineSize=2500 -XX:+AggressiveOpts -XX:+UseLargePages -XX:+UseParallelOldGC |
| JVM Affinity: | numactl --cpunodebind=[0-3] --localalloc |
| JVM Instances: | 4 |
| JVM Initial Heap (MB): | 21000 |
| JVM Maximum Heap (MB): | 21000 |
| JVM Address Bits: | 64 |
| Boot Firmware Version: | I42 v2.00 (02/02/2019) |
| Management Firmware Version: | 1.40 Feb 05 2019 |
| Workload Version: | SSJ 1.2.10 |
| Director Location: | Controller |
| Other Software: | HPE Service Pack for ProLiant (SPP) - Version 2019.03.0 (Mar 2019) |
| Host | ssj_ops@100% |
|---|---|
| SY480-01 | 5,964,346 |
| SY480-02 | 5,888,706 |
| SY480-03 | 5,906,230 |
| SY480-04 | 5,868,643 |
| SY480-05 | 5,915,993 |
| SY480-06 | 5,936,659 |
| SY480-07 | 5,907,530 |
| ssj_ops@100% | 41,388,106 |
| ssj_ops@100% per Host | 5,912,587 |
| ssj_ops@100% per JVM | 1,478,147 |
| Target Load | Actual Load | ssj_ops | |
|---|---|---|---|
| Target | Actual | ||
| Calibration 1 | 5,991,850 | ||
| Calibration 2 | 5,974,618 | ||
| Calibration 3 | 5,980,818 | ||
| ssj_ops@calibrated=5,977,718 | |||
| 100% | 99.8% | 5,977,718 | 5,964,346 |
| 90% | 89.9% | 5,379,946 | 5,374,025 |
| 80% | 80.1% | 4,782,175 | 4,788,149 |
| 70% | 69.9% | 4,184,403 | 4,178,485 |
| 60% | 60.0% | 3,586,631 | 3,586,892 |
| 50% | 50.0% | 2,988,859 | 2,988,086 |
| 40% | 40.0% | 2,391,087 | 2,390,781 |
| 30% | 30.0% | 1,793,315 | 1,791,395 |
| 20% | 20.1% | 1,195,544 | 1,200,122 |
| 10% | 10.0% | 597,772 | 596,602 |
| Active Idle | 0 | 0 | |

| Target Load | Actual Load | ssj_ops | |
|---|---|---|---|
| Target | Actual | ||
| Calibration 1 | 5,914,898 | ||
| Calibration 2 | 5,911,978 | ||
| Calibration 3 | 5,910,397 | ||
| ssj_ops@calibrated=5,911,188 | |||
| 100% | 99.6% | 5,911,188 | 5,888,706 |
| 90% | 90.1% | 5,320,069 | 5,324,128 |
| 80% | 80.0% | 4,728,950 | 4,730,683 |
| 70% | 70.0% | 4,137,831 | 4,135,323 |
| 60% | 60.0% | 3,546,713 | 3,545,174 |
| 50% | 50.0% | 2,955,594 | 2,957,486 |
| 40% | 40.0% | 2,364,475 | 2,367,361 |
| 30% | 30.0% | 1,773,356 | 1,773,704 |
| 20% | 20.1% | 1,182,238 | 1,185,614 |
| 10% | 10.0% | 591,119 | 591,801 |
| Active Idle | 0 | 0 | |

| Target Load | Actual Load | ssj_ops | |
|---|---|---|---|
| Target | Actual | ||
| Calibration 1 | 5,936,135 | ||
| Calibration 2 | 5,920,887 | ||
| Calibration 3 | 5,925,336 | ||
| ssj_ops@calibrated=5,923,112 | |||
| 100% | 99.7% | 5,923,112 | 5,906,230 |
| 90% | 90.0% | 5,330,801 | 5,329,620 |
| 80% | 80.1% | 4,738,489 | 4,741,793 |
| 70% | 69.9% | 4,146,178 | 4,141,982 |
| 60% | 59.9% | 3,553,867 | 3,549,057 |
| 50% | 50.0% | 2,961,556 | 2,964,209 |
| 40% | 40.0% | 2,369,245 | 2,367,796 |
| 30% | 30.0% | 1,776,934 | 1,777,282 |
| 20% | 20.0% | 1,184,622 | 1,186,663 |
| 10% | 10.0% | 592,311 | 592,076 |
| Active Idle | 0 | 0 | |

| Target Load | Actual Load | ssj_ops | |
|---|---|---|---|
| Target | Actual | ||
| Calibration 1 | 5,900,877 | ||
| Calibration 2 | 5,884,254 | ||
| Calibration 3 | 5,893,787 | ||
| ssj_ops@calibrated=5,889,021 | |||
| 100% | 99.7% | 5,889,021 | 5,868,643 |
| 90% | 89.9% | 5,300,119 | 5,295,887 |
| 80% | 80.6% | 4,711,217 | 4,745,517 |
| 70% | 70.1% | 4,122,314 | 4,126,494 |
| 60% | 60.0% | 3,533,412 | 3,534,111 |
| 50% | 50.0% | 2,944,510 | 2,943,882 |
| 40% | 40.0% | 2,355,608 | 2,357,074 |
| 30% | 30.0% | 1,766,706 | 1,767,398 |
| 20% | 20.0% | 1,177,804 | 1,179,158 |
| 10% | 10.0% | 588,902 | 587,284 |
| Active Idle | 0 | 0 | |

| Target Load | Actual Load | ssj_ops | |
|---|---|---|---|
| Target | Actual | ||
| Calibration 1 | 5,938,571 | ||
| Calibration 2 | 5,925,105 | ||
| Calibration 3 | 5,937,162 | ||
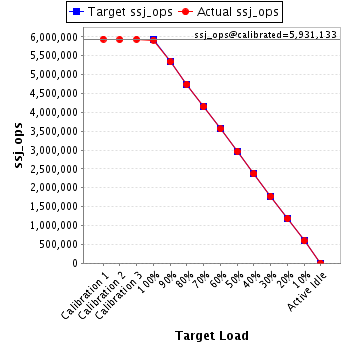
| ssj_ops@calibrated=5,931,133 | |||
| 100% | 99.7% | 5,931,133 | 5,915,993 |
| 90% | 90.0% | 5,338,020 | 5,338,545 |
| 80% | 79.9% | 4,744,907 | 4,741,820 |
| 70% | 70.0% | 4,151,793 | 4,151,855 |
| 60% | 60.0% | 3,558,680 | 3,558,704 |
| 50% | 50.0% | 2,965,567 | 2,965,308 |
| 40% | 40.0% | 2,372,453 | 2,369,803 |
| 30% | 30.0% | 1,779,340 | 1,776,853 |
| 20% | 20.0% | 1,186,227 | 1,187,107 |
| 10% | 10.0% | 593,113 | 592,973 |
| Active Idle | 0 | 0 | |
| Target Load | Actual Load | ssj_ops | |
|---|---|---|---|
| Target | Actual | ||
| Calibration 1 | 5,962,062 | ||
| Calibration 2 | 5,946,511 | ||
| Calibration 3 | 5,950,303 | ||
| ssj_ops@calibrated=5,948,407 | |||
| 100% | 99.8% | 5,948,407 | 5,936,659 |
| 90% | 89.9% | 5,353,566 | 5,350,126 |
| 80% | 80.7% | 4,758,726 | 4,798,333 |
| 70% | 70.1% | 4,163,885 | 4,167,709 |
| 60% | 59.9% | 3,569,044 | 3,562,643 |
| 50% | 50.0% | 2,974,203 | 2,974,105 |
| 40% | 40.0% | 2,379,363 | 2,380,455 |
| 30% | 30.0% | 1,784,522 | 1,784,660 |
| 20% | 20.0% | 1,189,681 | 1,192,427 |
| 10% | 10.0% | 594,841 | 593,980 |
| Active Idle | 0 | 0 | |

| Target Load | Actual Load | ssj_ops | |
|---|---|---|---|
| Target | Actual | ||
| Calibration 1 | 5,926,980 | ||
| Calibration 2 | 5,923,008 | ||
| Calibration 3 | 5,931,718 | ||
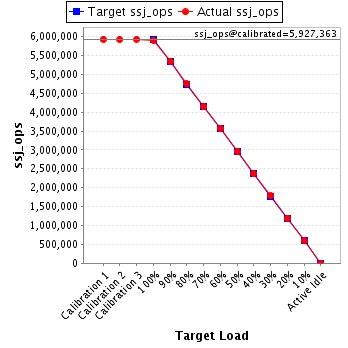
| ssj_ops@calibrated=5,927,363 | |||
| 100% | 99.7% | 5,927,363 | 5,907,530 |
| 90% | 90.1% | 5,334,627 | 5,342,645 |
| 80% | 80.1% | 4,741,890 | 4,746,416 |
| 70% | 70.0% | 4,149,154 | 4,146,509 |
| 60% | 60.1% | 3,556,418 | 3,562,444 |
| 50% | 49.9% | 2,963,681 | 2,960,166 |
| 40% | 40.0% | 2,370,945 | 2,370,623 |
| 30% | 30.1% | 1,778,209 | 1,781,644 |
| 20% | 20.0% | 1,185,473 | 1,185,475 |
| 10% | 10.0% | 592,736 | 593,728 |
| Active Idle | 0 | 0 | |