
SPECpower_ssj2008
Aggregate Performance Report
Copyright © 2007-2019 Standard Performance Evaluation Corporation
| Hewlett Packard Enterprise Synergy 480 Gen10 Compute Module | ssj_ops@100% = 71,225,314 ssj_ops@100% per Host = 5,935,443 ssj_ops@100% per JVM = 1,483,861 |
||||
| Test Sponsor: | Hewlett Packard Enterprise | SPEC License #: | 3 | Test Method: | Multi Node |
| Tested By: | Hewlett Packard Enterprise | Test Location: | Houston, TX, USA | Test Date: | Mar 12, 2019 |
| Hardware Availability: | Apr-2019 | Software Availability: | Mar-2019 | Publication: | Apr 2, 2019 |
| System Source: | Single Supplier | System Designation: | Server | Power Provisioning: | Line-powered |
| Target Load | Actual Load | ssj_ops | |
|---|---|---|---|
| Target | Actual | ||
| Calibration 1 | 71,524,445 | ||
| Calibration 2 | 71,396,572 | ||
| Calibration 3 | 71,460,828 | ||
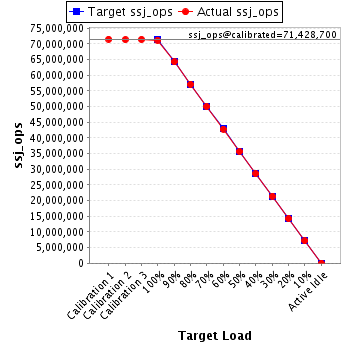
| ssj_ops@calibrated=71,428,700 | |||
| 100% | 99.7% | 71,428,700 | 71,225,314 |
| 90% | 90.0% | 64,285,830 | 64,263,294 |
| 80% | 80.0% | 57,142,960 | 57,143,782 |
| 70% | 70.1% | 50,000,090 | 50,048,033 |
| 60% | 60.0% | 42,857,220 | 42,844,526 |
| 50% | 50.0% | 35,714,350 | 35,696,723 |
| 40% | 40.0% | 28,571,480 | 28,584,190 |
| 30% | 30.0% | 21,428,610 | 21,426,050 |
| 20% | 20.0% | 14,285,740 | 14,283,904 |
| 10% | 10.0% | 7,142,870 | 7,140,982 |
| Active Idle | 0 | 0 | |
| # of Nodes | # of Chips | # of Cores | # of Threads | Total RAM (GB) | # of OS Images | # of JVM Instances |
|---|---|---|---|---|---|---|
| 12 | 24 | 672 | 1,344 | 2,304 | 12 | 48 |
| Set Identifier: | SUT |
| Set Description: | System Under Test |
| # of Identical Nodes: | 12 |
| Comment: | SUT |
| Hardware per Node | |
|---|---|
| Hardware Vendor: | Hewlett Packard Enterprise |
| Model: | Synergy 480 Gen10 Compute Module |
| Form Factor: | blade |
| CPU Name: | Intel Xeon Platinum 8280 @ 2.70GHz |
| CPU Characteristics: | 28-Core, 2.70 GHz, 38.5MB L3 Cache |
| CPU Frequency (MHz): | 2700 |
| CPU(s) Enabled: | 56 cores, 2 chips, 28 cores/chip |
| Hardware Threads: | 112 (2 / core) |
| CPU(s) Orderable: | 1,2 chips |
| Primary Cache: | 32 KB I + 32 KB D on chip per core |
| Secondary Cache: | 1 MB I+D on chip per core |
| Tertiary Cache: | 39424 KB I+D on chip per chip |
| Other Cache: | None |
| Memory Amount (GB): | 192 |
| # and size of DIMM: | 12 x 16384 MB |
| Memory Details: | 12 x 16GB 2Rx8 PC4-2933Y-R; slots 1, 3, 5, 8, 10 and 12 populated on each socket |
| Power Supply Quantity and Rating (W): | None |
| Power Supply Details: | N/A |
| Disk Drive: | 1 x HPE 480GB SATA 6G M.2 2280 (875498-B21) |
| Disk Controller: | HPE Smart Array S100i SR Gen10 |
| # and type of Network Interface Cards (NICs) Installed: | 1 x HPE Synergy 3820C 10/20Gb CNA |
| NICs Enabled in Firmware / OS / Connected: | 2/2/1 |
| Network Speed (Mbit): | 1000 |
| Keyboard: | None |
| Mouse: | None |
| Monitor: | None |
| Optical Drives: | No |
| Other Hardware: | None |
| Software per Node | |
|---|---|
| Power Management: | Enabled (see SUT Notes) |
| Operating System (OS): | SUSE Linux Enterprise Server 12 SP4 |
| OS Version: | 4.12.14-94.41-default |
| Filesystem: | xfs |
| JVM Vendor: | Oracle Corporation |
| JVM Version: | Oracle Java HotSpot(TM) 64-Bit Server VM (build 24.80-b11, mixed mode), version 1.7.0_80 |
| JVM Command-line Options: | -server -Xmn19g -Xms21g -Xmx21g -XX:SurvivorRatio=1 -XX:TargetSurvivorRatio=99 -XX:AllocatePrefetchDistance=384 -XX:AllocatePrefetchLines=4 -XX:LoopUnrollLimit=37 -XX:InitialTenuringThreshold=12 -XX:MaxTenuringThreshold=15 -XX:ParallelGCThreads=28 -XX:InlineSmallCode=3900 -XX:MaxInlineSize=270 -XX:FreqInlineSize=2500 -XX:+AggressiveOpts -XX:+UseLargePages -XX:+UseParallelOldGC |
| JVM Affinity: | numactl --cpunodebind=[0-3] --localalloc |
| JVM Instances: | 4 |
| JVM Initial Heap (MB): | 21000 |
| JVM Maximum Heap (MB): | 21000 |
| JVM Address Bits: | 64 |
| Boot Firmware Version: | I42 v2.00 (02/02/2019) |
| Management Firmware Version: | 1.40 Feb 05 2019 |
| Workload Version: | SSJ 1.2.10 |
| Director Location: | Controller |
| Other Software: | HPE Service Pack for ProLiant (SPP) - Version 2019.03.0 (Mar 2019) |
| Host | ssj_ops@100% |
|---|---|
| SY480-01 | 5,935,987 |
| SY480-02 | 5,948,473 |
| SY480-03 | 5,938,134 |
| SY480-04 | 5,925,759 |
| SY480-05 | 5,919,002 |
| SY480-06 | 5,930,583 |
| SY480-07 | 5,951,111 |
| SY480-08 | 5,920,670 |
| SY480-09 | 5,940,917 |
| SY480-10 | 5,934,220 |
| SY480-11 | 5,932,149 |
| SY480-12 | 5,948,308 |
| ssj_ops@100% | 71,225,314 |
| ssj_ops@100% per Host | 5,935,443 |
| ssj_ops@100% per JVM | 1,483,861 |
| Target Load | Actual Load | ssj_ops | |
|---|---|---|---|
| Target | Actual | ||
| Calibration 1 | 5,958,988 | ||
| Calibration 2 | 5,952,015 | ||
| Calibration 3 | 5,955,710 | ||
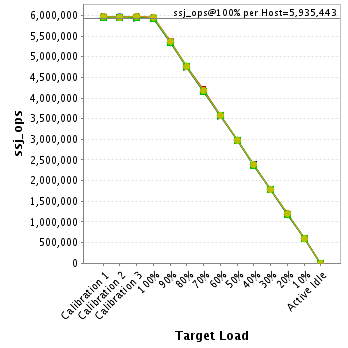
| ssj_ops@calibrated=5,953,862 | |||
| 100% | 99.7% | 5,953,862 | 5,935,987 |
| 90% | 90.1% | 5,358,476 | 5,361,474 |
| 80% | 80.0% | 4,763,090 | 4,763,366 |
| 70% | 69.9% | 4,167,704 | 4,164,112 |
| 60% | 59.9% | 3,572,317 | 3,564,922 |
| 50% | 50.0% | 2,976,931 | 2,978,847 |
| 40% | 40.1% | 2,381,545 | 2,386,900 |
| 30% | 30.0% | 1,786,159 | 1,787,404 |
| 20% | 19.9% | 1,190,772 | 1,185,757 |
| 10% | 10.0% | 595,386 | 593,528 |
| Active Idle | 0 | 0 | |

| Target Load | Actual Load | ssj_ops | |
|---|---|---|---|
| Target | Actual | ||
| Calibration 1 | 5,973,481 | ||
| Calibration 2 | 5,963,218 | ||
| Calibration 3 | 5,965,578 | ||
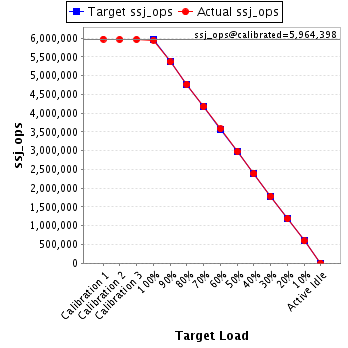
| ssj_ops@calibrated=5,964,398 | |||
| 100% | 99.7% | 5,964,398 | 5,948,473 |
| 90% | 90.0% | 5,367,958 | 5,368,551 |
| 80% | 79.9% | 4,771,518 | 4,768,144 |
| 70% | 70.1% | 4,175,078 | 4,180,680 |
| 60% | 60.0% | 3,578,639 | 3,580,674 |
| 50% | 50.0% | 2,982,199 | 2,979,575 |
| 40% | 40.0% | 2,385,759 | 2,386,638 |
| 30% | 30.0% | 1,789,319 | 1,790,517 |
| 20% | 20.0% | 1,192,880 | 1,191,390 |
| 10% | 10.0% | 596,440 | 596,027 |
| Active Idle | 0 | 0 | |
| Target Load | Actual Load | ssj_ops | |
|---|---|---|---|
| Target | Actual | ||
| Calibration 1 | 5,969,669 | ||
| Calibration 2 | 5,957,686 | ||
| Calibration 3 | 5,961,163 | ||
| ssj_ops@calibrated=5,959,424 | |||
| 100% | 99.6% | 5,959,424 | 5,938,134 |
| 90% | 90.0% | 5,363,482 | 5,363,991 |
| 80% | 80.3% | 4,767,539 | 4,784,238 |
| 70% | 70.0% | 4,171,597 | 4,173,967 |
| 60% | 60.0% | 3,575,654 | 3,572,847 |
| 50% | 50.1% | 2,979,712 | 2,984,419 |
| 40% | 40.1% | 2,383,770 | 2,389,325 |
| 30% | 30.0% | 1,787,827 | 1,786,050 |
| 20% | 20.1% | 1,191,885 | 1,194,983 |
| 10% | 10.1% | 595,942 | 599,184 |
| Active Idle | 0 | 0 | |

| Target Load | Actual Load | ssj_ops | |
|---|---|---|---|
| Target | Actual | ||
| Calibration 1 | 5,947,870 | ||
| Calibration 2 | 5,941,207 | ||
| Calibration 3 | 5,939,388 | ||
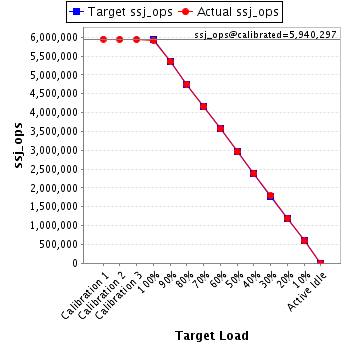
| ssj_ops@calibrated=5,940,297 | |||
| 100% | 99.8% | 5,940,297 | 5,925,759 |
| 90% | 90.0% | 5,346,268 | 5,347,298 |
| 80% | 80.1% | 4,752,238 | 4,756,478 |
| 70% | 70.0% | 4,158,208 | 4,158,634 |
| 60% | 60.0% | 3,564,178 | 3,564,570 |
| 50% | 49.9% | 2,970,149 | 2,962,171 |
| 40% | 40.1% | 2,376,119 | 2,383,291 |
| 30% | 30.1% | 1,782,089 | 1,785,523 |
| 20% | 20.0% | 1,188,059 | 1,188,660 |
| 10% | 10.0% | 594,030 | 594,372 |
| Active Idle | 0 | 0 | |
| Target Load | Actual Load | ssj_ops | |
|---|---|---|---|
| Target | Actual | ||
| Calibration 1 | 5,947,196 | ||
| Calibration 2 | 5,930,702 | ||
| Calibration 3 | 5,945,139 | ||
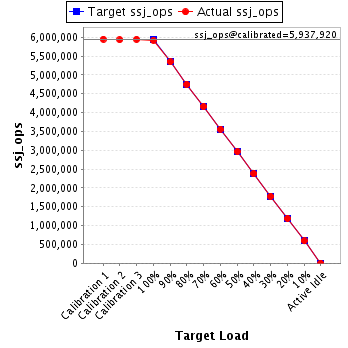
| ssj_ops@calibrated=5,937,920 | |||
| 100% | 99.7% | 5,937,920 | 5,919,002 |
| 90% | 90.0% | 5,344,128 | 5,345,610 |
| 80% | 80.0% | 4,750,336 | 4,748,748 |
| 70% | 70.1% | 4,156,544 | 4,160,249 |
| 60% | 60.0% | 3,562,752 | 3,562,254 |
| 50% | 49.9% | 2,968,960 | 2,964,021 |
| 40% | 40.0% | 2,375,168 | 2,376,786 |
| 30% | 29.9% | 1,781,376 | 1,778,273 |
| 20% | 20.0% | 1,187,584 | 1,187,159 |
| 10% | 10.0% | 593,792 | 593,179 |
| Active Idle | 0 | 0 | |
| Target Load | Actual Load | ssj_ops | |
|---|---|---|---|
| Target | Actual | ||
| Calibration 1 | 5,955,385 | ||
| Calibration 2 | 5,942,975 | ||
| Calibration 3 | 5,953,044 | ||
| ssj_ops@calibrated=5,948,009 | |||
| 100% | 99.7% | 5,948,009 | 5,930,583 |
| 90% | 90.0% | 5,353,208 | 5,350,685 |
| 80% | 80.0% | 4,758,407 | 4,758,462 |
| 70% | 70.0% | 4,163,606 | 4,162,012 |
| 60% | 60.0% | 3,568,806 | 3,566,430 |
| 50% | 50.0% | 2,974,005 | 2,976,202 |
| 40% | 40.1% | 2,379,204 | 2,382,522 |
| 30% | 30.0% | 1,784,403 | 1,783,629 |
| 20% | 20.0% | 1,189,602 | 1,188,110 |
| 10% | 10.0% | 594,801 | 593,073 |
| Active Idle | 0 | 0 | |

| Target Load | Actual Load | ssj_ops | |
|---|---|---|---|
| Target | Actual | ||
| Calibration 1 | 5,976,519 | ||
| Calibration 2 | 5,958,086 | ||
| Calibration 3 | 5,967,246 | ||
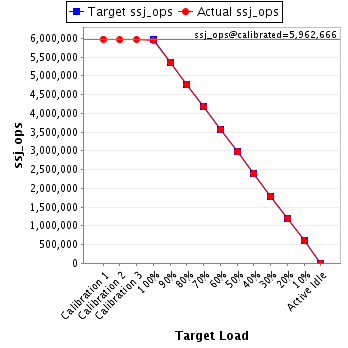
| ssj_ops@calibrated=5,962,666 | |||
| 100% | 99.8% | 5,962,666 | 5,951,111 |
| 90% | 89.9% | 5,366,399 | 5,363,389 |
| 80% | 79.9% | 4,770,133 | 4,766,995 |
| 70% | 70.0% | 4,173,866 | 4,173,277 |
| 60% | 60.0% | 3,577,600 | 3,576,817 |
| 50% | 49.8% | 2,981,333 | 2,970,770 |
| 40% | 40.0% | 2,385,066 | 2,383,930 |
| 30% | 29.9% | 1,788,800 | 1,785,515 |
| 20% | 20.0% | 1,192,533 | 1,190,019 |
| 10% | 10.0% | 596,267 | 597,831 |
| Active Idle | 0 | 0 | |
| Target Load | Actual Load | ssj_ops | |
|---|---|---|---|
| Target | Actual | ||
| Calibration 1 | 5,953,074 | ||
| Calibration 2 | 5,942,681 | ||
| Calibration 3 | 5,935,150 | ||
| ssj_ops@calibrated=5,938,916 | |||
| 100% | 99.7% | 5,938,916 | 5,920,670 |
| 90% | 89.9% | 5,345,024 | 5,336,496 |
| 80% | 79.9% | 4,751,133 | 4,746,875 |
| 70% | 70.2% | 4,157,241 | 4,166,263 |
| 60% | 59.9% | 3,563,349 | 3,559,517 |
| 50% | 50.0% | 2,969,458 | 2,970,829 |
| 40% | 39.9% | 2,375,566 | 2,371,424 |
| 30% | 30.0% | 1,781,675 | 1,782,336 |
| 20% | 20.0% | 1,187,783 | 1,188,371 |
| 10% | 10.0% | 593,892 | 594,264 |
| Active Idle | 0 | 0 | |

| Target Load | Actual Load | ssj_ops | |
|---|---|---|---|
| Target | Actual | ||
| Calibration 1 | 5,960,828 | ||
| Calibration 2 | 5,960,585 | ||
| Calibration 3 | 5,963,284 | ||
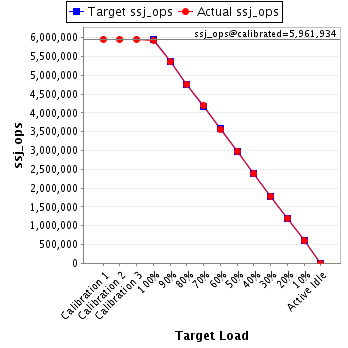
| ssj_ops@calibrated=5,961,934 | |||
| 100% | 99.6% | 5,961,934 | 5,940,917 |
| 90% | 89.8% | 5,365,741 | 5,356,690 |
| 80% | 79.9% | 4,769,547 | 4,762,397 |
| 70% | 70.4% | 4,173,354 | 4,195,914 |
| 60% | 59.9% | 3,577,160 | 3,571,854 |
| 50% | 50.0% | 2,980,967 | 2,980,026 |
| 40% | 39.9% | 2,384,774 | 2,378,656 |
| 30% | 30.0% | 1,788,580 | 1,787,002 |
| 20% | 20.0% | 1,192,387 | 1,195,133 |
| 10% | 10.1% | 596,193 | 599,774 |
| Active Idle | 0 | 0 | |
| Target Load | Actual Load | ssj_ops | |
|---|---|---|---|
| Target | Actual | ||
| Calibration 1 | 5,959,507 | ||
| Calibration 2 | 5,944,980 | ||
| Calibration 3 | 5,951,935 | ||
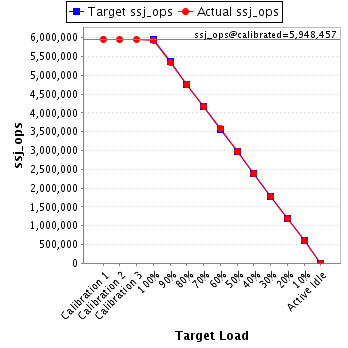
| ssj_ops@calibrated=5,948,457 | |||
| 100% | 99.8% | 5,948,457 | 5,934,220 |
| 90% | 90.0% | 5,353,612 | 5,352,286 |
| 80% | 80.0% | 4,758,766 | 4,758,448 |
| 70% | 70.0% | 4,163,920 | 4,165,106 |
| 60% | 60.0% | 3,569,074 | 3,570,675 |
| 50% | 50.0% | 2,974,229 | 2,972,152 |
| 40% | 40.0% | 2,379,383 | 2,378,509 |
| 30% | 30.0% | 1,784,537 | 1,783,561 |
| 20% | 20.0% | 1,189,691 | 1,189,401 |
| 10% | 10.0% | 594,846 | 593,058 |
| Active Idle | 0 | 0 | |
| Target Load | Actual Load | ssj_ops | |
|---|---|---|---|
| Target | Actual | ||
| Calibration 1 | 5,954,369 | ||
| Calibration 2 | 5,945,132 | ||
| Calibration 3 | 5,955,998 | ||
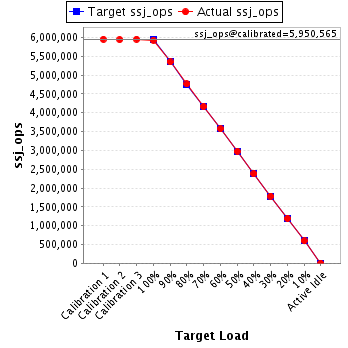
| ssj_ops@calibrated=5,950,565 | |||
| 100% | 99.7% | 5,950,565 | 5,932,149 |
| 90% | 89.9% | 5,355,509 | 5,349,754 |
| 80% | 80.1% | 4,760,452 | 4,764,841 |
| 70% | 70.0% | 4,165,396 | 4,165,723 |
| 60% | 60.0% | 3,570,339 | 3,571,945 |
| 50% | 50.0% | 2,975,283 | 2,976,288 |
| 40% | 39.9% | 2,380,226 | 2,375,305 |
| 30% | 30.0% | 1,785,170 | 1,787,295 |
| 20% | 20.0% | 1,190,113 | 1,189,498 |
| 10% | 10.0% | 595,057 | 594,127 |
| Active Idle | 0 | 0 | |
| Target Load | Actual Load | ssj_ops | |
|---|---|---|---|
| Target | Actual | ||
| Calibration 1 | 5,967,560 | ||
| Calibration 2 | 5,957,306 | ||
| Calibration 3 | 5,967,195 | ||
| ssj_ops@calibrated=5,962,250 | |||
| 100% | 99.8% | 5,962,250 | 5,948,308 |
| 90% | 90.0% | 5,366,025 | 5,367,070 |
| 80% | 79.9% | 4,769,800 | 4,764,790 |
| 70% | 70.1% | 4,173,575 | 4,182,094 |
| 60% | 60.1% | 3,577,350 | 3,582,020 |
| 50% | 50.0% | 2,981,125 | 2,981,421 |
| 40% | 40.1% | 2,384,900 | 2,390,902 |
| 30% | 30.0% | 1,788,675 | 1,788,943 |
| 20% | 20.0% | 1,192,450 | 1,195,422 |
| 10% | 9.9% | 596,225 | 592,566 |
| Active Idle | 0 | 0 | |
