SPECpower_ssj2008
Aggregate Performance Report
Copyright © 2007-2019 Standard Performance Evaluation Corporation
| Hewlett Packard Enterprise Synergy 660 Gen10 Compute Module | ssj_ops@100% = 35,391,846 ssj_ops@100% per Host = 11,797,282 ssj_ops@100% per JVM = 1,474,660 |
||||
| Test Sponsor: | Hewlett Packard Enterprise | SPEC License #: | 3 | Test Method: | Multi Node |
| Tested By: | Hewlett Packard Enterprise | Test Location: | Houston, TX, USA | Test Date: | Mar 10, 2019 |
| Hardware Availability: | Apr-2019 | Software Availability: | Mar-2019 | Publication: | Apr 2, 2019 |
| System Source: | Single Supplier | System Designation: | Server | Power Provisioning: | Line-powered |
| Target Load | Actual Load | ssj_ops | |
|---|---|---|---|
| Target | Actual | ||
| Calibration 1 | 35,631,235 | ||
| Calibration 2 | 35,479,209 | ||
| Calibration 3 | 35,504,883 | ||
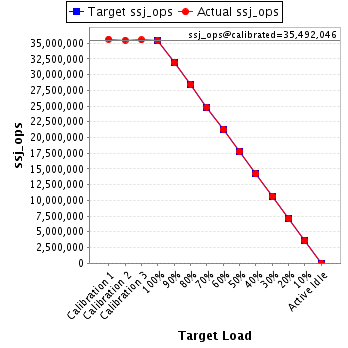
| ssj_ops@calibrated=35,492,046 | |||
| 100% | 99.7% | 35,492,046 | 35,391,846 |
| 90% | 89.9% | 31,942,841 | 31,919,450 |
| 80% | 80.1% | 28,393,637 | 28,416,688 |
| 70% | 70.0% | 24,844,432 | 24,830,205 |
| 60% | 60.0% | 21,295,227 | 21,283,680 |
| 50% | 50.0% | 17,746,023 | 17,744,971 |
| 40% | 40.0% | 14,196,818 | 14,194,969 |
| 30% | 30.0% | 10,647,614 | 10,646,675 |
| 20% | 20.0% | 7,098,409 | 7,098,184 |
| 10% | 10.0% | 3,549,205 | 3,554,101 |
| Active Idle | 0 | 0 | |
| # of Nodes | # of Chips | # of Cores | # of Threads | Total RAM (GB) | # of OS Images | # of JVM Instances |
|---|---|---|---|---|---|---|
| 3 | 12 | 336 | 672 | 1,152 | 3 | 24 |
| Set Identifier: | SUT |
| Set Description: | System Under Test |
| # of Identical Nodes: | 3 |
| Comment: | SUT |
| Hardware per Node | |
|---|---|
| Hardware Vendor: | Hewlett Packard Enterprise |
| Model: | Synergy 660 Gen10 Compute Module |
| Form Factor: | blade |
| CPU Name: | Intel Xeon Platinum 8280 @ 2.70GHz |
| CPU Characteristics: | 28-Core, 2.70 GHz, 38.5MB L3 Cache |
| CPU Frequency (MHz): | 2700 |
| CPU(s) Enabled: | 112 cores, 4 chips, 28 cores/chip |
| Hardware Threads: | 224 (2 / core) |
| CPU(s) Orderable: | 1,2,3,4 chips |
| Primary Cache: | 32 KB I + 32 KB D on chip per core |
| Secondary Cache: | 1 MB I+D on chip per core |
| Tertiary Cache: | 39424 KB I+D on chip per chip |
| Other Cache: | None |
| Memory Amount (GB): | 384 |
| # and size of DIMM: | 24 x 16384 MB |
| Memory Details: | 24 x 16GB 2Rx8 PC4-2933Y-R; slots 1, 3, 5, 8, 10 and 12 populated on each socket |
| Power Supply Quantity and Rating (W): | None |
| Power Supply Details: | N/A |
| Disk Drive: | 1 x HPE 480GB SATA 6G M.2 2280 (875498-B21) |
| Disk Controller: | HPE Smart Array S100i SR Gen10 |
| # and type of Network Interface Cards (NICs) Installed: | 1 x HPE Synergy 3820C 10/20Gb CNA |
| NICs Enabled in Firmware / OS / Connected: | 2/2/1 |
| Network Speed (Mbit): | 1000 |
| Keyboard: | None |
| Mouse: | None |
| Monitor: | None |
| Optical Drives: | No |
| Other Hardware: | None |
| Software per Node | |
|---|---|
| Power Management: | Enabled (see SUT Notes) |
| Operating System (OS): | SUSE Linux Enterprise Server 12 SP4 |
| OS Version: | 4.12.14-94.41-default |
| Filesystem: | NTFS |
| JVM Vendor: | Oracle Corporation |
| JVM Version: | Oracle Java HotSpot(TM) 64-Bit Server VM (build 24.80-b11, mixed mode), version 1.7.0_80 |
| JVM Command-line Options: | -server -Xmn19000m -Xms21000m -Xmx21000m -XX:SurvivorRatio=1 -XX:TargetSurvivorRatio=99 -XX:AllocatePrefetchDistance=256 -XX:AllocatePrefetchLines=4 -XX:LoopUnrollLimit=45 -XX:InitialTenuringThreshold=12 -XX:MaxTenuringThreshold=15 -XX:ParallelGCThreads=28 -XX:InlineSmallCode=3900 -XX:MaxInlineSize=270 -XX:FreqInlineSize=2500 -XX:+AggressiveOpts -XX:+UseLargePages -XX:+UseParallelOldGC |
| JVM Affinity: | start /NODE [0,1,2,3] /AFFINITY [0xFFFFFFF] |
| JVM Instances: | 8 |
| JVM Initial Heap (MB): | 21000 |
| JVM Maximum Heap (MB): | 21000 |
| JVM Address Bits: | 64 |
| Boot Firmware Version: | I43 v2.10 (01/18/2019) |
| Management Firmware Version: | 1.40 Feb 05 2019 |
| Workload Version: | SSJ 1.2.10 |
| Director Location: | Controller |
| Other Software: | HPE Service Pack for ProLiant (SPP) - Version 2019.03.0 (Mar 2019) |
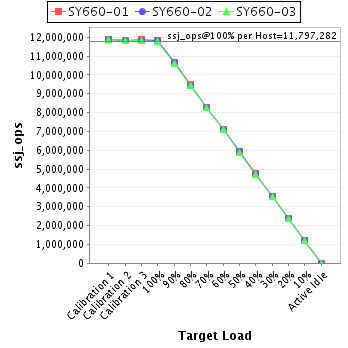
| Host | ssj_ops@100% |
|---|---|
| SY660-01 | 11,810,345 |
| SY660-02 | 11,801,079 |
| SY660-03 | 11,780,422 |
| ssj_ops@100% | 35,391,846 |
| ssj_ops@100% per Host | 11,797,282 |
| ssj_ops@100% per JVM | 1,474,660 |
| Target Load | Actual Load | ssj_ops | |
|---|---|---|---|
| Target | Actual | ||
| Calibration 1 | 11,897,416 | ||
| Calibration 2 | 11,838,806 | ||
| Calibration 3 | 11,854,190 | ||
| ssj_ops@calibrated=11,846,498 | |||
| 100% | 99.7% | 11,846,498 | 11,810,345 |
| 90% | 90.0% | 10,661,848 | 10,657,166 |
| 80% | 80.3% | 9,477,198 | 9,509,217 |
| 70% | 69.9% | 8,292,549 | 8,285,526 |
| 60% | 59.9% | 7,107,899 | 7,101,586 |
| 50% | 50.0% | 5,923,249 | 5,920,011 |
| 40% | 40.0% | 4,738,599 | 4,739,473 |
| 30% | 30.0% | 3,553,949 | 3,548,382 |
| 20% | 20.0% | 2,369,300 | 2,368,801 |
| 10% | 10.0% | 1,184,650 | 1,183,755 |
| Active Idle | 0 | 0 | |

| Target Load | Actual Load | ssj_ops | |
|---|---|---|---|
| Target | Actual | ||
| Calibration 1 | 11,876,577 | ||
| Calibration 2 | 11,829,781 | ||
| Calibration 3 | 11,837,536 | ||
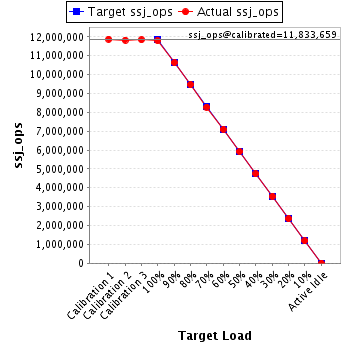
| ssj_ops@calibrated=11,833,659 | |||
| 100% | 99.7% | 11,833,659 | 11,801,079 |
| 90% | 89.9% | 10,650,293 | 10,636,386 |
| 80% | 79.9% | 9,466,927 | 9,459,711 |
| 70% | 70.0% | 8,283,561 | 8,280,186 |
| 60% | 60.0% | 7,100,195 | 7,100,830 |
| 50% | 50.1% | 5,916,829 | 5,923,017 |
| 40% | 40.0% | 4,733,463 | 4,734,853 |
| 30% | 30.0% | 3,550,098 | 3,554,022 |
| 20% | 20.0% | 2,366,732 | 2,363,796 |
| 10% | 10.0% | 1,183,366 | 1,186,219 |
| Active Idle | 0 | 0 | |
| Target Load | Actual Load | ssj_ops | |
|---|---|---|---|
| Target | Actual | ||
| Calibration 1 | 11,857,242 | ||
| Calibration 2 | 11,810,622 | ||
| Calibration 3 | 11,813,156 | ||
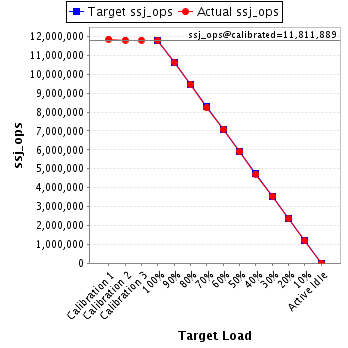
| ssj_ops@calibrated=11,811,889 | |||
| 100% | 99.7% | 11,811,889 | 11,780,422 |
| 90% | 90.0% | 10,630,700 | 10,625,898 |
| 80% | 80.0% | 9,449,511 | 9,447,760 |
| 70% | 70.0% | 8,268,322 | 8,264,494 |
| 60% | 60.0% | 7,087,133 | 7,081,263 |
| 50% | 50.0% | 5,905,945 | 5,901,943 |
| 40% | 40.0% | 4,724,756 | 4,720,643 |
| 30% | 30.0% | 3,543,567 | 3,544,271 |
| 20% | 20.0% | 2,362,378 | 2,365,587 |
| 10% | 10.0% | 1,181,189 | 1,184,127 |
| Active Idle | 0 | 0 | |