
SPECpower_ssj2008
Aggregate Performance Report
Copyright © 2007-2019 Standard Performance Evaluation Corporation
| Hewlett Packard Enterprise Synergy 660 Gen10 Compute Module | ssj_ops@100% = 45,870,814 ssj_ops@100% per Host = 11,467,704 ssj_ops@100% per JVM = 1,433,463 |
||||
| Test Sponsor: | Hewlett Packard Enterprise | SPEC License #: | 3 | Test Method: | Multi Node |
| Tested By: | Hewlett Packard Enterprise | Test Location: | Houston, TX, USA | Test Date: | Mar 9, 2019 |
| Hardware Availability: | Apr-2019 | Software Availability: | Mar-2019 | Publication: | Apr 2, 2019 |
| System Source: | Single Supplier | System Designation: | Server | Power Provisioning: | Line-powered |
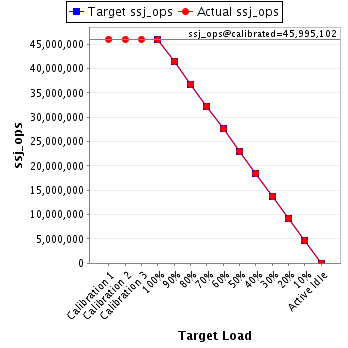
| Target Load | Actual Load | ssj_ops | |
|---|---|---|---|
| Target | Actual | ||
| Calibration 1 | 46,033,852 | ||
| Calibration 2 | 45,964,461 | ||
| Calibration 3 | 46,025,743 | ||
| ssj_ops@calibrated=45,995,102 | |||
| 100% | 99.7% | 45,995,102 | 45,870,814 |
| 90% | 90.0% | 41,395,592 | 41,393,940 |
| 80% | 80.0% | 36,796,082 | 36,796,363 |
| 70% | 70.0% | 32,196,572 | 32,195,288 |
| 60% | 60.0% | 27,597,061 | 27,588,256 |
| 50% | 50.0% | 22,997,551 | 23,002,087 |
| 40% | 40.0% | 18,398,041 | 18,411,164 |
| 30% | 30.0% | 13,798,531 | 13,796,413 |
| 20% | 20.0% | 9,199,020 | 9,204,820 |
| 10% | 10.0% | 4,599,510 | 4,593,030 |
| Active Idle | 0 | 0 | |
| # of Nodes | # of Chips | # of Cores | # of Threads | Total RAM (GB) | # of OS Images | # of JVM Instances |
|---|---|---|---|---|---|---|
| 4 | 16 | 448 | 896 | 1,536 | 4 | 32 |
| Set Identifier: | SUT |
| Set Description: | System Under Test |
| # of Identical Nodes: | 4 |
| Comment: | SUT |
| Hardware per Node | |
|---|---|
| Hardware Vendor: | Hewlett Packard Enterprise |
| Model: | Synergy 660 Gen10 Compute Module |
| Form Factor: | blade |
| CPU Name: | Intel Xeon Platinum 8280 @ 2.70GHz (Intel Turbo Boost Technology up to 4.00 GHz) |
| CPU Characteristics: | 28-Core, 2.70 GHz, 38.5MB L3 Cache |
| CPU Frequency (MHz): | 2700 |
| CPU(s) Enabled: | 112 cores, 4 chips, 28 cores/chip |
| Hardware Threads: | 224 (2 / core) |
| CPU(s) Orderable: | 1,2,3,4 chips |
| Primary Cache: | 32 KB I + 32 KB D on chip per core |
| Secondary Cache: | 1 MB I+D on chip per core |
| Tertiary Cache: | 39424 KB I+D on chip per chip |
| Other Cache: | None |
| Memory Amount (GB): | 384 |
| # and size of DIMM: | 24 x 16384 MB |
| Memory Details: | 24 x 16GB 2Rx8 PC4-2933Y-R; slots 1, 3, 5, 8, 10 and 12 populated on each socket |
| Power Supply Quantity and Rating (W): | None |
| Power Supply Details: | N/A |
| Disk Drive: | 1 x HPE 480GB SATA 6G M.2 2280 (875498-B21) |
| Disk Controller: | HPE Smart Array S100i SR Gen10 |
| # and type of Network Interface Cards (NICs) Installed: | 1 x HPE Synergy 3820C 10/20Gb CNA |
| NICs Enabled in Firmware / OS / Connected: | 2/2/1 |
| Network Speed (Mbit): | 1000 |
| Keyboard: | None |
| Mouse: | None |
| Monitor: | None |
| Optical Drives: | No |
| Other Hardware: | None |
| Software per Node | |
|---|---|
| Power Management: | Enabled (see SUT Notes) |
| Operating System (OS): | Windows Server 2012 R2 Datacenter |
| OS Version: | Version 6.3 (Build 9600) |
| Filesystem: | NTFS |
| JVM Vendor: | Oracle Corporation |
| JVM Version: | Oracle Java HotSpot(TM) 64-Bit Server VM (build 24.80-b11, mixed mode), version 1.7.0_80 |
| JVM Command-line Options: | -server -Xmn19000m -Xms21000m -Xmx21000m -XX:SurvivorRatio=1 -XX:TargetSurvivorRatio=99 -XX:AllocatePrefetchDistance=256 -XX:AllocatePrefetchLines=4 -XX:LoopUnrollLimit=45 -XX:InitialTenuringThreshold=12 -XX:MaxTenuringThreshold=15 -XX:ParallelGCThreads=28 -XX:InlineSmallCode=3900 -XX:MaxInlineSize=270 -XX:FreqInlineSize=2500 -XX:+AggressiveOpts -XX:+UseLargePages -XX:+UseParallelOldGC |
| JVM Affinity: | start /NODE [0,1,2,3] /AFFINITY [0xFFFFFFF] |
| JVM Instances: | 8 |
| JVM Initial Heap (MB): | 21000 |
| JVM Maximum Heap (MB): | 21000 |
| JVM Address Bits: | 64 |
| Boot Firmware Version: | I43 v2.10 (01/18/2019) |
| Management Firmware Version: | 1.40 Feb 05 2019 |
| Workload Version: | SSJ 1.2.10 |
| Director Location: | Controller |
| Other Software: | HPE Service Pack for ProLiant (SPP) - Version 2019.03.0 (Mar 2019), Microsoft Windows KB4054519, and KB4056898 |
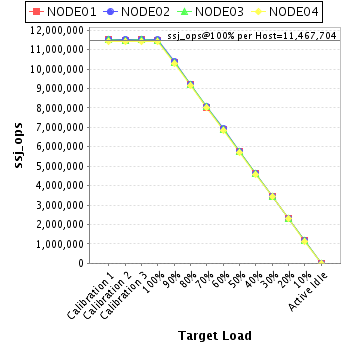
| Host | ssj_ops@100% |
|---|---|
| NODE01 | 11,484,940 |
| NODE02 | 11,507,267 |
| NODE03 | 11,472,895 |
| NODE04 | 11,405,712 |
| ssj_ops@100% | 45,870,814 |
| ssj_ops@100% per Host | 11,467,704 |
| ssj_ops@100% per JVM | 1,433,463 |
| Target Load | Actual Load | ssj_ops | |
|---|---|---|---|
| Target | Actual | ||
| Calibration 1 | 11,521,994 | ||
| Calibration 2 | 11,500,681 | ||
| Calibration 3 | 11,522,104 | ||
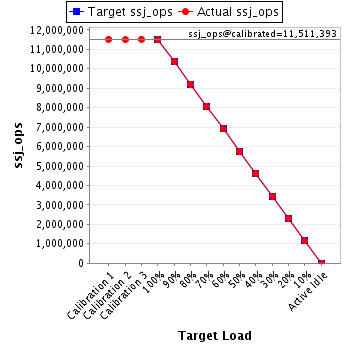
| ssj_ops@calibrated=11,511,393 | |||
| 100% | 99.8% | 11,511,393 | 11,484,940 |
| 90% | 90.1% | 10,360,253 | 10,366,801 |
| 80% | 80.1% | 9,209,114 | 9,216,498 |
| 70% | 69.9% | 8,057,975 | 8,049,146 |
| 60% | 60.0% | 6,906,836 | 6,910,360 |
| 50% | 50.0% | 5,755,696 | 5,756,715 |
| 40% | 40.1% | 4,604,557 | 4,614,489 |
| 30% | 30.0% | 3,453,418 | 3,456,819 |
| 20% | 20.1% | 2,302,279 | 2,309,207 |
| 10% | 10.0% | 1,151,139 | 1,149,597 |
| Active Idle | 0 | 0 | |
| Target Load | Actual Load | ssj_ops | |
|---|---|---|---|
| Target | Actual | ||
| Calibration 1 | 11,536,729 | ||
| Calibration 2 | 11,537,692 | ||
| Calibration 3 | 11,545,797 | ||
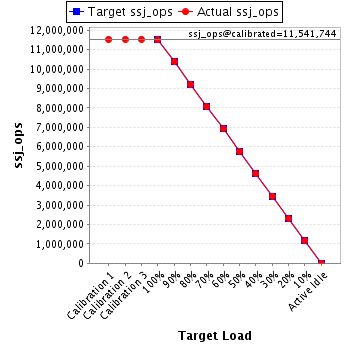
| ssj_ops@calibrated=11,541,744 | |||
| 100% | 99.7% | 11,541,744 | 11,507,267 |
| 90% | 90.0% | 10,387,570 | 10,382,700 |
| 80% | 80.0% | 9,233,395 | 9,235,258 |
| 70% | 70.0% | 8,079,221 | 8,076,005 |
| 60% | 59.9% | 6,925,047 | 6,919,062 |
| 50% | 50.0% | 5,770,872 | 5,774,808 |
| 40% | 40.0% | 4,616,698 | 4,616,311 |
| 30% | 30.0% | 3,462,523 | 3,463,098 |
| 20% | 20.0% | 2,308,349 | 2,308,554 |
| 10% | 10.0% | 1,154,174 | 1,150,622 |
| Active Idle | 0 | 0 | |
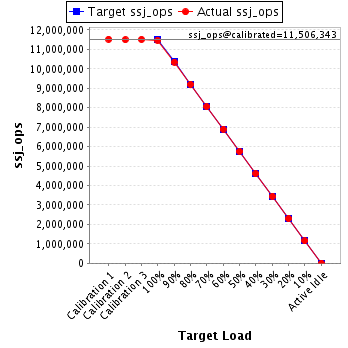
| Target Load | Actual Load | ssj_ops | |
|---|---|---|---|
| Target | Actual | ||
| Calibration 1 | 11,527,386 | ||
| Calibration 2 | 11,497,518 | ||
| Calibration 3 | 11,515,169 | ||
| ssj_ops@calibrated=11,506,343 | |||
| 100% | 99.7% | 11,506,343 | 11,472,895 |
| 90% | 90.0% | 10,355,709 | 10,351,548 |
| 80% | 80.0% | 9,205,075 | 9,204,250 |
| 70% | 70.0% | 8,054,440 | 8,057,770 |
| 60% | 60.0% | 6,903,806 | 6,898,538 |
| 50% | 50.0% | 5,753,172 | 5,758,257 |
| 40% | 40.0% | 4,602,537 | 4,606,055 |
| 30% | 30.0% | 3,451,903 | 3,450,097 |
| 20% | 20.0% | 2,301,269 | 2,301,043 |
| 10% | 10.0% | 1,150,634 | 1,151,200 |
| Active Idle | 0 | 0 | |
| Target Load | Actual Load | ssj_ops | |
|---|---|---|---|
| Target | Actual | ||
| Calibration 1 | 11,447,743 | ||
| Calibration 2 | 11,428,569 | ||
| Calibration 3 | 11,442,674 | ||
| ssj_ops@calibrated=11,435,622 | |||
| 100% | 99.7% | 11,435,622 | 11,405,712 |
| 90% | 90.0% | 10,292,060 | 10,292,891 |
| 80% | 79.9% | 9,148,497 | 9,140,356 |
| 70% | 70.1% | 8,004,935 | 8,012,368 |
| 60% | 60.0% | 6,861,373 | 6,860,297 |
| 50% | 50.0% | 5,717,811 | 5,712,307 |
| 40% | 40.0% | 4,574,249 | 4,574,309 |
| 30% | 30.0% | 3,430,687 | 3,426,399 |
| 20% | 20.0% | 2,287,124 | 2,286,016 |
| 10% | 10.0% | 1,143,562 | 1,141,611 |
| Active Idle | 0 | 0 | |
