SPECpower_ssj2008
Aggregate Performance Report
Copyright © 2007-2019 Standard Performance Evaluation Corporation
| ASUSTeK Computer Inc. RS720Q-E9-RS8 | ssj_ops@100% = 19,257,841 ssj_ops@100% per Host = 4,814,460 ssj_ops@100% per JVM = 85,973 |
||||
| Test Sponsor: | ASUSTeK Computer Inc. | SPEC License #: | 9016 | Test Method: | Multi Node |
| Tested By: | ASUSTeK Computer Inc. | Test Location: | Taipei, Taiwan. | Test Date: | Jan 10, 2019 |
| Hardware Availability: | Jan-2019 | Software Availability: | Aug-2018 | Publication: | May 10, 2019 |
| System Source: | Single Supplier | System Designation: | Server | Power Provisioning: | Line-powered |
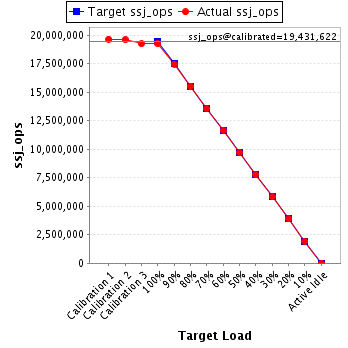
| Target Load | Actual Load | ssj_ops | |
|---|---|---|---|
| Target | Actual | ||
| Calibration 1 | 19,662,686 | ||
| Calibration 2 | 19,610,416 | ||
| Calibration 3 | 19,252,828 | ||
| ssj_ops@calibrated=19,431,622 | |||
| 100% | 99.1% | 19,431,622 | 19,257,841 |
| 90% | 90.0% | 17,488,460 | 17,479,840 |
| 80% | 80.0% | 15,545,298 | 15,545,552 |
| 70% | 70.0% | 13,602,135 | 13,592,514 |
| 60% | 60.0% | 11,658,973 | 11,655,689 |
| 50% | 50.0% | 9,715,811 | 9,711,644 |
| 40% | 40.0% | 7,772,649 | 7,769,034 |
| 30% | 30.0% | 5,829,487 | 5,825,936 |
| 20% | 20.0% | 3,886,324 | 3,885,676 |
| 10% | 10.0% | 1,943,162 | 1,941,905 |
| Active Idle | 0 | 0 | |
| # of Nodes | # of Chips | # of Cores | # of Threads | Total RAM (GB) | # of OS Images | # of JVM Instances |
|---|---|---|---|---|---|---|
| 4 | 8 | 224 | 448 | 768 | 4 | 224 |
| Set Identifier: | RS720QE9RS8 |
| Set Description: | System Under Test |
| # of Identical Nodes: | 4 |
| Comment: | 'SUT' |
| Hardware per Node | |
|---|---|
| Hardware Vendor: | ASUSTeK Computer Inc. |
| Model: | RS720Q-E9-RS8 |
| Form Factor: | 2U |
| CPU Name: | Intel Xeon Platinum 8176M |
| CPU Characteristics: | 28 Core, 2.10GHz, 38.5MB L3 Cache |
| CPU Frequency (MHz): | 2100 |
| CPU(s) Enabled: | 56 cores, 2 chips, 28 cores/chip |
| Hardware Threads: | 112 (2 / core) |
| CPU(s) Orderable: | 1,2 chips |
| Primary Cache: | 32 KB I + 32 KB D on chip per core |
| Secondary Cache: | 1 MB I+D on chip per core |
| Tertiary Cache: | 39424 KB I+D on chip per chip |
| Other Cache: | None |
| Memory Amount (GB): | 192 |
| # and size of DIMM: | 12 x 16 GB |
| Memory Details: | 12 x 16GB 2Rx8 PC4-2666V ECC RDIMM; slots DIMM_A1, DIMMM_B1, DIMMM_C1, DIMMM_D1, DIMMM_E1, DIMMM_F1, DIMMM_G1, DIMMM_H1, DIMMM_J1, DIMMM_K1, DIMMM_L1, DIMMM_M1 |
| Power Supply Quantity and Rating (W): | None |
| Power Supply Details: | Shared |
| Disk Drive: | 1 x 960GB Intel DC S3520 SATA 2.5 SSD |
| Disk Controller: | Marvell 9230 SATA controller |
| # and type of Network Interface Cards (NICs) Installed: | 1 x Dual-port Intel I350 Gigabit Ethernet controller |
| NICs Enabled in Firmware / OS / Connected: | 2/1/1 |
| Network Speed (Mbit): | 1000 |
| Keyboard: | None |
| Mouse: | None |
| Monitor: | None |
| Optical Drives: | No |
| Other Hardware: | None |
| Software per Node | |
|---|---|
| Power Management: | Enabled |
| Operating System (OS): | Microsoft Windows Server 2012 R2 Datacenter |
| OS Version: | Version 6.3 (Build 9600) |
| Filesystem: | NTFS |
| JVM Vendor: | Oracle Corporation |
| JVM Version: | Oracle Java HotSpot(TM) 64-Bit Server VM (build 24.80-b11, mixed mode), version 1.7.0_80 |
| JVM Command-line Options: | -Xmx1550m -Xms1550m -Xmn1300m -XX:SurvivorRatio=1 -XX:TargetSurvivorRatio=99 -XX:ParallelGCThreads=2 -XX:AllocatePrefetchDistance=256 -XX:AllocatePrefetchLines=4 -XX:LoopUnrollLimit=45 -XX:InitialTenuringThreshold=12 -XX:MaxTenuringThreshold=15 -XX:InlineSmallCode=3900 -XX:MaxInlineSize=270 -XX:FreqInlineSize=2500 -XX:+UseLargePages -XX:+UseParalleOldGC -XX:+AggressiveOpts |
| JVM Affinity: | start /NODE [0,2,] /AFFINITY [3, C, 30, C0, C000, 30000, C0000, 30000000, C0000000, 300000000, C00000000, C0000000000, 300000000000, C00000000000]; start /NODE [1,3] /AFFINITY [3, C, 30, 3000, C000, 30000, C0000, 30000000, C0000000, 300000000, 30000000000, C0000000000, 300000000000, C00000000000] |
| JVM Instances: | 56 |
| JVM Initial Heap (MB): | 1550 |
| JVM Maximum Heap (MB): | 1550 |
| JVM Address Bits: | 64 |
| Boot Firmware Version: | 3501 |
| Management Firmware Version: | 1.12.8 |
| Workload Version: | SSJ 1.2.10 |
| Director Location: | Controller |
| Other Software: | MS-KB4343891 |
| Host | ssj_ops@100% |
|---|---|
| WIN-A | 4,820,747 |
| WIN-B | 4,817,439 |
| WIN-C | 4,808,706 |
| WIN-D | 4,810,949 |
| ssj_ops@100% | 19,257,841 |
| ssj_ops@100% per Host | 4,814,460 |
| ssj_ops@100% per JVM | 85,973 |

| Target Load | Actual Load | ssj_ops | |
|---|---|---|---|
| Target | Actual | ||
| Calibration 1 | 4,904,886 | ||
| Calibration 2 | 4,900,130 | ||
| Calibration 3 | 4,794,666 | ||
| ssj_ops@calibrated=4,847,398 | |||
| 100% | 99.5% | 4,847,398 | 4,820,747 |
| 90% | 89.9% | 4,362,658 | 4,358,249 |
| 80% | 80.0% | 3,877,918 | 3,878,849 |
| 70% | 70.1% | 3,393,179 | 3,397,593 |
| 60% | 59.9% | 2,908,439 | 2,904,120 |
| 50% | 50.0% | 2,423,699 | 2,422,619 |
| 40% | 39.9% | 1,938,959 | 1,934,396 |
| 30% | 29.9% | 1,454,219 | 1,451,186 |
| 20% | 20.0% | 969,480 | 969,046 |
| 10% | 10.0% | 484,740 | 486,322 |
| Active Idle | 0 | 0 | |

| Target Load | Actual Load | ssj_ops | |
|---|---|---|---|
| Target | Actual | ||
| Calibration 1 | 4,919,285 | ||
| Calibration 2 | 4,901,658 | ||
| Calibration 3 | 4,842,776 | ||
| ssj_ops@calibrated=4,872,217 | |||
| 100% | 98.9% | 4,872,217 | 4,817,439 |
| 90% | 90.0% | 4,384,995 | 4,387,381 |
| 80% | 80.0% | 3,897,774 | 3,897,820 |
| 70% | 69.8% | 3,410,552 | 3,400,825 |
| 60% | 60.0% | 2,923,330 | 2,923,983 |
| 50% | 50.0% | 2,436,108 | 2,435,576 |
| 40% | 40.0% | 1,948,887 | 1,947,680 |
| 30% | 29.9% | 1,461,665 | 1,459,117 |
| 20% | 20.0% | 974,443 | 973,891 |
| 10% | 10.0% | 487,222 | 485,848 |
| Active Idle | 0 | 0 | |

| Target Load | Actual Load | ssj_ops | |
|---|---|---|---|
| Target | Actual | ||
| Calibration 1 | 4,917,052 | ||
| Calibration 2 | 4,889,758 | ||
| Calibration 3 | 4,801,473 | ||
| ssj_ops@calibrated=4,845,615 | |||
| 100% | 99.2% | 4,845,615 | 4,808,706 |
| 90% | 90.0% | 4,361,054 | 4,363,368 |
| 80% | 80.0% | 3,876,492 | 3,876,277 |
| 70% | 69.9% | 3,391,931 | 3,388,950 |
| 60% | 60.0% | 2,907,369 | 2,908,863 |
| 50% | 50.1% | 2,422,808 | 2,426,393 |
| 40% | 40.0% | 1,938,246 | 1,938,584 |
| 30% | 30.0% | 1,453,685 | 1,453,234 |
| 20% | 20.0% | 969,123 | 968,158 |
| 10% | 10.0% | 484,562 | 485,438 |
| Active Idle | 0 | 0 | |

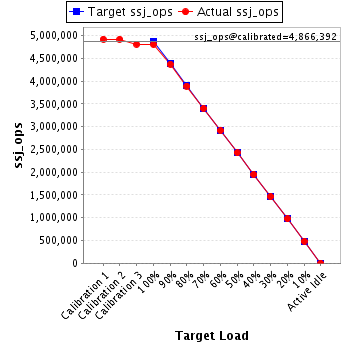
| Target Load | Actual Load | ssj_ops | |
|---|---|---|---|
| Target | Actual | ||
| Calibration 1 | 4,921,463 | ||
| Calibration 2 | 4,918,870 | ||
| Calibration 3 | 4,813,914 | ||
| ssj_ops@calibrated=4,866,392 | |||
| 100% | 98.9% | 4,866,392 | 4,810,949 |
| 90% | 89.8% | 4,379,753 | 4,370,842 |
| 80% | 80.0% | 3,893,114 | 3,892,606 |
| 70% | 70.0% | 3,406,474 | 3,405,145 |
| 60% | 60.0% | 2,919,835 | 2,918,723 |
| 50% | 49.9% | 2,433,196 | 2,427,055 |
| 40% | 40.0% | 1,946,557 | 1,948,374 |
| 30% | 30.1% | 1,459,918 | 1,462,399 |
| 20% | 20.0% | 973,278 | 974,580 |
| 10% | 10.0% | 486,639 | 484,297 |
| Active Idle | 0 | 0 | |