
SPECpower_ssj2008
Host 'NODE05' Performance Report
Copyright © 2007-2018 Standard Performance Evaluation Corporation
| Hewlett Packard Enterprise Synergy 480 Gen10 Compute Module | ssj_ops@100% = 5,727,750 ssj_ops@100% per JVM = 1,431,937 |
||||
| Test Sponsor: | Hewlett Packard Enterprise | SPEC License #: | 3 | Test Method: | Multi Node |
| Tested By: | Hewlett Packard Enterprise | Test Location: | Houston, TX, USA | Test Date: | Aug 29, 2018 |
| Hardware Availability: | Jun-2018 | Software Availability: | Mar-2018 | Publication: | Sep 12, 2018 |
| System Source: | Single Supplier | System Designation: | Server | Power Provisioning: | Line-powered |
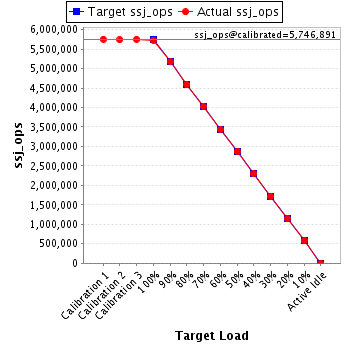
| Target Load | Actual Load | ssj_ops | |
|---|---|---|---|
| Target | Actual | ||
| Calibration 1 | 5,755,611 | ||
| Calibration 2 | 5,740,099 | ||
| Calibration 3 | 5,753,683 | ||
| ssj_ops@calibrated=5,746,891 | |||
| 100% | 99.7% | 5,746,891 | 5,727,750 |
| 90% | 90.0% | 5,172,202 | 5,173,677 |
| 80% | 79.8% | 4,597,513 | 4,587,757 |
| 70% | 70.1% | 4,022,824 | 4,030,536 |
| 60% | 59.9% | 3,448,135 | 3,439,749 |
| 50% | 50.0% | 2,873,446 | 2,873,109 |
| 40% | 40.0% | 2,298,756 | 2,299,538 |
| 30% | 30.0% | 1,724,067 | 1,726,561 |
| 20% | 20.0% | 1,149,378 | 1,148,023 |
| 10% | 10.0% | 574,689 | 573,441 |
| Active Idle | 0 | 0 | |
| Set Identifier: | SUT |
| Set Description: | System Under Test |
| # of Identical Nodes: | 5 |
| Comment: | SUT |
| Hardware | |
|---|---|
| Hardware Vendor: | Hewlett Packard Enterprise |
| Model: | Synergy 480 Gen10 Compute Module |
| Form Factor: | Other |
| CPU Name: | Intel Xeon Platinum 8180 2.50GHz |
| CPU Characteristics: | 28-Core, 2.50 GHz, 38.5 MB L3 Cache |
| CPU Frequency (MHz): | 2500 |
| CPU(s) Enabled: | 56 cores, 2 chips, 28 cores/chip |
| Hardware Threads: | 112 (2 / core) |
| CPU(s) Orderable: | 1,2 chips |
| Primary Cache: | 32 KB I + 32 KB D on chip per core |
| Secondary Cache: | 1 MB I+D on chip per core |
| Tertiary Cache: | 39424 KB I+D on chip per chip |
| Other Cache: | None |
| Memory Amount (GB): | 192 |
| # and size of DIMM: | 12 x 16384 MB |
| Memory Details: | 12 x 16GB 2Rx8 PC4-2666-V ECC; slots 1, 3, 5, 8, 10 and 12 populated on each CPU socket |
| Power Supply Quantity and Rating (W): | None |
| Power Supply Details: | Shared |
| Disk Drive: | 1 x HPE Synergy 480 Gen10 M.2 FIO Adapter Board Kit (873165-B21); 1 x HPE 480GB SATA 6G Read Intensive M.2 2280 SSD (875498-B21) |
| Disk Controller: | 1 x HPE Smart Array S100i SR Gen10 |
| # and type of Network Interface Cards (NICs) Installed: | 1 x HPE Synergy 3820C 10/20Gb 2-port Converged Network Adapter (777430-B21) |
| NICs Enabled in Firmware / OS / Connected: | 2/1/1 |
| Network Speed (Mbit): | 10000 |
| Keyboard: | None |
| Mouse: | None |
| Monitor: | None |
| Optical Drives: | No |
| Other Hardware: | None |
| Software | |
|---|---|
| Power Management: | Enabled (see SUT Notes) |
| Operating System (OS): | Windows Server 2012 R2 Datacenter |
| OS Version: | 6.3 (Build 9600) |
| Filesystem: | NTFS |
| JVM Vendor: | Oracle Corporation |
| JVM Version: | Java HotSpot(TM) 64-Bit Server VM (build 24.80-b11, mixed mode), version 1.7.0_80 |
| JVM Command-line Options: | -server -Xmn19g -Xms21g -Xmx21g -XX:SurvivorRatio=1 -XX:TargetSurvivorRatio=99 -XX:ParallelGCThreads=28 -XX:AllocatePrefetchDistance=256 -XX:AllocatePrefetchLines=4 -XX:LoopUnrollLimit=45 -XX:InitialTenuringThreshold=12 -XX:MaxTenuringThreshold=15 -XX:InlineSmallCode=9000 -XX:MaxInlineSize=270 -XX:FreqInlineSize=6000 -XX:+UseLargePages -XX:+UseParallelOldGC -XX:+AggressiveOpts |
| JVM Affinity: | start /NODE [0,1,2,3] /AFFINITY [0xFFFFFFF] |
| JVM Instances: | 4 |
| JVM Initial Heap (MB): | 21000 |
| JVM Maximum Heap (MB): | 21000 |
| JVM Address Bits: | 64 |
| Boot Firmware Version: | I42 v1.32 (02/01/2018) |
| Management Firmware Version: | 1.15 Aug 17 2017 |
| Workload Version: | SSJ 1.2.10 |
| Director Location: | Controller |
| Other Software: | HPE Composer Version 3.10.07 (HPE OneView) with HPE Synergy Custom SPP Bundle 2017.10.20180323; Microsoft Windows KB4054519, KB4056898 |
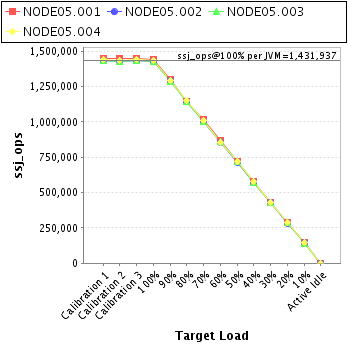
| JVM Instance | ssj_ops@100% |
|---|---|
| NODE05.001 | 1,441,362 |
| NODE05.002 | 1,426,761 |
| NODE05.003 | 1,426,041 |
| NODE05.004 | 1,433,586 |
| ssj_ops@100% | 5,727,750 |
| ssj_ops@100% per JVM | 1,431,937 |
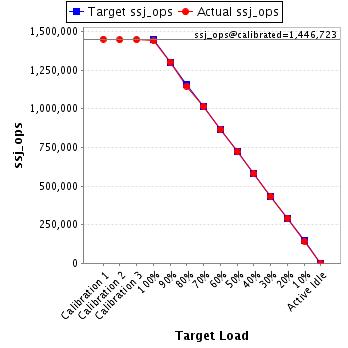
| Target Load | Actual Load | ssj_ops | |
|---|---|---|---|
| Target | Actual | ||
| Calibration 1 | 1,450,712 | ||
| Calibration 2 | 1,446,228 | ||
| Calibration 3 | 1,447,218 | ||
| ssj_ops@calibrated=1,446,723 | |||
| 100% | 99.6% | 1,446,723 | 1,441,362 |
| 90% | 90.1% | 1,302,051 | 1,302,806 |
| 80% | 79.3% | 1,157,379 | 1,146,703 |
| 70% | 70.1% | 1,012,706 | 1,014,444 |
| 60% | 59.9% | 868,034 | 866,559 |
| 50% | 49.9% | 723,362 | 722,182 |
| 40% | 40.1% | 578,689 | 579,591 |
| 30% | 29.9% | 434,017 | 433,231 |
| 20% | 20.1% | 289,345 | 290,751 |
| 10% | 9.9% | 144,672 | 143,393 |
| Active Idle | 0 | 0 | |
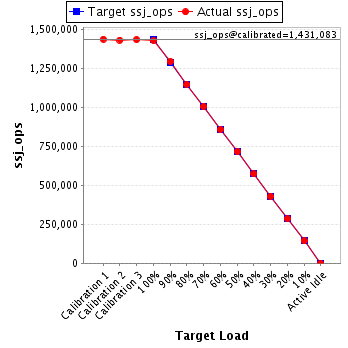
| Target Load | Actual Load | ssj_ops | |
|---|---|---|---|
| Target | Actual | ||
| Calibration 1 | 1,435,536 | ||
| Calibration 2 | 1,429,989 | ||
| Calibration 3 | 1,432,176 | ||
| ssj_ops@calibrated=1,431,083 | |||
| 100% | 99.7% | 1,431,083 | 1,426,761 |
| 90% | 90.3% | 1,287,975 | 1,292,689 |
| 80% | 80.0% | 1,144,866 | 1,144,806 |
| 70% | 70.2% | 1,001,758 | 1,004,148 |
| 60% | 59.8% | 858,650 | 855,679 |
| 50% | 50.0% | 715,541 | 714,908 |
| 40% | 40.0% | 572,433 | 571,874 |
| 30% | 30.0% | 429,325 | 429,471 |
| 20% | 19.9% | 286,217 | 284,135 |
| 10% | 10.0% | 143,108 | 143,469 |
| Active Idle | 0 | 0 | |
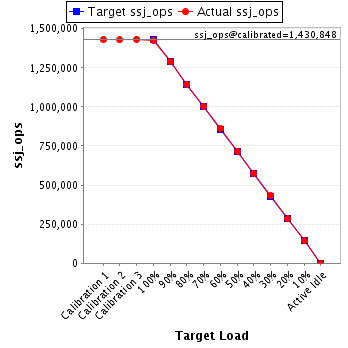
| Target Load | Actual Load | ssj_ops | |
|---|---|---|---|
| Target | Actual | ||
| Calibration 1 | 1,430,875 | ||
| Calibration 2 | 1,428,438 | ||
| Calibration 3 | 1,433,257 | ||
| ssj_ops@calibrated=1,430,848 | |||
| 100% | 99.7% | 1,430,848 | 1,426,041 |
| 90% | 90.0% | 1,287,763 | 1,288,442 |
| 80% | 80.0% | 1,144,678 | 1,144,875 |
| 70% | 70.2% | 1,001,593 | 1,005,130 |
| 60% | 60.1% | 858,509 | 859,849 |
| 50% | 50.1% | 715,424 | 716,740 |
| 40% | 40.0% | 572,339 | 572,132 |
| 30% | 30.1% | 429,254 | 430,794 |
| 20% | 20.0% | 286,170 | 285,639 |
| 10% | 10.0% | 143,085 | 142,477 |
| Active Idle | 0 | 0 | |
| Target Load | Actual Load | ssj_ops | |
|---|---|---|---|
| Target | Actual | ||
| Calibration 1 | 1,438,487 | ||
| Calibration 2 | 1,435,443 | ||
| Calibration 3 | 1,441,031 | ||
| ssj_ops@calibrated=1,438,237 | |||
| 100% | 99.7% | 1,438,237 | 1,433,586 |
| 90% | 89.7% | 1,294,414 | 1,289,741 |
| 80% | 80.1% | 1,150,590 | 1,151,372 |
| 70% | 70.0% | 1,006,766 | 1,006,814 |
| 60% | 59.6% | 862,942 | 857,663 |
| 50% | 50.0% | 719,119 | 719,279 |
| 40% | 40.0% | 575,295 | 575,941 |
| 30% | 30.1% | 431,471 | 433,064 |
| 20% | 20.0% | 287,647 | 287,499 |
| 10% | 10.0% | 143,824 | 144,102 |
| Active Idle | 0 | 0 | |
