SPECpower_ssj2008
Host 'NODE01' Performance Report
Copyright © 2007-2018 Standard Performance Evaluation Corporation
| Hewlett Packard Enterprise Synergy 480 Gen10 Compute Module | ssj_ops@100% = 5,725,541 ssj_ops@100% per JVM = 1,431,385 |
||||
| Test Sponsor: | Hewlett Packard Enterprise | SPEC License #: | 3 | Test Method: | Multi Node |
| Tested By: | Hewlett Packard Enterprise | Test Location: | Houston, TX, USA | Test Date: | Aug 29, 2018 |
| Hardware Availability: | Jun-2018 | Software Availability: | Mar-2018 | Publication: | Sep 12, 2018 |
| System Source: | Single Supplier | System Designation: | Server | Power Provisioning: | Line-powered |
| Target Load | Actual Load | ssj_ops | |
|---|---|---|---|
| Target | Actual | ||
| Calibration 1 | 5,743,856 | ||
| Calibration 2 | 5,734,751 | ||
| Calibration 3 | 5,735,286 | ||
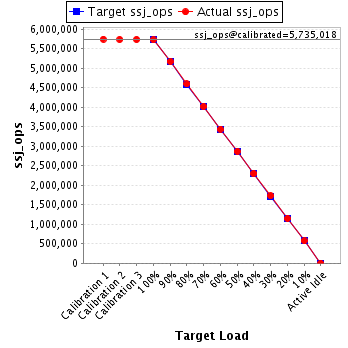
| ssj_ops@calibrated=5,735,018 | |||
| 100% | 99.8% | 5,735,018 | 5,725,541 |
| 90% | 90.2% | 5,161,517 | 5,170,584 |
| 80% | 80.1% | 4,588,015 | 4,595,713 |
| 70% | 70.1% | 4,014,513 | 4,020,182 |
| 60% | 60.0% | 3,441,011 | 3,440,030 |
| 50% | 50.0% | 2,867,509 | 2,868,712 |
| 40% | 40.1% | 2,294,007 | 2,297,396 |
| 30% | 30.1% | 1,720,506 | 1,725,932 |
| 20% | 20.0% | 1,147,004 | 1,146,653 |
| 10% | 10.0% | 573,502 | 574,367 |
| Active Idle | 0 | 0 | |
| Set Identifier: | SUT |
| Set Description: | System Under Test |
| # of Identical Nodes: | 5 |
| Comment: | SUT |
| Hardware | |
|---|---|
| Hardware Vendor: | Hewlett Packard Enterprise |
| Model: | Synergy 480 Gen10 Compute Module |
| Form Factor: | Other |
| CPU Name: | Intel Xeon Platinum 8180 2.50GHz |
| CPU Characteristics: | 28-Core, 2.50 GHz, 38.5 MB L3 Cache |
| CPU Frequency (MHz): | 2500 |
| CPU(s) Enabled: | 56 cores, 2 chips, 28 cores/chip |
| Hardware Threads: | 112 (2 / core) |
| CPU(s) Orderable: | 1,2 chips |
| Primary Cache: | 32 KB I + 32 KB D on chip per core |
| Secondary Cache: | 1 MB I+D on chip per core |
| Tertiary Cache: | 39424 KB I+D on chip per chip |
| Other Cache: | None |
| Memory Amount (GB): | 192 |
| # and size of DIMM: | 12 x 16384 MB |
| Memory Details: | 12 x 16GB 2Rx8 PC4-2666-V ECC; slots 1, 3, 5, 8, 10 and 12 populated on each CPU socket |
| Power Supply Quantity and Rating (W): | None |
| Power Supply Details: | Shared |
| Disk Drive: | 1 x HPE Synergy 480 Gen10 M.2 FIO Adapter Board Kit (873165-B21); 1 x HPE 480GB SATA 6G Read Intensive M.2 2280 SSD (875498-B21) |
| Disk Controller: | 1 x HPE Smart Array S100i SR Gen10 |
| # and type of Network Interface Cards (NICs) Installed: | 1 x HPE Synergy 3820C 10/20Gb 2-port Converged Network Adapter (777430-B21) |
| NICs Enabled in Firmware / OS / Connected: | 2/1/1 |
| Network Speed (Mbit): | 10000 |
| Keyboard: | None |
| Mouse: | None |
| Monitor: | None |
| Optical Drives: | No |
| Other Hardware: | None |
| Software | |
|---|---|
| Power Management: | Enabled (see SUT Notes) |
| Operating System (OS): | Windows Server 2012 R2 Datacenter |
| OS Version: | 6.3 (Build 9600) |
| Filesystem: | NTFS |
| JVM Vendor: | Oracle Corporation |
| JVM Version: | Java HotSpot(TM) 64-Bit Server VM (build 24.80-b11, mixed mode), version 1.7.0_80 |
| JVM Command-line Options: | -server -Xmn19g -Xms21g -Xmx21g -XX:SurvivorRatio=1 -XX:TargetSurvivorRatio=99 -XX:ParallelGCThreads=28 -XX:AllocatePrefetchDistance=256 -XX:AllocatePrefetchLines=4 -XX:LoopUnrollLimit=45 -XX:InitialTenuringThreshold=12 -XX:MaxTenuringThreshold=15 -XX:InlineSmallCode=9000 -XX:MaxInlineSize=270 -XX:FreqInlineSize=6000 -XX:+UseLargePages -XX:+UseParallelOldGC -XX:+AggressiveOpts |
| JVM Affinity: | start /NODE [0,1,2,3] /AFFINITY [0xFFFFFFF] |
| JVM Instances: | 4 |
| JVM Initial Heap (MB): | 21000 |
| JVM Maximum Heap (MB): | 21000 |
| JVM Address Bits: | 64 |
| Boot Firmware Version: | I42 v1.32 (02/01/2018) |
| Management Firmware Version: | 1.15 Aug 17 2017 |
| Workload Version: | SSJ 1.2.10 |
| Director Location: | Controller |
| Other Software: | HPE Composer Version 3.10.07 (HPE OneView) with HPE Synergy Custom SPP Bundle 2017.10.20180323; Microsoft Windows KB4054519, KB4056898 |
| JVM Instance | ssj_ops@100% |
|---|---|
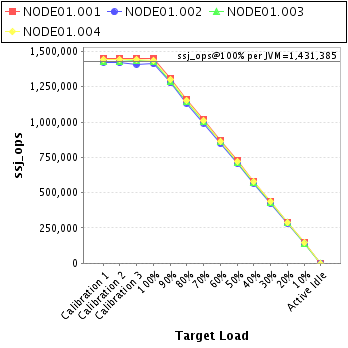
| NODE01.001 | 1,446,631 |
| NODE01.002 | 1,412,279 |
| NODE01.003 | 1,430,355 |
| NODE01.004 | 1,436,276 |
| ssj_ops@100% | 5,725,541 |
| ssj_ops@100% per JVM | 1,431,385 |
| Target Load | Actual Load | ssj_ops | |
|---|---|---|---|
| Target | Actual | ||
| Calibration 1 | 1,450,936 | ||
| Calibration 2 | 1,448,564 | ||
| Calibration 3 | 1,451,805 | ||
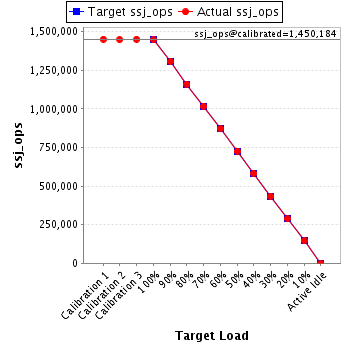
| ssj_ops@calibrated=1,450,184 | |||
| 100% | 99.8% | 1,450,184 | 1,446,631 |
| 90% | 90.2% | 1,305,166 | 1,307,438 |
| 80% | 80.1% | 1,160,148 | 1,161,349 |
| 70% | 70.2% | 1,015,129 | 1,018,145 |
| 60% | 60.0% | 870,111 | 870,079 |
| 50% | 50.1% | 725,092 | 726,606 |
| 40% | 40.1% | 580,074 | 582,113 |
| 30% | 30.0% | 435,055 | 435,670 |
| 20% | 19.9% | 290,037 | 289,053 |
| 10% | 10.0% | 145,018 | 145,448 |
| Active Idle | 0 | 0 | |
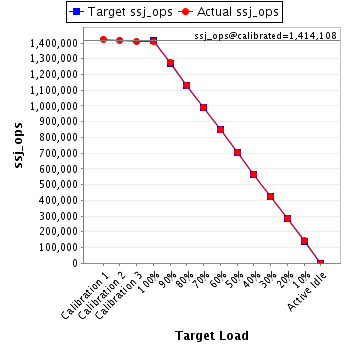
| Target Load | Actual Load | ssj_ops | |
|---|---|---|---|
| Target | Actual | ||
| Calibration 1 | 1,424,708 | ||
| Calibration 2 | 1,418,243 | ||
| Calibration 3 | 1,409,973 | ||
| ssj_ops@calibrated=1,414,108 | |||
| 100% | 99.9% | 1,414,108 | 1,412,279 |
| 90% | 90.2% | 1,272,697 | 1,276,231 |
| 80% | 80.1% | 1,131,287 | 1,133,162 |
| 70% | 70.2% | 989,876 | 992,565 |
| 60% | 59.9% | 848,465 | 847,643 |
| 50% | 49.9% | 707,054 | 706,231 |
| 40% | 40.0% | 565,643 | 565,138 |
| 30% | 29.9% | 424,232 | 423,345 |
| 20% | 20.1% | 282,822 | 284,375 |
| 10% | 10.1% | 141,411 | 142,152 |
| Active Idle | 0 | 0 | |
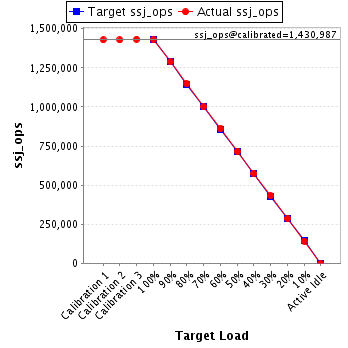
| Target Load | Actual Load | ssj_ops | |
|---|---|---|---|
| Target | Actual | ||
| Calibration 1 | 1,428,462 | ||
| Calibration 2 | 1,428,411 | ||
| Calibration 3 | 1,433,562 | ||
| ssj_ops@calibrated=1,430,987 | |||
| 100% | 100.0% | 1,430,987 | 1,430,355 |
| 90% | 90.0% | 1,287,888 | 1,287,683 |
| 80% | 80.2% | 1,144,789 | 1,147,739 |
| 70% | 70.0% | 1,001,691 | 1,001,064 |
| 60% | 60.0% | 858,592 | 858,956 |
| 50% | 50.0% | 715,493 | 715,585 |
| 40% | 40.1% | 572,395 | 573,920 |
| 30% | 30.1% | 429,296 | 430,924 |
| 20% | 20.0% | 286,197 | 285,960 |
| 10% | 9.9% | 143,099 | 142,351 |
| Active Idle | 0 | 0 | |
| Target Load | Actual Load | ssj_ops | |
|---|---|---|---|
| Target | Actual | ||
| Calibration 1 | 1,439,750 | ||
| Calibration 2 | 1,439,533 | ||
| Calibration 3 | 1,439,945 | ||
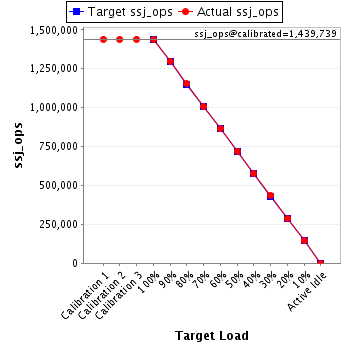
| ssj_ops@calibrated=1,439,739 | |||
| 100% | 99.8% | 1,439,739 | 1,436,276 |
| 90% | 90.2% | 1,295,765 | 1,299,231 |
| 80% | 80.1% | 1,151,791 | 1,153,462 |
| 70% | 70.0% | 1,007,817 | 1,008,408 |
| 60% | 60.0% | 863,844 | 863,352 |
| 50% | 50.0% | 719,870 | 720,289 |
| 40% | 40.0% | 575,896 | 576,225 |
| 30% | 30.3% | 431,922 | 435,993 |
| 20% | 20.0% | 287,948 | 287,264 |
| 10% | 10.0% | 143,974 | 144,416 |
| Active Idle | 0 | 0 | |