SPECpower_ssj2008
Host 'NODE05' Performance Report
Copyright © 2007-2018 Standard Performance Evaluation Corporation
| Hewlett Packard Enterprise Synergy 480 Gen10 Compute Module | ssj_ops@100% = 5,756,989 ssj_ops@100% per JVM = 1,439,247 |
||||
| Test Sponsor: | Hewlett Packard Enterprise | SPEC License #: | 3 | Test Method: | Multi Node |
| Tested By: | Hewlett Packard Enterprise | Test Location: | Houston, TX, USA | Test Date: | Aug 24, 2018 |
| Hardware Availability: | Jun-2018 | Software Availability: | Mar-2018 | Publication: | Sep 12, 2018 |
| System Source: | Single Supplier | System Designation: | Server | Power Provisioning: | Line-powered |
| Target Load | Actual Load | ssj_ops | |
|---|---|---|---|
| Target | Actual | ||
| Calibration 1 | 5,775,763 | ||
| Calibration 2 | 5,771,465 | ||
| Calibration 3 | 5,778,089 | ||
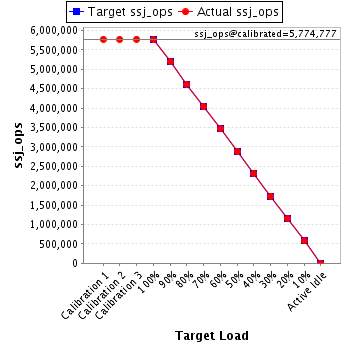
| ssj_ops@calibrated=5,774,777 | |||
| 100% | 99.7% | 5,774,777 | 5,756,989 |
| 90% | 90.1% | 5,197,299 | 5,200,327 |
| 80% | 80.0% | 4,619,822 | 4,616,945 |
| 70% | 70.0% | 4,042,344 | 4,044,199 |
| 60% | 60.0% | 3,464,866 | 3,464,154 |
| 50% | 49.9% | 2,887,389 | 2,884,145 |
| 40% | 40.0% | 2,309,911 | 2,310,785 |
| 30% | 29.9% | 1,732,433 | 1,727,986 |
| 20% | 20.0% | 1,154,955 | 1,154,080 |
| 10% | 10.0% | 577,478 | 576,369 |
| Active Idle | 0 | 0 | |
| Set Identifier: | SUT |
| Set Description: | System Under Test |
| # of Identical Nodes: | 8 |
| Comment: | SUT |
| Hardware | |
|---|---|
| Hardware Vendor: | Hewlett Packard Enterprise |
| Model: | Synergy 480 Gen10 Compute Module |
| Form Factor: | Other |
| CPU Name: | Intel Xeon Platinum 8180 2.50GHz |
| CPU Characteristics: | 28-Core, 2.50 GHz, 38.5 MB L3 Cache |
| CPU Frequency (MHz): | 2500 |
| CPU(s) Enabled: | 56 cores, 2 chips, 28 cores/chip |
| Hardware Threads: | 112 (2 / core) |
| CPU(s) Orderable: | 1,2 chips |
| Primary Cache: | 32 KB I + 32 KB D on chip per core |
| Secondary Cache: | 1 MB I+D on chip per core |
| Tertiary Cache: | 39424 KB I+D on chip per chip |
| Other Cache: | None |
| Memory Amount (GB): | 192 |
| # and size of DIMM: | 12 x 16384 MB |
| Memory Details: | 12 x 16GB 2Rx8 PC4-2666-V ECC; slots 1, 3, 5, 8, 10 and 12 populated on each CPU socket |
| Power Supply Quantity and Rating (W): | None |
| Power Supply Details: | Shared |
| Disk Drive: | 1 x HPE Synergy 480 Gen10 M.2 FIO Adapter Board Kit (873165-B21); 1 x HPE 480GB SATA 6G Read Intensive M.2 2280 SSD (875498-B21) |
| Disk Controller: | 1 x HPE Smart Array S100i SR Gen10 |
| # and type of Network Interface Cards (NICs) Installed: | 1 x HPE Synergy 3820C 10/20Gb 2-port Converged Network Adapter (777430-B21) |
| NICs Enabled in Firmware / OS / Connected: | 2/1/1 |
| Network Speed (Mbit): | 10000 |
| Keyboard: | None |
| Mouse: | None |
| Monitor: | None |
| Optical Drives: | No |
| Other Hardware: | None |
| Software | |
|---|---|
| Power Management: | Enabled (see SUT Notes) |
| Operating System (OS): | Windows Server 2012 R2 Datacenter |
| OS Version: | 6.3 (Build 9600) |
| Filesystem: | NTFS |
| JVM Vendor: | Oracle Corporation |
| JVM Version: | Java HotSpot(TM) 64-Bit Server VM (build 24.80-b11, mixed mode), version 1.7.0_80 |
| JVM Command-line Options: | -server -Xmn19g -Xms21g -Xmx21g -XX:SurvivorRatio=1 -XX:TargetSurvivorRatio=99 -XX:ParallelGCThreads=28 -XX:AllocatePrefetchDistance=256 -XX:AllocatePrefetchLines=4 -XX:LoopUnrollLimit=45 -XX:InitialTenuringThreshold=12 -XX:MaxTenuringThreshold=15 -XX:InlineSmallCode=9000 -XX:MaxInlineSize=270 -XX:FreqInlineSize=6000 -XX:+UseLargePages -XX:+UseParallelOldGC -XX:+AggressiveOpts |
| JVM Affinity: | start /NODE [0,1,2,3] /AFFINITY [0xFFFFFFF] |
| JVM Instances: | 4 |
| JVM Initial Heap (MB): | 21000 |
| JVM Maximum Heap (MB): | 21000 |
| JVM Address Bits: | 64 |
| Boot Firmware Version: | I42 v1.32 (02/01/2018) |
| Management Firmware Version: | 1.15 Aug 17 2017 |
| Workload Version: | SSJ 1.2.10 |
| Director Location: | Controller |
| Other Software: | HPE Composer Version 3.10.07 (HPE OneView) with HPE Synergy Custom SPP Bundle 2017.10.20180323; Microsoft Windows KB4054519, KB4056898 |
| JVM Instance | ssj_ops@100% |
|---|---|
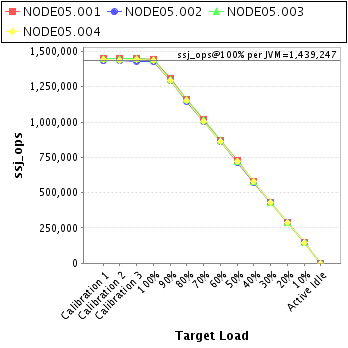
| NODE05.001 | 1,446,739 |
| NODE05.002 | 1,427,913 |
| NODE05.003 | 1,444,282 |
| NODE05.004 | 1,438,055 |
| ssj_ops@100% | 5,756,989 |
| ssj_ops@100% per JVM | 1,439,247 |
| Target Load | Actual Load | ssj_ops | |
|---|---|---|---|
| Target | Actual | ||
| Calibration 1 | 1,451,651 | ||
| Calibration 2 | 1,451,426 | ||
| Calibration 3 | 1,452,644 | ||
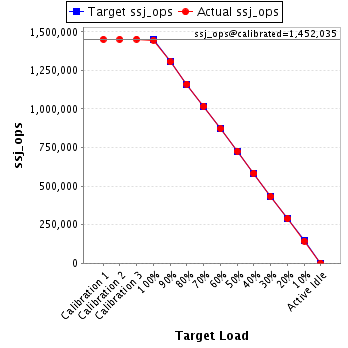
| ssj_ops@calibrated=1,452,035 | |||
| 100% | 99.6% | 1,452,035 | 1,446,739 |
| 90% | 89.9% | 1,306,832 | 1,305,862 |
| 80% | 80.0% | 1,161,628 | 1,161,269 |
| 70% | 70.2% | 1,016,425 | 1,018,605 |
| 60% | 60.0% | 871,221 | 871,846 |
| 50% | 50.0% | 726,018 | 725,928 |
| 40% | 40.1% | 580,814 | 582,510 |
| 30% | 29.8% | 435,611 | 432,930 |
| 20% | 19.9% | 290,407 | 289,136 |
| 10% | 9.9% | 145,204 | 143,754 |
| Active Idle | 0 | 0 | |
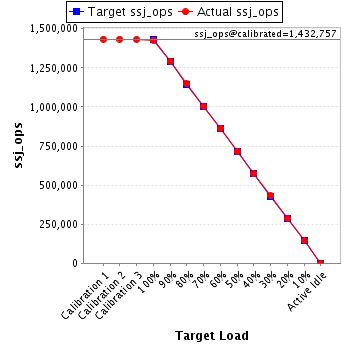
| Target Load | Actual Load | ssj_ops | |
|---|---|---|---|
| Target | Actual | ||
| Calibration 1 | 1,432,916 | ||
| Calibration 2 | 1,433,316 | ||
| Calibration 3 | 1,432,199 | ||
| ssj_ops@calibrated=1,432,757 | |||
| 100% | 99.7% | 1,432,757 | 1,427,913 |
| 90% | 90.2% | 1,289,482 | 1,292,600 |
| 80% | 80.0% | 1,146,206 | 1,146,897 |
| 70% | 70.0% | 1,002,930 | 1,002,786 |
| 60% | 60.2% | 859,654 | 861,922 |
| 50% | 49.8% | 716,379 | 713,948 |
| 40% | 39.9% | 573,103 | 572,061 |
| 30% | 30.1% | 429,827 | 431,095 |
| 20% | 20.0% | 286,551 | 287,196 |
| 10% | 10.0% | 143,276 | 143,605 |
| Active Idle | 0 | 0 | |
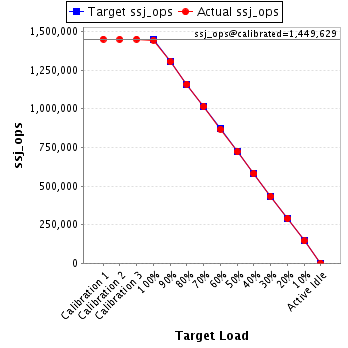
| Target Load | Actual Load | ssj_ops | |
|---|---|---|---|
| Target | Actual | ||
| Calibration 1 | 1,450,348 | ||
| Calibration 2 | 1,448,930 | ||
| Calibration 3 | 1,450,328 | ||
| ssj_ops@calibrated=1,449,629 | |||
| 100% | 99.6% | 1,449,629 | 1,444,282 |
| 90% | 90.0% | 1,304,666 | 1,304,633 |
| 80% | 79.9% | 1,159,703 | 1,158,509 |
| 70% | 70.1% | 1,014,740 | 1,015,516 |
| 60% | 59.9% | 869,778 | 867,829 |
| 50% | 49.8% | 724,815 | 721,597 |
| 40% | 40.0% | 579,852 | 579,541 |
| 30% | 29.9% | 434,889 | 433,631 |
| 20% | 20.0% | 289,926 | 289,697 |
| 10% | 10.0% | 144,963 | 145,204 |
| Active Idle | 0 | 0 | |
| Target Load | Actual Load | ssj_ops | |
|---|---|---|---|
| Target | Actual | ||
| Calibration 1 | 1,440,848 | ||
| Calibration 2 | 1,437,792 | ||
| Calibration 3 | 1,442,918 | ||
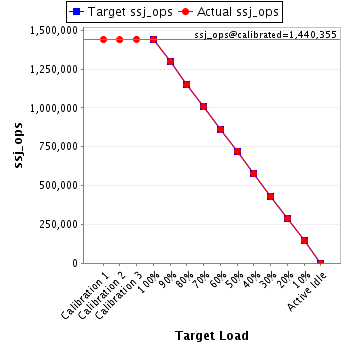
| ssj_ops@calibrated=1,440,355 | |||
| 100% | 99.8% | 1,440,355 | 1,438,055 |
| 90% | 90.1% | 1,296,320 | 1,297,232 |
| 80% | 79.9% | 1,152,284 | 1,150,270 |
| 70% | 69.9% | 1,008,249 | 1,007,293 |
| 60% | 59.9% | 864,213 | 862,556 |
| 50% | 50.2% | 720,178 | 722,672 |
| 40% | 40.0% | 576,142 | 576,673 |
| 30% | 29.9% | 432,107 | 430,330 |
| 20% | 20.0% | 288,071 | 288,051 |
| 10% | 10.0% | 144,036 | 143,806 |
| Active Idle | 0 | 0 | |