SPECpower_ssj2008
Host 'NODE01' Performance Report
Copyright © 2007-2018 Standard Performance Evaluation Corporation
| Hewlett Packard Enterprise Synergy 480 Gen10 Compute Module | ssj_ops@100% = 5,720,994 ssj_ops@100% per JVM = 1,430,249 |
||||
| Test Sponsor: | Hewlett Packard Enterprise | SPEC License #: | 3 | Test Method: | Multi Node |
| Tested By: | Hewlett Packard Enterprise | Test Location: | Houston, TX, USA | Test Date: | Aug 24, 2018 |
| Hardware Availability: | Jun-2018 | Software Availability: | Mar-2018 | Publication: | Sep 12, 2018 |
| System Source: | Single Supplier | System Designation: | Server | Power Provisioning: | Line-powered |
| Target Load | Actual Load | ssj_ops | |
|---|---|---|---|
| Target | Actual | ||
| Calibration 1 | 5,712,558 | ||
| Calibration 2 | 5,732,085 | ||
| Calibration 3 | 5,745,310 | ||
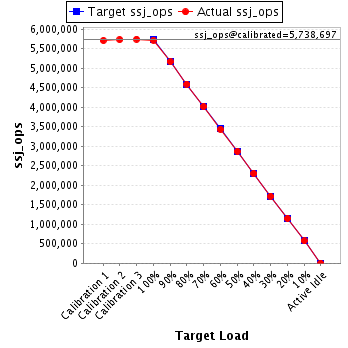
| ssj_ops@calibrated=5,738,697 | |||
| 100% | 99.7% | 5,738,697 | 5,720,994 |
| 90% | 90.0% | 5,164,828 | 5,167,435 |
| 80% | 80.0% | 4,590,958 | 4,591,276 |
| 70% | 70.0% | 4,017,088 | 4,018,365 |
| 60% | 59.9% | 3,443,218 | 3,436,964 |
| 50% | 50.0% | 2,869,349 | 2,868,447 |
| 40% | 40.0% | 2,295,479 | 2,298,011 |
| 30% | 30.0% | 1,721,609 | 1,720,403 |
| 20% | 20.0% | 1,147,739 | 1,148,348 |
| 10% | 10.0% | 573,870 | 573,984 |
| Active Idle | 0 | 0 | |
| Set Identifier: | SUT |
| Set Description: | System Under Test |
| # of Identical Nodes: | 8 |
| Comment: | SUT |
| Hardware | |
|---|---|
| Hardware Vendor: | Hewlett Packard Enterprise |
| Model: | Synergy 480 Gen10 Compute Module |
| Form Factor: | Other |
| CPU Name: | Intel Xeon Platinum 8180 2.50GHz |
| CPU Characteristics: | 28-Core, 2.50 GHz, 38.5 MB L3 Cache |
| CPU Frequency (MHz): | 2500 |
| CPU(s) Enabled: | 56 cores, 2 chips, 28 cores/chip |
| Hardware Threads: | 112 (2 / core) |
| CPU(s) Orderable: | 1,2 chips |
| Primary Cache: | 32 KB I + 32 KB D on chip per core |
| Secondary Cache: | 1 MB I+D on chip per core |
| Tertiary Cache: | 39424 KB I+D on chip per chip |
| Other Cache: | None |
| Memory Amount (GB): | 192 |
| # and size of DIMM: | 12 x 16384 MB |
| Memory Details: | 12 x 16GB 2Rx8 PC4-2666-V ECC; slots 1, 3, 5, 8, 10 and 12 populated on each CPU socket |
| Power Supply Quantity and Rating (W): | None |
| Power Supply Details: | Shared |
| Disk Drive: | 1 x HPE Synergy 480 Gen10 M.2 FIO Adapter Board Kit (873165-B21); 1 x HPE 480GB SATA 6G Read Intensive M.2 2280 SSD (875498-B21) |
| Disk Controller: | 1 x HPE Smart Array S100i SR Gen10 |
| # and type of Network Interface Cards (NICs) Installed: | 1 x HPE Synergy 3820C 10/20Gb 2-port Converged Network Adapter (777430-B21) |
| NICs Enabled in Firmware / OS / Connected: | 2/1/1 |
| Network Speed (Mbit): | 10000 |
| Keyboard: | None |
| Mouse: | None |
| Monitor: | None |
| Optical Drives: | No |
| Other Hardware: | None |
| Software | |
|---|---|
| Power Management: | Enabled (see SUT Notes) |
| Operating System (OS): | Windows Server 2012 R2 Datacenter |
| OS Version: | 6.3 (Build 9600) |
| Filesystem: | NTFS |
| JVM Vendor: | Oracle Corporation |
| JVM Version: | Java HotSpot(TM) 64-Bit Server VM (build 24.80-b11, mixed mode), version 1.7.0_80 |
| JVM Command-line Options: | -server -Xmn19g -Xms21g -Xmx21g -XX:SurvivorRatio=1 -XX:TargetSurvivorRatio=99 -XX:ParallelGCThreads=28 -XX:AllocatePrefetchDistance=256 -XX:AllocatePrefetchLines=4 -XX:LoopUnrollLimit=45 -XX:InitialTenuringThreshold=12 -XX:MaxTenuringThreshold=15 -XX:InlineSmallCode=9000 -XX:MaxInlineSize=270 -XX:FreqInlineSize=6000 -XX:+UseLargePages -XX:+UseParallelOldGC -XX:+AggressiveOpts |
| JVM Affinity: | start /NODE [0,1,2,3] /AFFINITY [0xFFFFFFF] |
| JVM Instances: | 4 |
| JVM Initial Heap (MB): | 21000 |
| JVM Maximum Heap (MB): | 21000 |
| JVM Address Bits: | 64 |
| Boot Firmware Version: | I42 v1.32 (02/01/2018) |
| Management Firmware Version: | 1.15 Aug 17 2017 |
| Workload Version: | SSJ 1.2.10 |
| Director Location: | Controller |
| Other Software: | HPE Composer Version 3.10.07 (HPE OneView) with HPE Synergy Custom SPP Bundle 2017.10.20180323; Microsoft Windows KB4054519, KB4056898 |
| JVM Instance | ssj_ops@100% |
|---|---|
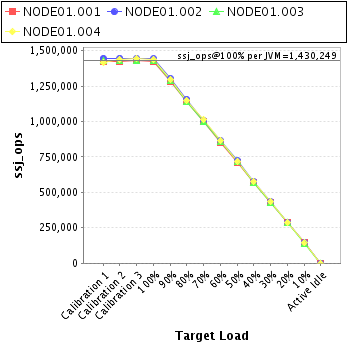
| NODE01.001 | 1,419,388 |
| NODE01.002 | 1,440,904 |
| NODE01.003 | 1,426,834 |
| NODE01.004 | 1,433,869 |
| ssj_ops@100% | 5,720,994 |
| ssj_ops@100% per JVM | 1,430,249 |
| Target Load | Actual Load | ssj_ops | |
|---|---|---|---|
| Target | Actual | ||
| Calibration 1 | 1,423,890 | ||
| Calibration 2 | 1,423,297 | ||
| Calibration 3 | 1,427,005 | ||
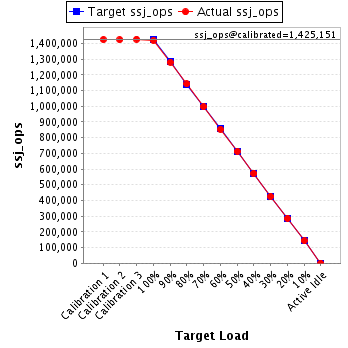
| ssj_ops@calibrated=1,425,151 | |||
| 100% | 99.6% | 1,425,151 | 1,419,388 |
| 90% | 89.8% | 1,282,636 | 1,280,072 |
| 80% | 80.2% | 1,140,121 | 1,142,459 |
| 70% | 69.9% | 997,606 | 996,833 |
| 60% | 59.9% | 855,091 | 853,641 |
| 50% | 50.0% | 712,576 | 712,783 |
| 40% | 40.1% | 570,061 | 571,864 |
| 30% | 29.8% | 427,545 | 425,229 |
| 20% | 20.1% | 285,030 | 285,986 |
| 10% | 10.1% | 142,515 | 143,420 |
| Active Idle | 0 | 0 | |
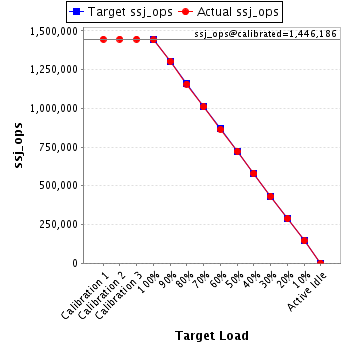
| Target Load | Actual Load | ssj_ops | |
|---|---|---|---|
| Target | Actual | ||
| Calibration 1 | 1,445,451 | ||
| Calibration 2 | 1,446,188 | ||
| Calibration 3 | 1,446,184 | ||
| ssj_ops@calibrated=1,446,186 | |||
| 100% | 99.6% | 1,446,186 | 1,440,904 |
| 90% | 90.1% | 1,301,567 | 1,302,816 |
| 80% | 80.0% | 1,156,949 | 1,156,528 |
| 70% | 69.8% | 1,012,330 | 1,009,573 |
| 60% | 59.8% | 867,711 | 864,209 |
| 50% | 49.9% | 723,093 | 721,759 |
| 40% | 40.0% | 578,474 | 578,103 |
| 30% | 29.9% | 433,856 | 432,731 |
| 20% | 19.9% | 289,237 | 288,414 |
| 10% | 10.1% | 144,619 | 145,518 |
| Active Idle | 0 | 0 | |
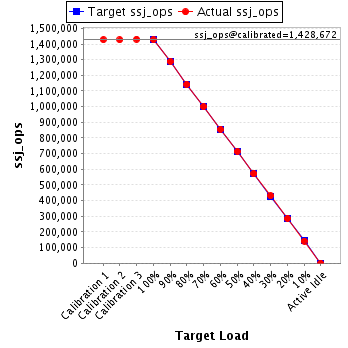
| Target Load | Actual Load | ssj_ops | |
|---|---|---|---|
| Target | Actual | ||
| Calibration 1 | 1,427,440 | ||
| Calibration 2 | 1,426,410 | ||
| Calibration 3 | 1,430,934 | ||
| ssj_ops@calibrated=1,428,672 | |||
| 100% | 99.9% | 1,428,672 | 1,426,834 |
| 90% | 90.2% | 1,285,805 | 1,288,133 |
| 80% | 80.0% | 1,142,938 | 1,142,431 |
| 70% | 70.0% | 1,000,070 | 1,000,585 |
| 60% | 59.9% | 857,203 | 855,953 |
| 50% | 50.0% | 714,336 | 714,148 |
| 40% | 40.0% | 571,469 | 571,244 |
| 30% | 30.1% | 428,602 | 430,419 |
| 20% | 20.0% | 285,734 | 286,007 |
| 10% | 9.9% | 142,867 | 141,755 |
| Active Idle | 0 | 0 | |
| Target Load | Actual Load | ssj_ops | |
|---|---|---|---|
| Target | Actual | ||
| Calibration 1 | 1,415,778 | ||
| Calibration 2 | 1,436,190 | ||
| Calibration 3 | 1,441,187 | ||
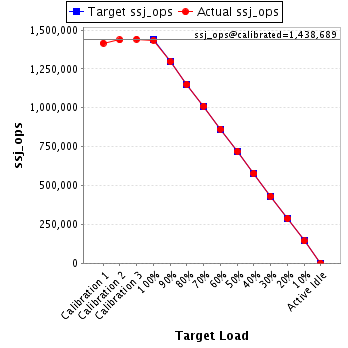
| ssj_ops@calibrated=1,438,689 | |||
| 100% | 99.7% | 1,438,689 | 1,433,869 |
| 90% | 90.1% | 1,294,820 | 1,296,414 |
| 80% | 79.9% | 1,150,951 | 1,149,859 |
| 70% | 70.3% | 1,007,082 | 1,011,374 |
| 60% | 60.0% | 863,213 | 863,161 |
| 50% | 50.0% | 719,344 | 719,758 |
| 40% | 40.1% | 575,475 | 576,801 |
| 30% | 30.0% | 431,607 | 432,024 |
| 20% | 20.0% | 287,738 | 287,941 |
| 10% | 10.0% | 143,869 | 143,291 |
| Active Idle | 0 | 0 | |