
SPECpower_ssj2008
Host 'NODE03' Performance Report
Copyright © 2007-2018 Standard Performance Evaluation Corporation
| Hewlett Packard Enterprise Synergy 480 Gen10 Compute Module | ssj_ops@100% = 5,709,759 ssj_ops@100% per JVM = 1,427,440 |
||||
| Test Sponsor: | Hewlett Packard Enterprise | SPEC License #: | 3 | Test Method: | Multi Node |
| Tested By: | Hewlett Packard Enterprise | Test Location: | Houston, TX, USA | Test Date: | Aug 26, 2018 |
| Hardware Availability: | Jun-2018 | Software Availability: | Mar-2018 | Publication: | Sep 12, 2018 |
| System Source: | Single Supplier | System Designation: | Server | Power Provisioning: | Line-powered |
| Target Load | Actual Load | ssj_ops | |
|---|---|---|---|
| Target | Actual | ||
| Calibration 1 | 5,732,161 | ||
| Calibration 2 | 5,713,803 | ||
| Calibration 3 | 5,726,184 | ||
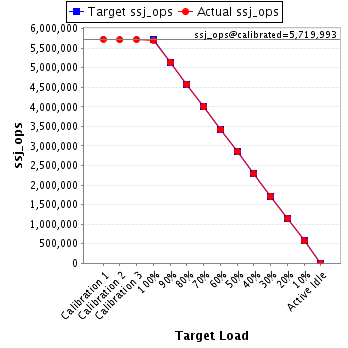
| ssj_ops@calibrated=5,719,993 | |||
| 100% | 99.8% | 5,719,993 | 5,709,759 |
| 90% | 90.0% | 5,147,994 | 5,146,399 |
| 80% | 80.1% | 4,575,995 | 4,579,612 |
| 70% | 70.0% | 4,003,995 | 4,002,216 |
| 60% | 59.9% | 3,431,996 | 3,427,784 |
| 50% | 50.0% | 2,859,997 | 2,859,427 |
| 40% | 39.9% | 2,287,997 | 2,284,709 |
| 30% | 30.0% | 1,715,998 | 1,715,067 |
| 20% | 20.0% | 1,143,999 | 1,144,841 |
| 10% | 10.0% | 571,999 | 570,943 |
| Active Idle | 0 | 0 | |
| Set Identifier: | SUT |
| Set Description: | System Under Test |
| # of Identical Nodes: | 9 |
| Comment: | SUT |
| Hardware | |
|---|---|
| Hardware Vendor: | Hewlett Packard Enterprise |
| Model: | Synergy 480 Gen10 Compute Module |
| Form Factor: | Other |
| CPU Name: | Intel Xeon Platinum 8180 2.50GHz |
| CPU Characteristics: | 28-Core, 2.50 GHz, 38.5 MB L3 Cache |
| CPU Frequency (MHz): | 2500 |
| CPU(s) Enabled: | 56 cores, 2 chips, 28 cores/chip |
| Hardware Threads: | 112 (2 / core) |
| CPU(s) Orderable: | 1,2 chips |
| Primary Cache: | 32 KB I + 32 KB D on chip per core |
| Secondary Cache: | 1 MB I+D on chip per core |
| Tertiary Cache: | 39424 KB I+D on chip per chip |
| Other Cache: | None |
| Memory Amount (GB): | 192 |
| # and size of DIMM: | 12 x 16384 MB |
| Memory Details: | 12 x 16GB 2Rx8 PC4-2666-V ECC; slots 1, 3, 5, 8, 10 and 12 populated on each CPU socket |
| Power Supply Quantity and Rating (W): | None |
| Power Supply Details: | Shared |
| Disk Drive: | 1 x HPE Synergy 480 Gen10 M.2 FIO Adapter Board Kit (873165-B21); 1 x HPE 480GB SATA 6G Read Intensive M.2 2280 SSD (875498-B21) |
| Disk Controller: | 1 x HPE Smart Array S100i SR Gen10 |
| # and type of Network Interface Cards (NICs) Installed: | 1 x HPE Synergy 3820C 10/20Gb 2-port Converged Network Adapter (777430-B21) |
| NICs Enabled in Firmware / OS / Connected: | 2/1/1 |
| Network Speed (Mbit): | 10000 |
| Keyboard: | None |
| Mouse: | None |
| Monitor: | None |
| Optical Drives: | No |
| Other Hardware: | None |
| Software | |
|---|---|
| Power Management: | Enabled (see SUT Notes) |
| Operating System (OS): | Windows Server 2012 R2 Datacenter |
| OS Version: | 6.3 (Build 9600) |
| Filesystem: | NTFS |
| JVM Vendor: | Oracle Corporation |
| JVM Version: | Java HotSpot(TM) 64-Bit Server VM (build 24.80-b11, mixed mode), version 1.7.0_80 |
| JVM Command-line Options: | -server -Xmn19g -Xms21g -Xmx21g -XX:SurvivorRatio=1 -XX:TargetSurvivorRatio=99 -XX:ParallelGCThreads=28 -XX:AllocatePrefetchDistance=256 -XX:AllocatePrefetchLines=4 -XX:LoopUnrollLimit=45 -XX:InitialTenuringThreshold=12 -XX:MaxTenuringThreshold=15 -XX:InlineSmallCode=9000 -XX:MaxInlineSize=270 -XX:FreqInlineSize=6000 -XX:+UseLargePages -XX:+UseParallelOldGC -XX:+AggressiveOpts |
| JVM Affinity: | start /NODE [0,1,2,3] /AFFINITY [0xFFFFFFF] |
| JVM Instances: | 4 |
| JVM Initial Heap (MB): | 21000 |
| JVM Maximum Heap (MB): | 21000 |
| JVM Address Bits: | 64 |
| Boot Firmware Version: | I42 v1.32 (02/01/2018) |
| Management Firmware Version: | 1.15 Aug 17 2017 |
| Workload Version: | SSJ 1.2.10 |
| Director Location: | Controller |
| Other Software: | HPE Composer Version 3.10.07 (HPE OneView) with HPE Synergy Custom SPP Bundle 2017.10.20180323; Microsoft Windows KB4054519, KB4056898 |
| JVM Instance | ssj_ops@100% |
|---|---|
| NODE03.001 | 1,419,600 |
| NODE03.002 | 1,430,723 |
| NODE03.003 | 1,437,110 |
| NODE03.004 | 1,422,326 |
| ssj_ops@100% | 5,709,759 |
| ssj_ops@100% per JVM | 1,427,440 |

| Target Load | Actual Load | ssj_ops | |
|---|---|---|---|
| Target | Actual | ||
| Calibration 1 | 1,426,482 | ||
| Calibration 2 | 1,420,617 | ||
| Calibration 3 | 1,425,481 | ||
| ssj_ops@calibrated=1,423,049 | |||
| 100% | 99.8% | 1,423,049 | 1,419,600 |
| 90% | 90.2% | 1,280,744 | 1,283,506 |
| 80% | 80.2% | 1,138,439 | 1,140,933 |
| 70% | 69.9% | 996,134 | 994,036 |
| 60% | 59.5% | 853,829 | 846,684 |
| 50% | 50.1% | 711,525 | 713,366 |
| 40% | 39.9% | 569,220 | 567,145 |
| 30% | 29.9% | 426,915 | 425,805 |
| 20% | 20.1% | 284,610 | 285,452 |
| 10% | 10.0% | 142,305 | 141,602 |
| Active Idle | 0 | 0 | |

| Target Load | Actual Load | ssj_ops | |
|---|---|---|---|
| Target | Actual | ||
| Calibration 1 | 1,438,575 | ||
| Calibration 2 | 1,431,184 | ||
| Calibration 3 | 1,433,354 | ||
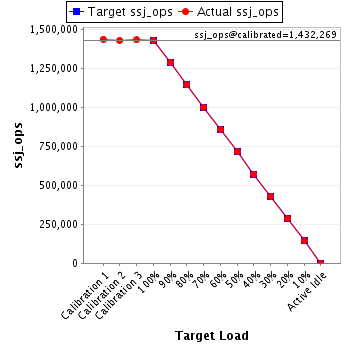
| ssj_ops@calibrated=1,432,269 | |||
| 100% | 99.9% | 1,432,269 | 1,430,723 |
| 90% | 90.0% | 1,289,042 | 1,288,826 |
| 80% | 79.9% | 1,145,815 | 1,145,013 |
| 70% | 70.0% | 1,002,588 | 1,002,210 |
| 60% | 60.0% | 859,361 | 859,109 |
| 50% | 49.9% | 716,134 | 714,843 |
| 40% | 40.0% | 572,908 | 572,622 |
| 30% | 30.0% | 429,681 | 429,116 |
| 20% | 20.0% | 286,454 | 285,918 |
| 10% | 10.0% | 143,227 | 142,941 |
| Active Idle | 0 | 0 | |
| Target Load | Actual Load | ssj_ops | |
|---|---|---|---|
| Target | Actual | ||
| Calibration 1 | 1,440,772 | ||
| Calibration 2 | 1,437,830 | ||
| Calibration 3 | 1,440,861 | ||
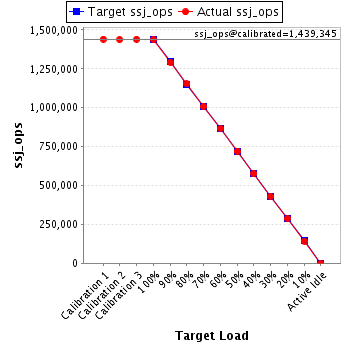
| ssj_ops@calibrated=1,439,345 | |||
| 100% | 99.8% | 1,439,345 | 1,437,110 |
| 90% | 89.8% | 1,295,411 | 1,292,291 |
| 80% | 80.1% | 1,151,476 | 1,153,183 |
| 70% | 70.1% | 1,007,542 | 1,008,790 |
| 60% | 60.1% | 863,607 | 865,667 |
| 50% | 50.0% | 719,673 | 719,718 |
| 40% | 40.0% | 575,738 | 575,476 |
| 30% | 30.0% | 431,804 | 432,019 |
| 20% | 20.0% | 287,869 | 288,037 |
| 10% | 9.9% | 143,935 | 142,832 |
| Active Idle | 0 | 0 | |
| Target Load | Actual Load | ssj_ops | |
|---|---|---|---|
| Target | Actual | ||
| Calibration 1 | 1,426,333 | ||
| Calibration 2 | 1,424,171 | ||
| Calibration 3 | 1,426,488 | ||
| ssj_ops@calibrated=1,425,330 | |||
| 100% | 99.8% | 1,425,330 | 1,422,326 |
| 90% | 89.9% | 1,282,797 | 1,281,777 |
| 80% | 80.0% | 1,140,264 | 1,140,483 |
| 70% | 70.0% | 997,731 | 997,180 |
| 60% | 60.1% | 855,198 | 856,325 |
| 50% | 49.9% | 712,665 | 711,501 |
| 40% | 40.0% | 570,132 | 569,466 |
| 30% | 30.0% | 427,599 | 428,126 |
| 20% | 20.0% | 285,066 | 285,435 |
| 10% | 10.1% | 142,533 | 143,567 |
| Active Idle | 0 | 0 | |
