SPECpower_ssj2008
Host 'WINDOWS-PQSE238' Performance Report
Copyright © 2007-2017 Standard Performance Evaluation Corporation
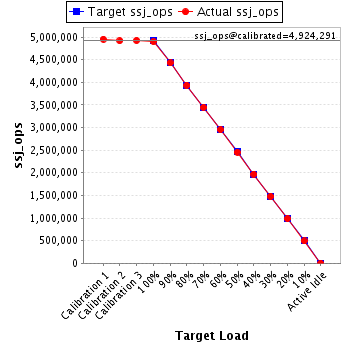
| Quanta Computer Inc. QuantaGrid T42S-2U | ssj_ops@100% = 4,901,361 ssj_ops@100% per JVM = 1,225,340 |
||||
| Test Sponsor: | Quanta Computer Inc. | SPEC License #: | 9050 | Test Method: | Multi Node |
| Tested By: | Quanta Computer Inc. | Test Location: | Taoyuan, TW, R.O.C | Test Date: | Sep 26, 2017 |
| Hardware Availability: | Jul-2017 | Software Availability: | Sep-2016 | Publication: | Oct 25, 2017 |
| System Source: | Single Supplier | System Designation: | Server | Power Provisioning: | Line-powered |
| Target Load | Actual Load | ssj_ops | |
|---|---|---|---|
| Target | Actual | ||
| Calibration 1 | 4,955,292 | ||
| Calibration 2 | 4,920,425 | ||
| Calibration 3 | 4,928,157 | ||
| ssj_ops@calibrated=4,924,291 | |||
| 100% | 99.5% | 4,924,291 | 4,901,361 |
| 90% | 90.0% | 4,431,862 | 4,430,307 |
| 80% | 79.9% | 3,939,433 | 3,936,558 |
| 70% | 70.0% | 3,447,004 | 3,447,304 |
| 60% | 60.0% | 2,954,575 | 2,952,578 |
| 50% | 49.9% | 2,462,146 | 2,458,378 |
| 40% | 40.0% | 1,969,716 | 1,970,752 |
| 30% | 30.0% | 1,477,287 | 1,478,163 |
| 20% | 20.0% | 984,858 | 983,786 |
| 10% | 10.0% | 492,429 | 492,274 |
| Active Idle | 0 | 0 | |

| Set Identifier: | T42S-2U |
| Set Description: | System Under Test |
| # of Identical Nodes: | 4 |
| Comment: | None |
| Hardware | |
|---|---|
| Hardware Vendor: | Quanta Computer Inc. |
| Model: | QuantaGrid T42S-2U |
| Form Factor: | 2U |
| CPU Name: | Intel Xeon Platinum 8176 |
| CPU Characteristics: | 28 core, 2.10GHz, 38.5MB L3 Cache |
| CPU Frequency (MHz): | 2100 |
| CPU(s) Enabled: | 56 cores, 2 chips, 28 cores/chip |
| Hardware Threads: | 112 (2 / core) |
| CPU(s) Orderable: | 1,2 chips |
| Primary Cache: | 32 KB I + 32 KB D on chip per core |
| Secondary Cache: | 1 MB I+D on chip per core |
| Tertiary Cache: | 39424 KB I+D on chip per chip |
| Other Cache: | None |
| Memory Amount (GB): | 192 |
| # and size of DIMM: | 12 x 16384 MB |
| Memory Details: | 16GB 2Rx8 PC4-2666V-RE1-12-PA0; slots A0, B0, C0, D0, E0, F0, populated for both Processor sockets |
| Power Supply Quantity and Rating (W): | 1 x 2200 |
| Power Supply Details: | None |
| Disk Drive: | 1 x 256G SATA SSD,Quanta P/N ABSAV256008 |
| Disk Controller: | Integrated SATA controller |
| # and type of Network Interface Cards (NICs) Installed: | 1 x dual-port Intel I357 Gigabit Ethernet controllerQuanta P/N 3GS5BMA00D0 |
| NICs Enabled in Firmware / OS / Connected: | 2/2/1 |
| Network Speed (Mbit): | 1000 |
| Keyboard: | None |
| Mouse: | None |
| Monitor: | None |
| Optical Drives: | No |
| Other Hardware: | None |
| Software | |
|---|---|
| Power Management: | Balanced power plan in OS |
| Operating System (OS): | Windows Server 2012 R2 Datacenter |
| OS Version: | Version 6.3.9600 (Build 9600 |
| Filesystem: | NTFS |
| JVM Vendor: | Oracle Corporation |
| JVM Version: | Oracle HotSpot(TM) 64-Bit Server VM (build 24.80-b11, mixed mode), version 1.7.0_80 |
| JVM Command-line Options: | -server -Xmx13g -Xms13g -Xmn11g -XX:SurvivorRatio=1 -XX:TargetSurvivorRatio=99 -XX:ParallelGCThreads=24 -XX:AllocatePrefetchDistance=256 -XX:AllocatePrefetchLines=4 -XX:LoopUnrollLimit=45 -XX:InitialTenuringThreshold=12 -XX:MaxTenuringThreshold=15 -XX:InlineSmallCode=9000 -XX:MaxInlineSize=270 -XX:FreqInlineSize=6000 -XX:+UseLargePages -XX:+UseParallelOldGC -XX:+AggressiveOpts -XX:+OptimizeStringConcat -XX:+UseStringCache |
| JVM Affinity: | start /NODE [0,1,2,3] /AFFINITY [0xFFFFFFF] |
| JVM Instances: | 4 |
| JVM Initial Heap (MB): | 13000 |
| JVM Maximum Heap (MB): | 13000 |
| JVM Address Bits: | 64 |
| Boot Firmware Version: | 3A03E7 |
| Management Firmware Version: | 3.20 |
| Workload Version: | SSJ 1.2.10 |
| Director Location: | Controller |
| Other Software: | Specpower_ssj.props input.load_level.number_warehouses set to 112 due to a known inconsistency in processor reporting with this java version |
| JVM Instance | ssj_ops@100% |
|---|---|
| WINDOWS-PQSE238.001 | 1,247,219 |
| WINDOWS-PQSE238.002 | 1,255,576 |
| WINDOWS-PQSE238.003 | 1,197,459 |
| WINDOWS-PQSE238.004 | 1,201,107 |
| ssj_ops@100% | 4,901,361 |
| ssj_ops@100% per JVM | 1,225,340 |

| Target Load | Actual Load | ssj_ops | |
|---|---|---|---|
| Target | Actual | ||
| Calibration 1 | 1,256,770 | ||
| Calibration 2 | 1,254,651 | ||
| Calibration 3 | 1,250,689 | ||
| ssj_ops@calibrated=1,252,670 | |||
| 100% | 99.6% | 1,252,670 | 1,247,219 |
| 90% | 90.0% | 1,127,403 | 1,127,143 |
| 80% | 79.8% | 1,002,136 | 999,700 |
| 70% | 69.8% | 876,869 | 874,504 |
| 60% | 59.8% | 751,602 | 749,483 |
| 50% | 50.0% | 626,335 | 626,940 |
| 40% | 40.0% | 501,068 | 501,684 |
| 30% | 30.1% | 375,801 | 376,599 |
| 20% | 20.0% | 250,534 | 250,980 |
| 10% | 10.0% | 125,267 | 125,400 |
| Active Idle | 0 | 0 | |

| Target Load | Actual Load | ssj_ops | |
|---|---|---|---|
| Target | Actual | ||
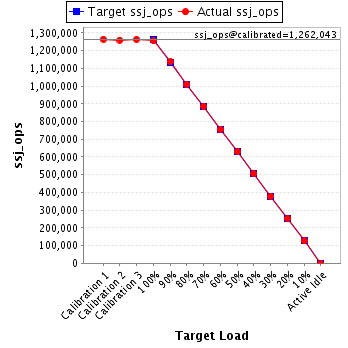
| Calibration 1 | 1,265,072 | ||
| Calibration 2 | 1,260,237 | ||
| Calibration 3 | 1,263,848 | ||
| ssj_ops@calibrated=1,262,043 | |||
| 100% | 99.5% | 1,262,043 | 1,255,576 |
| 90% | 90.0% | 1,135,838 | 1,136,454 |
| 80% | 80.0% | 1,009,634 | 1,009,766 |
| 70% | 70.2% | 883,430 | 886,237 |
| 60% | 59.9% | 757,226 | 755,621 |
| 50% | 50.0% | 631,021 | 630,770 |
| 40% | 40.0% | 504,817 | 505,141 |
| 30% | 30.0% | 378,613 | 378,018 |
| 20% | 19.9% | 252,409 | 251,745 |
| 10% | 10.0% | 126,204 | 126,386 |
| Active Idle | 0 | 0 | |

| Target Load | Actual Load | ssj_ops | |
|---|---|---|---|
| Target | Actual | ||
| Calibration 1 | 1,213,400 | ||
| Calibration 2 | 1,201,093 | ||
| Calibration 3 | 1,204,719 | ||
| ssj_ops@calibrated=1,202,906 | |||
| 100% | 99.5% | 1,202,906 | 1,197,459 |
| 90% | 90.1% | 1,082,615 | 1,083,670 |
| 80% | 80.2% | 962,325 | 964,537 |
| 70% | 69.9% | 842,034 | 840,936 |
| 60% | 60.0% | 721,744 | 721,575 |
| 50% | 49.8% | 601,453 | 598,762 |
| 40% | 39.9% | 481,162 | 480,557 |
| 30% | 29.9% | 360,872 | 359,533 |
| 20% | 19.9% | 240,581 | 239,219 |
| 10% | 10.0% | 120,291 | 120,101 |
| Active Idle | 0 | 0 | |

| Target Load | Actual Load | ssj_ops | |
|---|---|---|---|
| Target | Actual | ||
| Calibration 1 | 1,220,049 | ||
| Calibration 2 | 1,204,444 | ||
| Calibration 3 | 1,208,901 | ||
| ssj_ops@calibrated=1,206,673 | |||
| 100% | 99.5% | 1,206,673 | 1,201,107 |
| 90% | 89.8% | 1,086,005 | 1,083,040 |
| 80% | 79.8% | 965,338 | 962,555 |
| 70% | 70.1% | 844,671 | 845,627 |
| 60% | 60.2% | 724,004 | 725,900 |
| 50% | 49.9% | 603,336 | 601,905 |
| 40% | 40.1% | 482,669 | 483,371 |
| 30% | 30.2% | 362,002 | 364,013 |
| 20% | 20.0% | 241,335 | 241,842 |
| 10% | 10.0% | 120,667 | 120,387 |
| Active Idle | 0 | 0 | |
