| Target Load |
Actual Load |
ssj_ops |
| Target |
Actual |
| Calibration 1 |
|
|
3,069,394 |
| Calibration 2 |
|
|
3,222,650 |
| Calibration 3 |
|
|
3,230,909 |
| Calibration 4 |
|
|
3,234,479 |
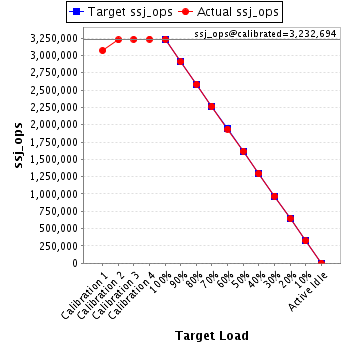
| ssj_ops@calibrated=3,232,694 |
| 100% |
100.0% |
3,232,694 |
3,231,698 |
| 90% |
89.9% |
2,909,425 |
2,906,711 |
| 80% |
79.9% |
2,586,155 |
2,584,271 |
| 70% |
70.0% |
2,262,886 |
2,263,620 |
| 60% |
59.9% |
1,939,616 |
1,937,836 |
| 50% |
50.1% |
1,616,347 |
1,618,047 |
| 40% |
40.0% |
1,293,078 |
1,292,232 |
| 30% |
30.0% |
969,808 |
970,277 |
| 20% |
20.0% |
646,539 |
646,383 |
| 10% |
10.0% |
323,269 |
322,218 |
| Active Idle |
|
0 |
0 |
| Hardware |
| Hardware Vendor: |
Fujitsu |
| Model: |
FUJITSU Server PRIMERGY RX2530 M1 |
| Form Factor: |
1U |
| CPU Name: |
Intel Xeon E5-2699 v3 |
| CPU Characteristics: |
18-Core, 2.30GHz, 45MB L3 Cache |
| CPU Frequency (MHz): |
2300 |
| CPU(s) Enabled: |
36 cores, 2 chips, 18 cores/chip |
| Hardware Threads: |
72 (2 / core) |
| CPU(s) Orderable: |
1,2 chips |
| Primary Cache: |
32 KB I + 32 KB D on chip per core |
| Secondary Cache: |
256 KB I+D on chip per core |
| Tertiary Cache: |
45 MB I+D on chip per chip |
| Other Cache: |
None |
| Memory Amount (GB): |
64 |
| # and size of DIMM: |
8 x 8192 MB |
| Memory Details: |
8 GB DDR4, registered, ECC, 2133 MHz, PC4-2133R, DIMM, 2Rx8; slots 1A, 1B, 1C, 1D, 1E, 1F, 1G, 1H populated |
| Power Supply Quantity and Rating (W): |
1 x 800 |
| Power Supply Details: |
Fujitsu Technology Solutions S26113-F615-E10 |
| Disk Drive: |
1 x DOM SATA 6G 64GB Main N H-P, S26361-F5522-E64 |
| Disk Controller: |
Integrated SATA Controller |
| # and type of Network Interface Cards (NICs) Installed: |
1 x PLAN AP 1x1Gbit Cu Intel I210-T1 LP (Copper), S26361-F3852-E201 |
| NICs Enabled in Firmware / OS / Connected: |
1/1/1 |
| Network Speed (Mbit): |
1000 |
| Keyboard: |
None |
| Mouse: |
None |
| Monitor: |
None |
| Optical Drives: |
No |
| Other Hardware: |
None |
| Software |
| Power Management: |
Enabled ("Fujitsu Enhanced Power Settings" power plan) |
| Operating System (OS): |
Microsoft Windows Server 2008 R2 Enterprise SP1 |
| OS Version: |
Version 6.1.7601 Service Pack 1 Build 7601 |
| Filesystem: |
NTFS |
| JVM Vendor: |
IBM Corporation |
| JVM Version: |
IBM J9 VM (build 2.6, JRE 1.7.0 Windows Server 2008 R2 amd64-64 20120322_106209 (JIT enabled, AOT enabled) |
| JVM Command-line Options: |
-Xmn825m -Xms975m -Xmx975m -Xaggressive -Xcompressedrefs -Xgcpolicy:gencon -XlockReservation -Xnoloa -XtlhPrefetch -Xlp -Xconcurrentlevel0 -Xthr:minimizeusercpu -Xgcthreads2 (-Xgcthreads1 for JVM5 and JVM23) |
| JVM Affinity: |
start /NODE [0,1,2,3] /AFFINITY [0x3,0xC,0x30,0xC0,0x300,0xC00,0x3000,0xC000,0x30000] |
| JVM Instances: |
36 |
| JVM Initial Heap (MB): |
975 |
| JVM Maximum Heap (MB): |
975 |
| JVM Address Bits: |
64 |
| Boot Firmware Version: |
R1.11.0 |
| Management Firmware Version: |
7.69F |
| Workload Version: |
SSJ 1.2.10 |
| Director Location: |
Controller |
| Other Software: |
IBM WebSphere Application Server V8.5.0.0, Microsoft Hotfix for Windows (KB2510206) |
| JVM Instance |
ssj_ops@100% |
| Node_01.001 |
89,375 |
| Node_01.002 |
89,221 |
| Node_01.003 |
90,116 |
| Node_01.004 |
90,223 |
| Node_01.005 |
87,012 |
| Node_01.006 |
89,815 |
| Node_01.007 |
89,280 |
| Node_01.008 |
90,875 |
| Node_01.009 |
91,049 |
| Node_01.010 |
88,323 |
| Node_01.011 |
88,915 |
| Node_01.012 |
90,028 |
| Node_01.013 |
91,236 |
| Node_01.014 |
91,432 |
| Node_01.015 |
88,548 |
| Node_01.016 |
90,001 |
| Node_01.017 |
89,724 |
| Node_01.018 |
89,448 |
| Node_01.019 |
88,919 |
| Node_01.020 |
89,512 |
| Node_01.021 |
90,635 |
| Node_01.022 |
91,180 |
| Node_01.023 |
86,535 |
| Node_01.024 |
90,659 |
| Node_01.025 |
89,601 |
| Node_01.026 |
90,572 |
| Node_01.027 |
90,581 |
| Node_01.028 |
88,494 |
| Node_01.029 |
88,661 |
| Node_01.030 |
90,397 |
| Node_01.031 |
90,314 |
| Node_01.032 |
90,906 |
| Node_01.033 |
88,985 |
| Node_01.034 |
90,707 |
| Node_01.035 |
90,769 |
| Node_01.036 |
89,651 |
| ssj_ops@100% |
3,231,698 |
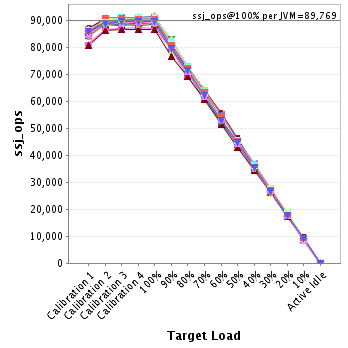
| ssj_ops@100% per JVM |
89,769 |
JVM 'Node_01.001' Scores:
| Target Load |
Actual Load |
ssj_ops |
| Target |
Actual |
| Calibration 1 |
|
|
85,408 |
| Calibration 2 |
|
|
89,473 |
| Calibration 3 |
|
|
89,635 |
| Calibration 4 |
|
|
89,465 |
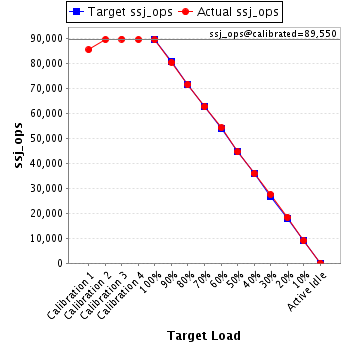
| ssj_ops@calibrated=89,550 |
| 100% |
99.8% |
89,550 |
89,375 |
| 90% |
89.8% |
80,595 |
80,377 |
| 80% |
79.8% |
71,640 |
71,475 |
| 70% |
69.9% |
62,685 |
62,620 |
| 60% |
60.5% |
53,730 |
54,217 |
| 50% |
49.7% |
44,775 |
44,516 |
| 40% |
40.1% |
35,820 |
35,918 |
| 30% |
30.6% |
26,865 |
27,433 |
| 20% |
20.6% |
17,910 |
18,419 |
| 10% |
10.0% |
8,955 |
8,962 |
| Active Idle |
|
0 |
0 |
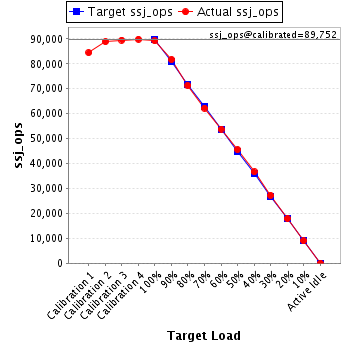
JVM 'Node_01.002' Scores:
| Target Load |
Actual Load |
ssj_ops |
| Target |
Actual |
| Calibration 1 |
|
|
84,477 |
| Calibration 2 |
|
|
88,906 |
| Calibration 3 |
|
|
89,584 |
| Calibration 4 |
|
|
89,921 |
| ssj_ops@calibrated=89,752 |
| 100% |
99.4% |
89,752 |
89,221 |
| 90% |
91.1% |
80,777 |
81,773 |
| 80% |
79.5% |
71,802 |
71,316 |
| 70% |
69.4% |
62,827 |
62,298 |
| 60% |
60.0% |
53,851 |
53,836 |
| 50% |
50.8% |
44,876 |
45,620 |
| 40% |
40.8% |
35,901 |
36,646 |
| 30% |
30.4% |
26,926 |
27,275 |
| 20% |
20.0% |
17,950 |
17,929 |
| 10% |
10.0% |
8,975 |
8,958 |
| Active Idle |
|
0 |
0 |
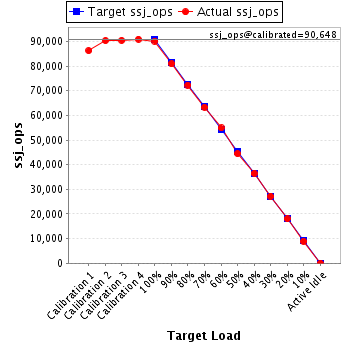
JVM 'Node_01.003' Scores:
| Target Load |
Actual Load |
ssj_ops |
| Target |
Actual |
| Calibration 1 |
|
|
86,226 |
| Calibration 2 |
|
|
90,297 |
| Calibration 3 |
|
|
90,393 |
| Calibration 4 |
|
|
90,903 |
| ssj_ops@calibrated=90,648 |
| 100% |
99.4% |
90,648 |
90,116 |
| 90% |
89.2% |
81,583 |
80,901 |
| 80% |
79.7% |
72,519 |
72,249 |
| 70% |
69.9% |
63,454 |
63,341 |
| 60% |
60.6% |
54,389 |
54,889 |
| 50% |
49.0% |
45,324 |
44,401 |
| 40% |
40.2% |
36,259 |
36,399 |
| 30% |
30.1% |
27,194 |
27,244 |
| 20% |
19.9% |
18,130 |
18,008 |
| 10% |
9.8% |
9,065 |
8,904 |
| Active Idle |
|
0 |
0 |
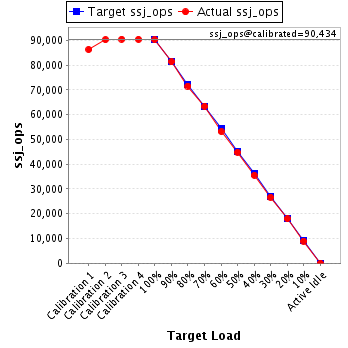
JVM 'Node_01.004' Scores:
| Target Load |
Actual Load |
ssj_ops |
| Target |
Actual |
| Calibration 1 |
|
|
86,289 |
| Calibration 2 |
|
|
90,234 |
| Calibration 3 |
|
|
90,448 |
| Calibration 4 |
|
|
90,420 |
| ssj_ops@calibrated=90,434 |
| 100% |
99.8% |
90,434 |
90,223 |
| 90% |
89.9% |
81,391 |
81,281 |
| 80% |
79.1% |
72,347 |
71,526 |
| 70% |
70.1% |
63,304 |
63,399 |
| 60% |
58.8% |
54,260 |
53,150 |
| 50% |
49.6% |
45,217 |
44,858 |
| 40% |
39.3% |
36,174 |
35,546 |
| 30% |
29.5% |
27,130 |
26,690 |
| 20% |
19.9% |
18,087 |
17,971 |
| 10% |
9.9% |
9,043 |
8,983 |
| Active Idle |
|
0 |
0 |
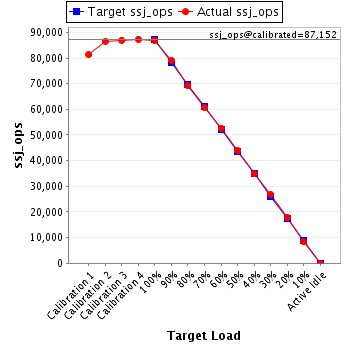
JVM 'Node_01.005' Scores:
| Target Load |
Actual Load |
ssj_ops |
| Target |
Actual |
| Calibration 1 |
|
|
81,342 |
| Calibration 2 |
|
|
86,597 |
| Calibration 3 |
|
|
86,954 |
| Calibration 4 |
|
|
87,349 |
| ssj_ops@calibrated=87,152 |
| 100% |
99.8% |
87,152 |
87,012 |
| 90% |
90.8% |
78,437 |
79,094 |
| 80% |
79.3% |
69,721 |
69,150 |
| 70% |
69.6% |
61,006 |
60,684 |
| 60% |
60.3% |
52,291 |
52,595 |
| 50% |
50.3% |
43,576 |
43,877 |
| 40% |
39.9% |
34,861 |
34,807 |
| 30% |
30.9% |
26,146 |
26,924 |
| 20% |
20.3% |
17,430 |
17,700 |
| 10% |
9.6% |
8,715 |
8,381 |
| Active Idle |
|
0 |
0 |
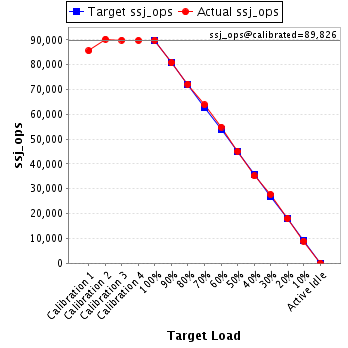
JVM 'Node_01.006' Scores:
| Target Load |
Actual Load |
ssj_ops |
| Target |
Actual |
| Calibration 1 |
|
|
85,525 |
| Calibration 2 |
|
|
90,262 |
| Calibration 3 |
|
|
89,870 |
| Calibration 4 |
|
|
89,782 |
| ssj_ops@calibrated=89,826 |
| 100% |
100.0% |
89,826 |
89,815 |
| 90% |
90.0% |
80,843 |
80,817 |
| 80% |
80.3% |
71,861 |
72,112 |
| 70% |
71.0% |
62,878 |
63,778 |
| 60% |
61.0% |
53,895 |
54,833 |
| 50% |
50.2% |
44,913 |
45,136 |
| 40% |
39.2% |
35,930 |
35,205 |
| 30% |
30.8% |
26,948 |
27,693 |
| 20% |
20.0% |
17,965 |
18,007 |
| 10% |
9.9% |
8,983 |
8,929 |
| Active Idle |
|
0 |
0 |
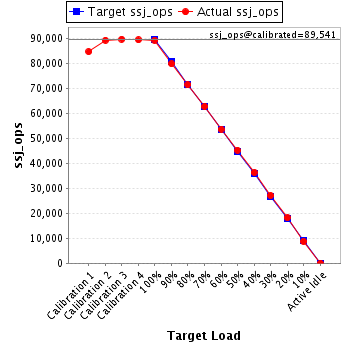
JVM 'Node_01.007' Scores:
| Target Load |
Actual Load |
ssj_ops |
| Target |
Actual |
| Calibration 1 |
|
|
84,684 |
| Calibration 2 |
|
|
89,307 |
| Calibration 3 |
|
|
89,705 |
| Calibration 4 |
|
|
89,377 |
| ssj_ops@calibrated=89,541 |
| 100% |
99.7% |
89,541 |
89,280 |
| 90% |
89.1% |
80,587 |
79,794 |
| 80% |
79.8% |
71,632 |
71,452 |
| 70% |
70.1% |
62,678 |
62,805 |
| 60% |
59.9% |
53,724 |
53,636 |
| 50% |
50.6% |
44,770 |
45,275 |
| 40% |
40.6% |
35,816 |
36,342 |
| 30% |
30.3% |
26,862 |
27,145 |
| 20% |
20.4% |
17,908 |
18,228 |
| 10% |
9.8% |
8,954 |
8,762 |
| Active Idle |
|
0 |
0 |
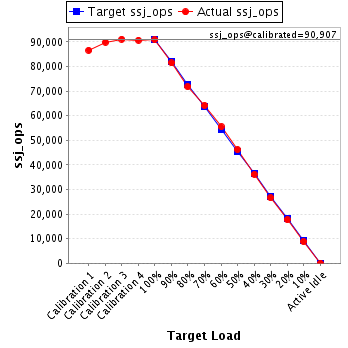
JVM 'Node_01.008' Scores:
| Target Load |
Actual Load |
ssj_ops |
| Target |
Actual |
| Calibration 1 |
|
|
86,587 |
| Calibration 2 |
|
|
89,912 |
| Calibration 3 |
|
|
91,093 |
| Calibration 4 |
|
|
90,721 |
| ssj_ops@calibrated=90,907 |
| 100% |
100.0% |
90,907 |
90,875 |
| 90% |
89.6% |
81,816 |
81,411 |
| 80% |
79.0% |
72,726 |
71,789 |
| 70% |
70.6% |
63,635 |
64,167 |
| 60% |
61.1% |
54,544 |
55,558 |
| 50% |
50.8% |
45,453 |
46,200 |
| 40% |
39.7% |
36,363 |
36,107 |
| 30% |
29.3% |
27,272 |
26,596 |
| 20% |
19.5% |
18,181 |
17,711 |
| 10% |
9.7% |
9,091 |
8,779 |
| Active Idle |
|
0 |
0 |
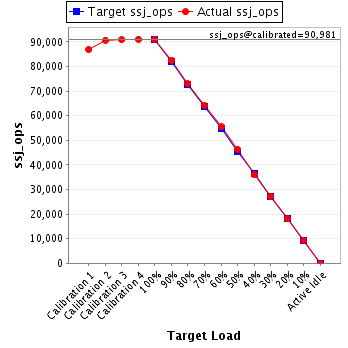
JVM 'Node_01.009' Scores:
| Target Load |
Actual Load |
ssj_ops |
| Target |
Actual |
| Calibration 1 |
|
|
86,857 |
| Calibration 2 |
|
|
90,718 |
| Calibration 3 |
|
|
90,868 |
| Calibration 4 |
|
|
91,095 |
| ssj_ops@calibrated=90,981 |
| 100% |
100.1% |
90,981 |
91,049 |
| 90% |
90.7% |
81,883 |
82,551 |
| 80% |
80.2% |
72,785 |
72,936 |
| 70% |
70.5% |
63,687 |
64,143 |
| 60% |
60.9% |
54,589 |
55,446 |
| 50% |
51.0% |
45,491 |
46,358 |
| 40% |
39.5% |
36,393 |
35,953 |
| 30% |
30.0% |
27,294 |
27,303 |
| 20% |
19.8% |
18,196 |
18,028 |
| 10% |
10.4% |
9,098 |
9,429 |
| Active Idle |
|
0 |
0 |
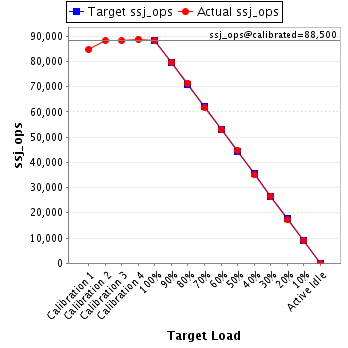
JVM 'Node_01.010' Scores:
| Target Load |
Actual Load |
ssj_ops |
| Target |
Actual |
| Calibration 1 |
|
|
84,702 |
| Calibration 2 |
|
|
88,269 |
| Calibration 3 |
|
|
88,164 |
| Calibration 4 |
|
|
88,836 |
| ssj_ops@calibrated=88,500 |
| 100% |
99.8% |
88,500 |
88,323 |
| 90% |
90.0% |
79,650 |
79,668 |
| 80% |
80.7% |
70,800 |
71,451 |
| 70% |
69.9% |
61,950 |
61,851 |
| 60% |
60.0% |
53,100 |
53,139 |
| 50% |
50.5% |
44,250 |
44,685 |
| 40% |
39.7% |
35,400 |
35,103 |
| 30% |
30.0% |
26,550 |
26,560 |
| 20% |
19.4% |
17,700 |
17,204 |
| 10% |
10.1% |
8,850 |
8,975 |
| Active Idle |
|
0 |
0 |
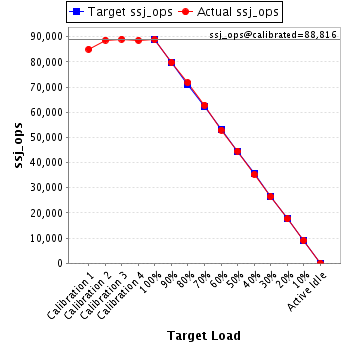
JVM 'Node_01.011' Scores:
| Target Load |
Actual Load |
ssj_ops |
| Target |
Actual |
| Calibration 1 |
|
|
85,035 |
| Calibration 2 |
|
|
88,677 |
| Calibration 3 |
|
|
89,028 |
| Calibration 4 |
|
|
88,604 |
| ssj_ops@calibrated=88,816 |
| 100% |
100.1% |
88,816 |
88,915 |
| 90% |
89.9% |
79,935 |
79,883 |
| 80% |
80.8% |
71,053 |
71,740 |
| 70% |
70.7% |
62,171 |
62,837 |
| 60% |
59.5% |
53,290 |
52,876 |
| 50% |
50.2% |
44,408 |
44,585 |
| 40% |
39.7% |
35,526 |
35,248 |
| 30% |
29.7% |
26,645 |
26,423 |
| 20% |
19.9% |
17,763 |
17,654 |
| 10% |
10.2% |
8,882 |
9,033 |
| Active Idle |
|
0 |
0 |
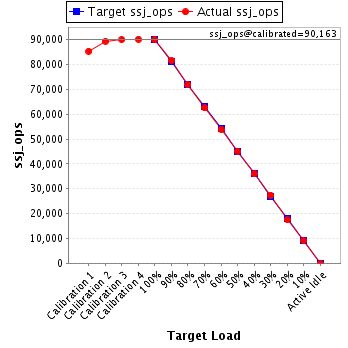
JVM 'Node_01.012' Scores:
| Target Load |
Actual Load |
ssj_ops |
| Target |
Actual |
| Calibration 1 |
|
|
85,380 |
| Calibration 2 |
|
|
89,453 |
| Calibration 3 |
|
|
90,071 |
| Calibration 4 |
|
|
90,255 |
| ssj_ops@calibrated=90,163 |
| 100% |
99.9% |
90,163 |
90,028 |
| 90% |
90.6% |
81,147 |
81,709 |
| 80% |
79.8% |
72,130 |
71,924 |
| 70% |
69.4% |
63,114 |
62,546 |
| 60% |
59.8% |
54,098 |
53,897 |
| 50% |
50.1% |
45,082 |
45,207 |
| 40% |
39.9% |
36,065 |
36,012 |
| 30% |
30.4% |
27,049 |
27,444 |
| 20% |
19.4% |
18,033 |
17,533 |
| 10% |
10.0% |
9,016 |
9,037 |
| Active Idle |
|
0 |
0 |
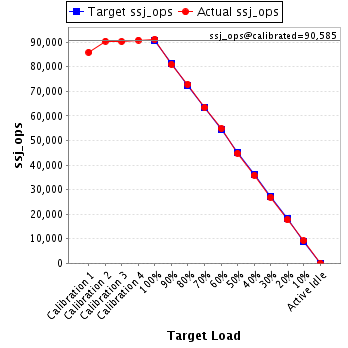
JVM 'Node_01.013' Scores:
| Target Load |
Actual Load |
ssj_ops |
| Target |
Actual |
| Calibration 1 |
|
|
85,843 |
| Calibration 2 |
|
|
90,462 |
| Calibration 3 |
|
|
90,281 |
| Calibration 4 |
|
|
90,890 |
| ssj_ops@calibrated=90,585 |
| 100% |
100.7% |
90,585 |
91,236 |
| 90% |
89.4% |
81,527 |
80,946 |
| 80% |
80.4% |
72,468 |
72,813 |
| 70% |
70.0% |
63,410 |
63,416 |
| 60% |
60.6% |
54,351 |
54,861 |
| 50% |
49.5% |
45,293 |
44,807 |
| 40% |
39.5% |
36,234 |
35,759 |
| 30% |
29.8% |
27,176 |
26,950 |
| 20% |
19.5% |
18,117 |
17,693 |
| 10% |
10.1% |
9,059 |
9,187 |
| Active Idle |
|
0 |
0 |
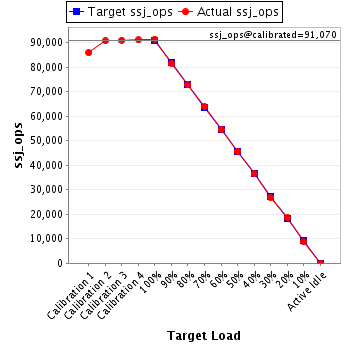
JVM 'Node_01.014' Scores:
| Target Load |
Actual Load |
ssj_ops |
| Target |
Actual |
| Calibration 1 |
|
|
85,876 |
| Calibration 2 |
|
|
90,738 |
| Calibration 3 |
|
|
91,045 |
| Calibration 4 |
|
|
91,096 |
| ssj_ops@calibrated=91,070 |
| 100% |
100.4% |
91,070 |
91,432 |
| 90% |
89.5% |
81,963 |
81,546 |
| 80% |
79.9% |
72,856 |
72,748 |
| 70% |
70.0% |
63,749 |
63,782 |
| 60% |
59.9% |
54,642 |
54,539 |
| 50% |
50.3% |
45,535 |
45,777 |
| 40% |
40.0% |
36,428 |
36,468 |
| 30% |
29.6% |
27,321 |
26,966 |
| 20% |
20.4% |
18,214 |
18,583 |
| 10% |
9.6% |
9,107 |
8,704 |
| Active Idle |
|
0 |
0 |
JVM 'Node_01.015' Scores:
| Target Load |
Actual Load |
ssj_ops |
| Target |
Actual |
| Calibration 1 |
|
|
83,786 |
| Calibration 2 |
|
|
88,645 |
| Calibration 3 |
|
|
88,652 |
| Calibration 4 |
|
|
88,860 |
| ssj_ops@calibrated=88,756 |
| 100% |
99.8% |
88,756 |
88,548 |
| 90% |
90.3% |
79,880 |
80,113 |
| 80% |
80.0% |
71,005 |
71,037 |
| 70% |
70.4% |
62,129 |
62,515 |
| 60% |
58.9% |
53,254 |
52,308 |
| 50% |
50.1% |
44,378 |
44,510 |
| 40% |
40.0% |
35,502 |
35,469 |
| 30% |
29.9% |
26,627 |
26,529 |
| 20% |
20.6% |
17,751 |
18,250 |
| 10% |
9.8% |
8,876 |
8,687 |
| Active Idle |
|
0 |
0 |
JVM 'Node_01.016' Scores:
| Target Load |
Actual Load |
ssj_ops |
| Target |
Actual |
| Calibration 1 |
|
|
86,041 |
| Calibration 2 |
|
|
90,156 |
| Calibration 3 |
|
|
89,550 |
| Calibration 4 |
|
|
90,712 |
| ssj_ops@calibrated=90,131 |
| 100% |
99.9% |
90,131 |
90,001 |
| 90% |
89.6% |
81,118 |
80,796 |
| 80% |
80.5% |
72,105 |
72,561 |
| 70% |
70.0% |
63,092 |
63,091 |
| 60% |
59.8% |
54,078 |
53,892 |
| 50% |
49.2% |
45,065 |
44,322 |
| 40% |
39.9% |
36,052 |
35,986 |
| 30% |
29.4% |
27,039 |
26,537 |
| 20% |
20.2% |
18,026 |
18,175 |
| 10% |
10.2% |
9,013 |
9,194 |
| Active Idle |
|
0 |
0 |
JVM 'Node_01.017' Scores:
| Target Load |
Actual Load |
ssj_ops |
| Target |
Actual |
| Calibration 1 |
|
|
85,393 |
| Calibration 2 |
|
|
89,446 |
| Calibration 3 |
|
|
89,735 |
| Calibration 4 |
|
|
89,969 |
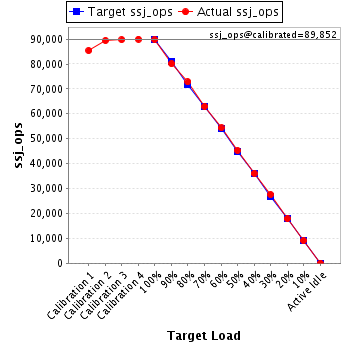
| ssj_ops@calibrated=89,852 |
| 100% |
99.9% |
89,852 |
89,724 |
| 90% |
89.1% |
80,867 |
80,097 |
| 80% |
81.0% |
71,882 |
72,819 |
| 70% |
70.1% |
62,896 |
63,004 |
| 60% |
60.5% |
53,911 |
54,366 |
| 50% |
50.4% |
44,926 |
45,289 |
| 40% |
40.1% |
35,941 |
36,044 |
| 30% |
30.7% |
26,956 |
27,572 |
| 20% |
19.9% |
17,970 |
17,866 |
| 10% |
10.1% |
8,985 |
9,111 |
| Active Idle |
|
0 |
0 |
JVM 'Node_01.018' Scores:
| Target Load |
Actual Load |
ssj_ops |
| Target |
Actual |
| Calibration 1 |
|
|
85,811 |
| Calibration 2 |
|
|
89,715 |
| Calibration 3 |
|
|
89,638 |
| Calibration 4 |
|
|
89,805 |
| ssj_ops@calibrated=89,721 |
| 100% |
99.7% |
89,721 |
89,448 |
| 90% |
90.1% |
80,749 |
80,809 |
| 80% |
80.6% |
71,777 |
72,327 |
| 70% |
71.0% |
62,805 |
63,723 |
| 60% |
59.7% |
53,833 |
53,587 |
| 50% |
50.1% |
44,861 |
44,908 |
| 40% |
40.2% |
35,888 |
36,049 |
| 30% |
30.1% |
26,916 |
27,023 |
| 20% |
20.4% |
17,944 |
18,283 |
| 10% |
10.2% |
8,972 |
9,137 |
| Active Idle |
|
0 |
0 |
JVM 'Node_01.019' Scores:
| Target Load |
Actual Load |
ssj_ops |
| Target |
Actual |
| Calibration 1 |
|
|
84,654 |
| Calibration 2 |
|
|
88,451 |
| Calibration 3 |
|
|
88,456 |
| Calibration 4 |
|
|
88,074 |
| ssj_ops@calibrated=88,265 |
| 100% |
100.7% |
88,265 |
88,919 |
| 90% |
89.4% |
79,438 |
78,904 |
| 80% |
80.6% |
70,612 |
71,158 |
| 70% |
69.7% |
61,785 |
61,520 |
| 60% |
60.1% |
52,959 |
53,041 |
| 50% |
49.9% |
44,132 |
44,023 |
| 40% |
40.6% |
35,306 |
35,843 |
| 30% |
29.1% |
26,479 |
25,666 |
| 20% |
20.4% |
17,653 |
17,962 |
| 10% |
10.0% |
8,826 |
8,833 |
| Active Idle |
|
0 |
0 |
JVM 'Node_01.020' Scores:
| Target Load |
Actual Load |
ssj_ops |
| Target |
Actual |
| Calibration 1 |
|
|
85,089 |
| Calibration 2 |
|
|
89,626 |
| Calibration 3 |
|
|
89,350 |
| Calibration 4 |
|
|
89,283 |
| ssj_ops@calibrated=89,317 |
| 100% |
100.2% |
89,317 |
89,512 |
| 90% |
89.0% |
80,385 |
79,488 |
| 80% |
79.6% |
71,453 |
71,115 |
| 70% |
70.2% |
62,522 |
62,723 |
| 60% |
59.9% |
53,590 |
53,544 |
| 50% |
49.5% |
44,658 |
44,182 |
| 40% |
40.6% |
35,727 |
36,256 |
| 30% |
29.8% |
26,795 |
26,660 |
| 20% |
19.8% |
17,863 |
17,703 |
| 10% |
10.1% |
8,932 |
9,016 |
| Active Idle |
|
0 |
0 |
JVM 'Node_01.021' Scores:
| Target Load |
Actual Load |
ssj_ops |
| Target |
Actual |
| Calibration 1 |
|
|
86,316 |
| Calibration 2 |
|
|
90,124 |
| Calibration 3 |
|
|
90,900 |
| Calibration 4 |
|
|
90,855 |
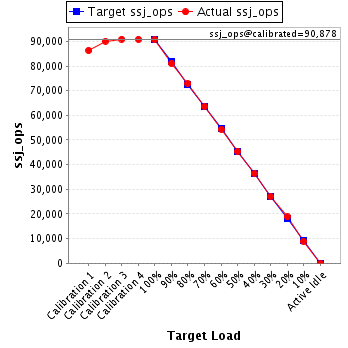
| ssj_ops@calibrated=90,878 |
| 100% |
99.7% |
90,878 |
90,635 |
| 90% |
89.2% |
81,790 |
81,106 |
| 80% |
80.3% |
72,702 |
72,990 |
| 70% |
69.9% |
63,614 |
63,515 |
| 60% |
59.8% |
54,527 |
54,331 |
| 50% |
49.9% |
45,439 |
45,352 |
| 40% |
40.1% |
36,351 |
36,447 |
| 30% |
29.8% |
27,263 |
27,073 |
| 20% |
20.8% |
18,176 |
18,887 |
| 10% |
9.8% |
9,088 |
8,917 |
| Active Idle |
|
0 |
0 |
JVM 'Node_01.022' Scores:
| Target Load |
Actual Load |
ssj_ops |
| Target |
Actual |
| Calibration 1 |
|
|
85,001 |
| Calibration 2 |
|
|
89,653 |
| Calibration 3 |
|
|
90,736 |
| Calibration 4 |
|
|
90,337 |
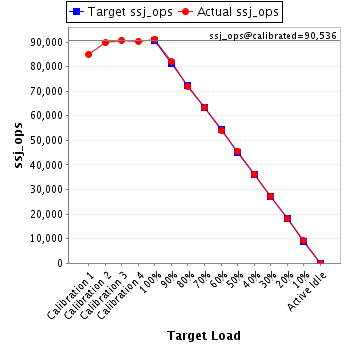
| ssj_ops@calibrated=90,536 |
| 100% |
100.7% |
90,536 |
91,180 |
| 90% |
90.6% |
81,483 |
82,006 |
| 80% |
79.3% |
72,429 |
71,826 |
| 70% |
69.9% |
63,375 |
63,253 |
| 60% |
59.6% |
54,322 |
53,971 |
| 50% |
50.4% |
45,268 |
45,597 |
| 40% |
40.0% |
36,215 |
36,182 |
| 30% |
30.0% |
27,161 |
27,196 |
| 20% |
19.9% |
18,107 |
18,015 |
| 10% |
10.1% |
9,054 |
9,129 |
| Active Idle |
|
0 |
0 |
JVM 'Node_01.023' Scores:
| Target Load |
Actual Load |
ssj_ops |
| Target |
Actual |
| Calibration 1 |
|
|
80,716 |
| Calibration 2 |
|
|
86,151 |
| Calibration 3 |
|
|
86,592 |
| Calibration 4 |
|
|
86,514 |
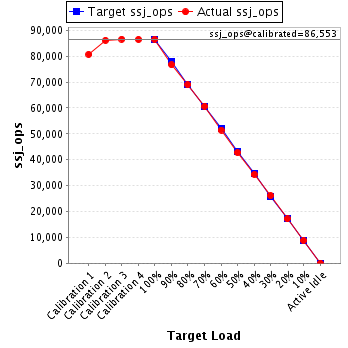
| ssj_ops@calibrated=86,553 |
| 100% |
100.0% |
86,553 |
86,535 |
| 90% |
88.6% |
77,898 |
76,678 |
| 80% |
79.7% |
69,242 |
68,981 |
| 70% |
70.2% |
60,587 |
60,736 |
| 60% |
59.5% |
51,932 |
51,488 |
| 50% |
49.4% |
43,276 |
42,750 |
| 40% |
39.7% |
34,621 |
34,320 |
| 30% |
30.2% |
25,966 |
26,118 |
| 20% |
19.8% |
17,311 |
17,132 |
| 10% |
10.2% |
8,655 |
8,821 |
| Active Idle |
|
0 |
0 |
JVM 'Node_01.024' Scores:
| Target Load |
Actual Load |
ssj_ops |
| Target |
Actual |
| Calibration 1 |
|
|
85,857 |
| Calibration 2 |
|
|
90,349 |
| Calibration 3 |
|
|
90,440 |
| Calibration 4 |
|
|
90,635 |
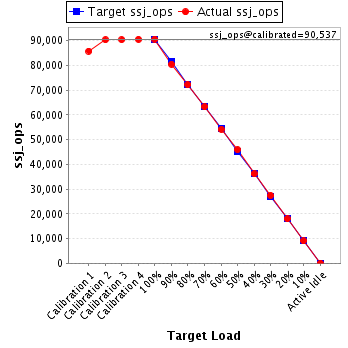
| ssj_ops@calibrated=90,537 |
| 100% |
100.1% |
90,537 |
90,659 |
| 90% |
89.0% |
81,484 |
80,571 |
| 80% |
79.7% |
72,430 |
72,203 |
| 70% |
69.9% |
63,376 |
63,288 |
| 60% |
59.8% |
54,322 |
54,151 |
| 50% |
50.7% |
45,269 |
45,915 |
| 40% |
40.0% |
36,215 |
36,180 |
| 30% |
30.3% |
27,161 |
27,444 |
| 20% |
19.8% |
18,107 |
17,961 |
| 10% |
10.0% |
9,054 |
9,012 |
| Active Idle |
|
0 |
0 |
JVM 'Node_01.025' Scores:
| Target Load |
Actual Load |
ssj_ops |
| Target |
Actual |
| Calibration 1 |
|
|
85,487 |
| Calibration 2 |
|
|
89,136 |
| Calibration 3 |
|
|
89,252 |
| Calibration 4 |
|
|
89,881 |
| ssj_ops@calibrated=89,567 |
| 100% |
100.0% |
89,567 |
89,601 |
| 90% |
91.1% |
80,610 |
81,619 |
| 80% |
79.5% |
71,653 |
71,199 |
| 70% |
70.6% |
62,697 |
63,255 |
| 60% |
60.0% |
53,740 |
53,735 |
| 50% |
50.3% |
44,783 |
45,065 |
| 40% |
40.4% |
35,827 |
36,208 |
| 30% |
29.7% |
26,870 |
26,617 |
| 20% |
19.2% |
17,913 |
17,241 |
| 10% |
9.9% |
8,957 |
8,837 |
| Active Idle |
|
0 |
0 |
JVM 'Node_01.026' Scores:
| Target Load |
Actual Load |
ssj_ops |
| Target |
Actual |
| Calibration 1 |
|
|
85,230 |
| Calibration 2 |
|
|
90,346 |
| Calibration 3 |
|
|
90,556 |
| Calibration 4 |
|
|
90,645 |
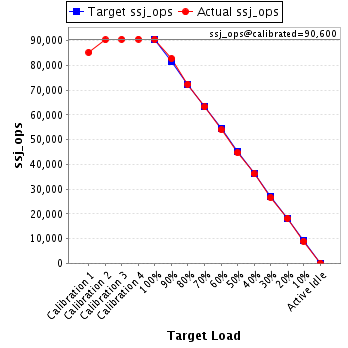
| ssj_ops@calibrated=90,600 |
| 100% |
100.0% |
90,600 |
90,572 |
| 90% |
91.3% |
81,540 |
82,754 |
| 80% |
79.9% |
72,480 |
72,356 |
| 70% |
69.8% |
63,420 |
63,225 |
| 60% |
59.6% |
54,360 |
54,022 |
| 50% |
49.3% |
45,300 |
44,684 |
| 40% |
39.9% |
36,240 |
36,148 |
| 30% |
29.4% |
27,180 |
26,601 |
| 20% |
20.1% |
18,120 |
18,167 |
| 10% |
9.8% |
9,060 |
8,850 |
| Active Idle |
|
0 |
0 |
JVM 'Node_01.027' Scores:
| Target Load |
Actual Load |
ssj_ops |
| Target |
Actual |
| Calibration 1 |
|
|
86,913 |
| Calibration 2 |
|
|
90,607 |
| Calibration 3 |
|
|
90,421 |
| Calibration 4 |
|
|
90,496 |
| ssj_ops@calibrated=90,459 |
| 100% |
100.1% |
90,459 |
90,581 |
| 90% |
90.5% |
81,413 |
81,888 |
| 80% |
79.4% |
72,367 |
71,852 |
| 70% |
70.1% |
63,321 |
63,389 |
| 60% |
59.7% |
54,275 |
54,028 |
| 50% |
50.3% |
45,229 |
45,544 |
| 40% |
39.2% |
36,184 |
35,433 |
| 30% |
29.9% |
27,138 |
27,046 |
| 20% |
19.8% |
18,092 |
17,918 |
| 10% |
10.0% |
9,046 |
9,016 |
| Active Idle |
|
0 |
0 |
JVM 'Node_01.028' Scores:
| Target Load |
Actual Load |
ssj_ops |
| Target |
Actual |
| Calibration 1 |
|
|
84,467 |
| Calibration 2 |
|
|
88,333 |
| Calibration 3 |
|
|
88,593 |
| Calibration 4 |
|
|
88,052 |
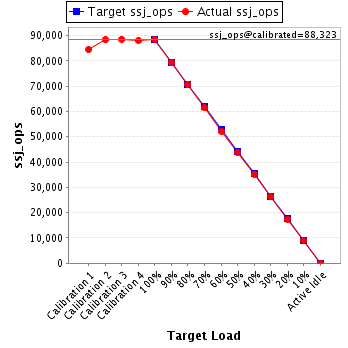
| ssj_ops@calibrated=88,323 |
| 100% |
100.2% |
88,323 |
88,494 |
| 90% |
89.7% |
79,490 |
79,226 |
| 80% |
80.0% |
70,658 |
70,654 |
| 70% |
69.6% |
61,826 |
61,476 |
| 60% |
59.1% |
52,994 |
52,214 |
| 50% |
49.8% |
44,161 |
43,979 |
| 40% |
39.9% |
35,329 |
35,272 |
| 30% |
29.8% |
26,497 |
26,329 |
| 20% |
19.8% |
17,665 |
17,491 |
| 10% |
10.2% |
8,832 |
9,008 |
| Active Idle |
|
0 |
0 |
JVM 'Node_01.029' Scores:
| Target Load |
Actual Load |
ssj_ops |
| Target |
Actual |
| Calibration 1 |
|
|
83,886 |
| Calibration 2 |
|
|
88,562 |
| Calibration 3 |
|
|
88,731 |
| Calibration 4 |
|
|
88,591 |
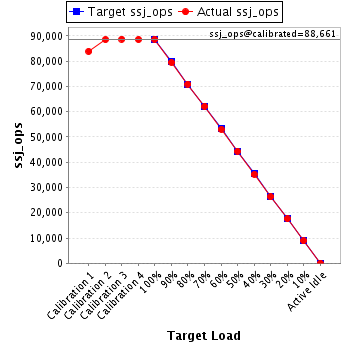
| ssj_ops@calibrated=88,661 |
| 100% |
100.0% |
88,661 |
88,661 |
| 90% |
89.7% |
79,795 |
79,520 |
| 80% |
80.0% |
70,929 |
70,917 |
| 70% |
70.1% |
62,063 |
62,148 |
| 60% |
59.8% |
53,197 |
52,993 |
| 50% |
50.1% |
44,331 |
44,406 |
| 40% |
39.7% |
35,464 |
35,209 |
| 30% |
29.7% |
26,598 |
26,310 |
| 20% |
19.9% |
17,732 |
17,612 |
| 10% |
10.0% |
8,866 |
8,846 |
| Active Idle |
|
0 |
0 |
JVM 'Node_01.030' Scores:
| Target Load |
Actual Load |
ssj_ops |
| Target |
Actual |
| Calibration 1 |
|
|
86,044 |
| Calibration 2 |
|
|
90,196 |
| Calibration 3 |
|
|
90,870 |
| Calibration 4 |
|
|
90,705 |
| ssj_ops@calibrated=90,787 |
| 100% |
99.6% |
90,787 |
90,397 |
| 90% |
90.0% |
81,709 |
81,730 |
| 80% |
79.8% |
72,630 |
72,430 |
| 70% |
70.0% |
63,551 |
63,529 |
| 60% |
60.7% |
54,472 |
55,111 |
| 50% |
50.3% |
45,394 |
45,624 |
| 40% |
40.5% |
36,315 |
36,789 |
| 30% |
29.7% |
27,236 |
26,958 |
| 20% |
20.4% |
18,157 |
18,515 |
| 10% |
9.9% |
9,079 |
8,946 |
| Active Idle |
|
0 |
0 |
JVM 'Node_01.031' Scores:
| Target Load |
Actual Load |
ssj_ops |
| Target |
Actual |
| Calibration 1 |
|
|
86,100 |
| Calibration 2 |
|
|
90,386 |
| Calibration 3 |
|
|
90,241 |
| Calibration 4 |
|
|
90,817 |
| ssj_ops@calibrated=90,529 |
| 100% |
99.8% |
90,529 |
90,314 |
| 90% |
90.2% |
81,476 |
81,648 |
| 80% |
80.2% |
72,423 |
72,591 |
| 70% |
70.6% |
63,370 |
63,947 |
| 60% |
60.1% |
54,317 |
54,378 |
| 50% |
50.1% |
45,264 |
45,387 |
| 40% |
40.2% |
36,211 |
36,349 |
| 30% |
30.5% |
27,159 |
27,607 |
| 20% |
20.2% |
18,106 |
18,325 |
| 10% |
10.0% |
9,053 |
9,042 |
| Active Idle |
|
0 |
0 |
JVM 'Node_01.032' Scores:
| Target Load |
Actual Load |
ssj_ops |
| Target |
Actual |
| Calibration 1 |
|
|
85,894 |
| Calibration 2 |
|
|
90,542 |
| Calibration 3 |
|
|
90,642 |
| Calibration 4 |
|
|
90,895 |
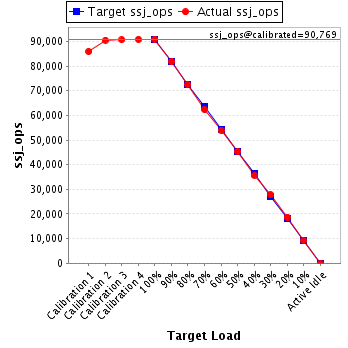
| ssj_ops@calibrated=90,769 |
| 100% |
100.2% |
90,769 |
90,906 |
| 90% |
90.1% |
81,692 |
81,795 |
| 80% |
79.9% |
72,615 |
72,489 |
| 70% |
68.7% |
63,538 |
62,316 |
| 60% |
59.2% |
54,461 |
53,762 |
| 50% |
50.0% |
45,384 |
45,400 |
| 40% |
39.3% |
36,307 |
35,654 |
| 30% |
30.6% |
27,231 |
27,813 |
| 20% |
20.6% |
18,154 |
18,726 |
| 10% |
10.1% |
9,077 |
9,212 |
| Active Idle |
|
0 |
0 |
JVM 'Node_01.033' Scores:
| Target Load |
Actual Load |
ssj_ops |
| Target |
Actual |
| Calibration 1 |
|
|
84,620 |
| Calibration 2 |
|
|
89,055 |
| Calibration 3 |
|
|
88,959 |
| Calibration 4 |
|
|
89,571 |
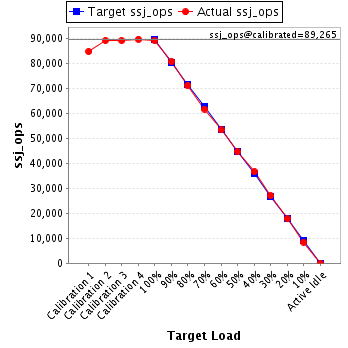
| ssj_ops@calibrated=89,265 |
| 100% |
99.7% |
89,265 |
88,985 |
| 90% |
90.4% |
80,338 |
80,663 |
| 80% |
79.7% |
71,412 |
71,110 |
| 70% |
69.1% |
62,485 |
61,647 |
| 60% |
59.7% |
53,559 |
53,287 |
| 50% |
49.9% |
44,632 |
44,504 |
| 40% |
41.1% |
35,706 |
36,647 |
| 30% |
30.2% |
26,779 |
26,994 |
| 20% |
19.9% |
17,853 |
17,765 |
| 10% |
9.5% |
8,926 |
8,470 |
| Active Idle |
|
0 |
0 |
JVM 'Node_01.034' Scores:
| Target Load |
Actual Load |
ssj_ops |
| Target |
Actual |
| Calibration 1 |
|
|
86,399 |
| Calibration 2 |
|
|
89,962 |
| Calibration 3 |
|
|
90,979 |
| Calibration 4 |
|
|
90,858 |
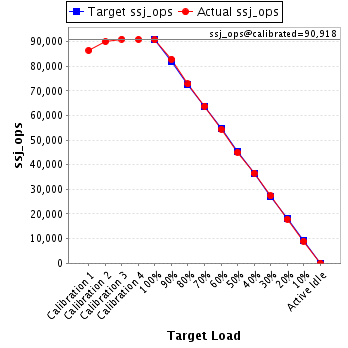
| ssj_ops@calibrated=90,918 |
| 100% |
99.8% |
90,918 |
90,707 |
| 90% |
91.1% |
81,827 |
82,805 |
| 80% |
80.0% |
72,735 |
72,780 |
| 70% |
70.1% |
63,643 |
63,774 |
| 60% |
59.8% |
54,551 |
54,409 |
| 50% |
49.5% |
45,459 |
45,046 |
| 40% |
40.2% |
36,367 |
36,554 |
| 30% |
30.0% |
27,276 |
27,308 |
| 20% |
19.7% |
18,184 |
17,925 |
| 10% |
9.9% |
9,092 |
8,967 |
| Active Idle |
|
0 |
0 |
JVM 'Node_01.035' Scores:
| Target Load |
Actual Load |
ssj_ops |
| Target |
Actual |
| Calibration 1 |
|
|
85,632 |
| Calibration 2 |
|
|
91,110 |
| Calibration 3 |
|
|
91,131 |
| Calibration 4 |
|
|
90,867 |
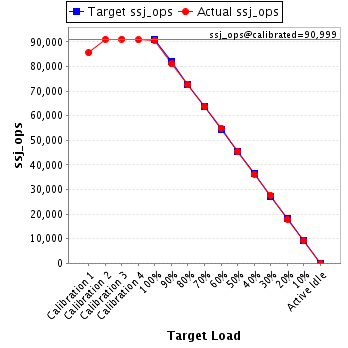
| ssj_ops@calibrated=90,999 |
| 100% |
99.7% |
90,999 |
90,769 |
| 90% |
89.1% |
81,899 |
81,043 |
| 80% |
79.8% |
72,799 |
72,634 |
| 70% |
69.9% |
63,699 |
63,619 |
| 60% |
60.4% |
54,599 |
54,945 |
| 50% |
50.0% |
45,499 |
45,479 |
| 40% |
39.7% |
36,400 |
36,143 |
| 30% |
30.3% |
27,300 |
27,615 |
| 20% |
19.7% |
18,200 |
17,942 |
| 10% |
10.0% |
9,100 |
9,116 |
| Active Idle |
|
0 |
0 |
JVM 'Node_01.036' Scores:
| Target Load |
Actual Load |
ssj_ops |
| Target |
Actual |
| Calibration 1 |
|
|
85,828 |
| Calibration 2 |
|
|
88,795 |
| Calibration 3 |
|
|
89,348 |
| Calibration 4 |
|
|
89,344 |
| ssj_ops@calibrated=89,346 |
| 100% |
100.3% |
89,346 |
89,651 |
| 90% |
89.2% |
80,412 |
79,703 |
| 80% |
80.1% |
71,477 |
71,560 |
| 70% |
69.7% |
62,543 |
62,262 |
| 60% |
59.1% |
53,608 |
52,803 |
| 50% |
50.1% |
44,673 |
44,781 |
| 40% |
39.8% |
35,739 |
35,537 |
| 30% |
29.8% |
26,804 |
26,613 |
| 20% |
20.0% |
17,869 |
17,852 |
| 10% |
10.1% |
8,935 |
9,025 |
| Active Idle |
|
0 |
0 |