SPECpower_ssj2008
Power/Temperature Details
Copyright © 2007-2011 Standard Performance Evaluation Corporation
| Hewlett-Packard Company ProLiant ML110 G4 | SPECpower_ssj2008 = 268 overall ssj_ops/watt | ||||
| Test Sponsor: | Intel Corp. | SPEC License #: | 3184 | Test Method: | Single Node |
| Tested By: | Principled Technologies, Inc. | Test Location: | Durham, NC, USA | Test Date: | Jan 19, 2011 |
| Hardware Availability: | Nov-2006 | Software Availability: | May-2009 | Publication: | Feb 17, 2011 |
| System Source: | Single Supplier | System Designation: | Server | Power Provisioning: | Line-powered |
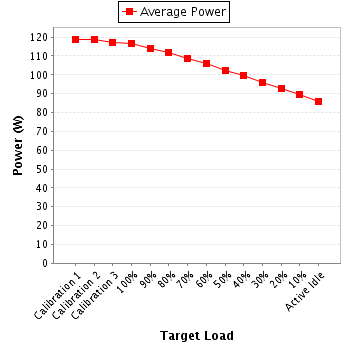
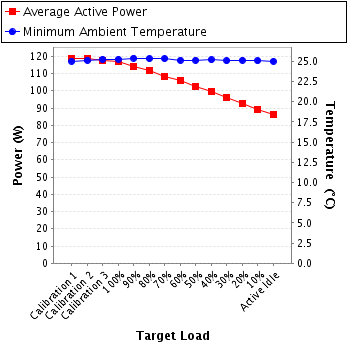
| Target Load | Average Active Power (W) | Minimum Ambient Temperature (°C) |
|---|---|---|
| Calibration 1 | 119 | 25.0 |
| Calibration 2 | 119 | 25.1 |
| Calibration 3 | 117 | 25.2 |
| 100% | 117 | 25.2 |
| 90% | 114 | 25.4 |
| 80% | 112 | 25.3 |
| 70% | 108 | 25.3 |
| 60% | 106 | 25.1 |
| 50% | 102 | 25.1 |
| 40% | 99.5 | 25.2 |
| 30% | 96.0 | 25.1 |
| 20% | 92.6 | 25.1 |
| 10% | 89.4 | 25.1 |
| Active Idle | 86.0 | 25.0 |
| Power Analyzer pwr1 | |
|---|---|
| Hardware Vendor: | Yokogawa Electric International Pte. Ltd. |
| Model: | WT210 |
| Serial Number: | 91GB45373 |
| Connectivity: | RS-232 |
| Input Connection: | Default |
| Calibration Institute: | NIST |
| Accredited by: | Davis Calibration |
| Calibration Label: | 07-1673 |
| Date of Calibration: | 28-Jul-2010 |
| PTDaemon Host System: | same as CCS |
| PTDaemon Host OS: | same as CCS |
| PTDaemon Version: | 1.4.0-7071d9e7 |
| Setup Description: | SUT Power Supply |
| Temperature Sensor temp1 | |
|---|---|
| Hardware Vendor: | Digi International Inc. |
| Model: | Watchport/H |
| Driver Version: | 5.10.26.0 |
| Connectivity: | USB |
| PTDaemon Host System: | same as CCS |
| PTDaemon Host OS: | same as CCS |
| Setup Description: | 50 mm in front of SUT main air intake |
This benchmark result is intended to provide perspective on past power and/or performance using the historical hardware and/or software described on this result page.
The system as described on this result page was formerly generally available. At the time of this publication, it may not be shipping, and/or may not be supported, and/or may fail to meet other tests of General Availability described in the SPEC OSG Policy document, http://www.spec.org/osg/policy.html
This measured result may not be representative of the result that would be measured were this benchmark run with hardware and software available as of the publication date.
| Target Load | Voltage (V) | Current (A) | Avg Power Factor | Avg Active Power (W) | Power Measurement Uncertainty (%) | ||
|---|---|---|---|---|---|---|---|
| Avg | Range | Avg | Range | ||||
| Calibration 1 | 122 | 150.0 | 0.985 | 2.0 | 0.986 | 119 | 0.4% |
| Calibration 2 | 122 | 150.0 | 0.987 | 2.0 | 0.987 | 119 | 0.4% |
| Calibration 3 | 122 | 150.0 | 0.974 | 2.0 | 0.986 | 117 | 0.4% |
| 100% | 122 | 150.0 | 0.969 | 2.0 | 0.986 | 117 | 0.4% |
| 90% | 122 | 150.0 | 0.950 | 2.0 | 0.985 | 114 | 0.4% |
| 80% | 121 | 150.0 | 0.937 | 2.0 | 0.983 | 112 | 0.4% |
| 70% | 120 | 150.0 | 0.920 | 2.0 | 0.981 | 108 | 0.4% |
| 60% | 120 | 150.0 | 0.898 | 2.0 | 0.979 | 106 | 0.4% |
| 50% | 120 | 150.0 | 0.869 | 2.0 | 0.977 | 102 | 0.4% |
| 40% | 120 | 150.0 | 0.848 | 2.0 | 0.976 | 99.5 | 0.4% |
| 30% | 121 | 150.0 | 0.817 | 2.0 | 0.975 | 96.0 | 0.5% |
| 20% | 120 | 150.0 | 0.790 | 2.0 | 0.976 | 92.6 | 0.5% |
| 10% | 121 | 150.0 | 0.759 | 2.0 | 0.976 | 89.4 | 0.5% |
| Active Idle | 120 | 150.0 | 0.729 | 2.0 | 0.979 | 86.0 | 0.5% |