SPECpower_ssj2008
Host 'CLASSIC2' Performance Report
Copyright © 2007-2010 Standard Performance Evaluation Corporation
| NEC Corporation Express5800/R120b-2 | ssj_ops@100% = 806,218 ssj_ops@100% per JVM = 134,370 |
||||
| Test Sponsor: | NEC Corporation | SPEC License #: | 9006 | Test Method: | Single Node |
| Tested By: | NEC Corporation | Test Location: | Fuchu, Tokyo, Japan | Test Date: | Jul 16, 2010 |
| Hardware Availability: | Jun-2010 | Software Availability: | Feb-2010 | Publication: | Aug 25, 2010 |
| System Source: | Single Supplier | System Designation: | Server | Power Provisioning: | Line-powered |
| Target Load | Actual Load | ssj_ops | |
|---|---|---|---|
| Target | Actual | ||
| Calibration 1 | 812,818 | ||
| Calibration 2 | 809,537 | ||
| Calibration 3 | 809,546 | ||
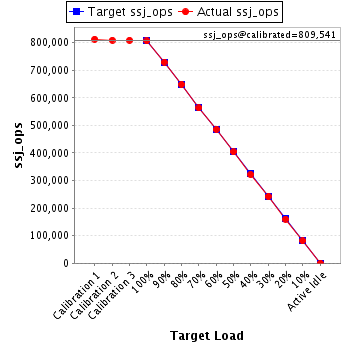
| ssj_ops@calibrated=809,541 | |||
| 100% | 99.6% | 809,541 | 806,218 |
| 90% | 90.2% | 728,587 | 729,850 |
| 80% | 80.1% | 647,633 | 648,735 |
| 70% | 69.6% | 566,679 | 563,271 |
| 60% | 60.0% | 485,725 | 485,871 |
| 50% | 49.9% | 404,771 | 403,696 |
| 40% | 39.7% | 323,817 | 321,651 |
| 30% | 29.9% | 242,862 | 242,373 |
| 20% | 19.8% | 161,908 | 160,358 |
| 10% | 10.0% | 80,954 | 81,277 |
| Active Idle | 0 | 0 | |
| Set Identifier: | sut |
| Set Description: | Express5800/R120b-2 (Intel Xeon X5670, 2.93 GHz) |
| # of Identical Nodes: | 1 |
| Comment: | None |
| Hardware | |
|---|---|
| Hardware Vendor: | NEC Corporation |
| Model: | Express5800/R120b-2 |
| Form Factor: | 2U |
| CPU Name: | Intel Xeon X5670 |
| CPU Characteristics: | Hexa-Core, 2.93 GHz, 12 MB L3 Cache |
| CPU Frequency (MHz): | 2933 |
| CPU(s) Enabled: | 12 cores, 2 chips, 6 cores/chip |
| Hardware Threads: | 24 (2 / core) |
| CPU(s) Orderable: | 1,2 chips |
| Primary Cache: | 32 KB I + 32 KB D on chip per core |
| Secondary Cache: | 256 KB I+D on chip per core |
| Tertiary Cache: | 12 MB I+D on chip per chip |
| Other Cache: | None |
| Memory Amount (GB): | 16 |
| # and size of DIMM: | 4 x 4096 MB |
| Memory Details: | 4GB 2Rx4 PC3L-10600R ECC CL9; slots CPU1_DIMM1, CPU1_DIMM2, CPU2_DIMM1 and CPU2_DIMM2 populated |
| Power Supply Quantity and Rating (W): | 1 x 750 |
| Power Supply Details: | Delta DPS-750VB A |
| Disk Drive: | 1 x 50GB SSD SATA, NEC P/N:N8150-702 |
| Disk Controller: | Integrated SATA controller |
| # and type of Network Interface Cards (NICs) Installed: | 1 x Integrated Intel 82576 Gigabit Dual Port Ethernet Controller |
| NICs Enabled in Firmware / OS / Connected: | 2/1/1 |
| Network Speed (Mbit): | 1000 |
| Keyboard: | None |
| Mouse: | None |
| Monitor: | None |
| Optical Drives: | No |
| Other Hardware: | None |
| Software | |
|---|---|
| Power Management: | Power saver |
| Operating System (OS): | Microsoft Windows Server 2008 Enterprise x64 Edition |
| OS Version: | SP2 |
| Filesystem: | NTFS |
| JVM Vendor: | Oracle Corporation |
| JVM Version: | Oracle JRockit(R) 6 P28.0.0 (build P28.0.0-29_BR8175970_BR9402966-129478-1.6.0_11-20100223-1645-windows-x86_64) |
| JVM Command-line Options: | -Xms2400m -Xmx2400m -Xns2200m -XXaggressive -Xlargepages -Xgc:genpar -XXcallprofiling -XXgcthreads=2 -XXtlasize:min=4k,preferred=1024k |
| JVM Affinity: | start /affinity [F,F0,F00,F000,F0000,F00000] |
| JVM Instances: | 6 |
| JVM Initial Heap (MB): | 2400 |
| JVM Maximum Heap (MB): | 2400 |
| JVM Address Bits: | 64 |
| Boot Firmware Version: | 4.6.0C12 |
| Management Firmware Version: | 1.26 |
| Workload Version: | SSJ 1.2.6 |
| Director Location: | Controller |
| Other Software: | None |
| JVM Instance | ssj_ops@100% |
|---|---|
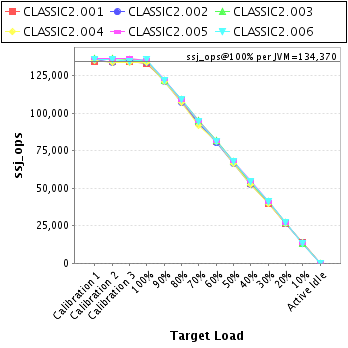
| CLASSIC2.001 | 133,039 |
| CLASSIC2.002 | 133,377 |
| CLASSIC2.003 | 135,085 |
| CLASSIC2.004 | 133,552 |
| CLASSIC2.005 | 135,302 |
| CLASSIC2.006 | 135,863 |
| ssj_ops@100% | 806,218 |
| ssj_ops@100% per JVM | 134,370 |
| Target Load | Actual Load | ssj_ops | |
|---|---|---|---|
| Target | Actual | ||
| Calibration 1 | 134,158 | ||
| Calibration 2 | 134,540 | ||
| Calibration 3 | 134,360 | ||
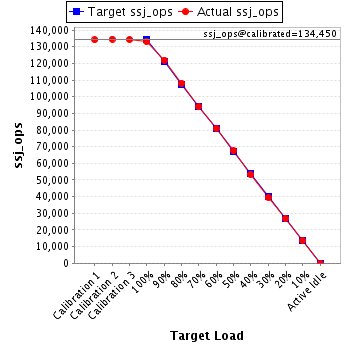
| ssj_ops@calibrated=134,450 | |||
| 100% | 99.0% | 134,450 | 133,039 |
| 90% | 90.7% | 121,005 | 121,935 |
| 80% | 80.4% | 107,560 | 108,083 |
| 70% | 69.9% | 94,115 | 93,995 |
| 60% | 60.2% | 80,670 | 80,990 |
| 50% | 50.2% | 67,225 | 67,463 |
| 40% | 39.7% | 53,780 | 53,435 |
| 30% | 29.4% | 40,335 | 39,463 |
| 20% | 19.9% | 26,890 | 26,755 |
| 10% | 10.2% | 13,445 | 13,665 |
| Active Idle | 0 | 0 | |
| Target Load | Actual Load | ssj_ops | |
|---|---|---|---|
| Target | Actual | ||
| Calibration 1 | 135,560 | ||
| Calibration 2 | 133,684 | ||
| Calibration 3 | 134,875 | ||
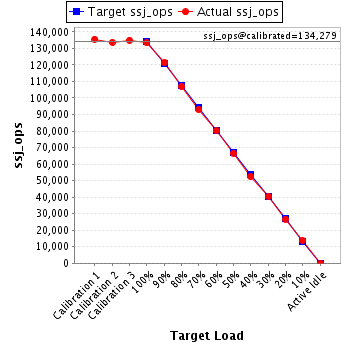
| ssj_ops@calibrated=134,279 | |||
| 100% | 99.3% | 134,279 | 133,377 |
| 90% | 90.3% | 120,851 | 121,276 |
| 80% | 79.6% | 107,423 | 106,836 |
| 70% | 69.3% | 93,995 | 93,098 |
| 60% | 59.7% | 80,568 | 80,133 |
| 50% | 49.6% | 67,140 | 66,644 |
| 40% | 39.2% | 53,712 | 52,585 |
| 30% | 30.1% | 40,284 | 40,478 |
| 20% | 19.9% | 26,856 | 26,730 |
| 10% | 10.2% | 13,428 | 13,701 |
| Active Idle | 0 | 0 | |
| Target Load | Actual Load | ssj_ops | |
|---|---|---|---|
| Target | Actual | ||
| Calibration 1 | 136,147 | ||
| Calibration 2 | 136,090 | ||
| Calibration 3 | 135,791 | ||
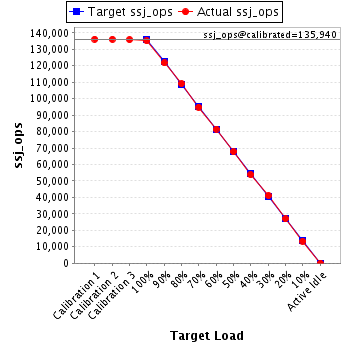
| ssj_ops@calibrated=135,940 | |||
| 100% | 99.4% | 135,940 | 135,085 |
| 90% | 89.6% | 122,346 | 121,755 |
| 80% | 80.2% | 108,752 | 109,083 |
| 70% | 69.8% | 95,158 | 94,888 |
| 60% | 60.0% | 81,564 | 81,557 |
| 50% | 49.8% | 67,970 | 67,765 |
| 40% | 39.6% | 54,376 | 53,806 |
| 30% | 30.3% | 40,782 | 41,127 |
| 20% | 19.8% | 27,188 | 26,973 |
| 10% | 9.9% | 13,594 | 13,452 |
| Active Idle | 0 | 0 | |
| Target Load | Actual Load | ssj_ops | |
|---|---|---|---|
| Target | Actual | ||
| Calibration 1 | 134,900 | ||
| Calibration 2 | 133,796 | ||
| Calibration 3 | 133,732 | ||
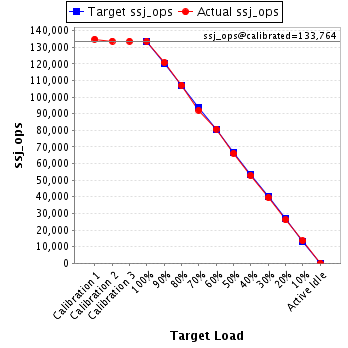
| ssj_ops@calibrated=133,764 | |||
| 100% | 99.8% | 133,764 | 133,552 |
| 90% | 90.3% | 120,388 | 120,762 |
| 80% | 80.2% | 107,011 | 107,262 |
| 70% | 68.8% | 93,635 | 92,009 |
| 60% | 60.4% | 80,259 | 80,792 |
| 50% | 49.4% | 66,882 | 66,117 |
| 40% | 39.4% | 53,506 | 52,680 |
| 30% | 29.5% | 40,129 | 39,520 |
| 20% | 19.5% | 26,753 | 26,149 |
| 10% | 10.1% | 13,376 | 13,539 |
| Active Idle | 0 | 0 | |
| Target Load | Actual Load | ssj_ops | |
|---|---|---|---|
| Target | Actual | ||
| Calibration 1 | 136,541 | ||
| Calibration 2 | 136,032 | ||
| Calibration 3 | 136,353 | ||
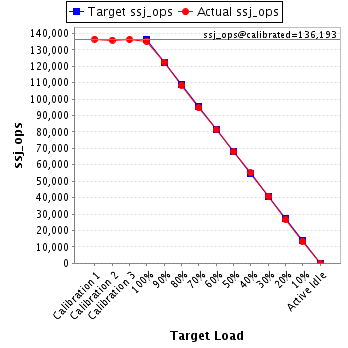
| ssj_ops@calibrated=136,193 | |||
| 100% | 99.3% | 136,193 | 135,302 |
| 90% | 90.0% | 122,573 | 122,587 |
| 80% | 79.7% | 108,954 | 108,544 |
| 70% | 69.6% | 95,335 | 94,780 |
| 60% | 59.7% | 81,716 | 81,279 |
| 50% | 49.8% | 68,096 | 67,795 |
| 40% | 40.4% | 54,477 | 55,021 |
| 30% | 30.1% | 40,858 | 40,978 |
| 20% | 19.7% | 27,239 | 26,814 |
| 10% | 9.9% | 13,619 | 13,440 |
| Active Idle | 0 | 0 | |
| Target Load | Actual Load | ssj_ops | |
|---|---|---|---|
| Target | Actual | ||
| Calibration 1 | 135,511 | ||
| Calibration 2 | 135,396 | ||
| Calibration 3 | 134,434 | ||
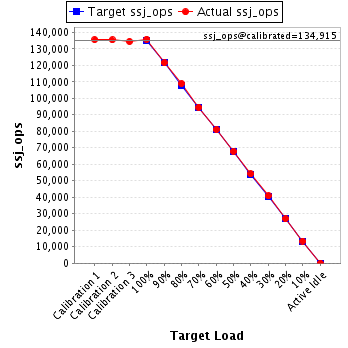
| ssj_ops@calibrated=134,915 | |||
| 100% | 100.7% | 134,915 | 135,863 |
| 90% | 90.1% | 121,423 | 121,534 |
| 80% | 80.7% | 107,932 | 108,927 |
| 70% | 70.0% | 94,440 | 94,501 |
| 60% | 60.1% | 80,949 | 81,121 |
| 50% | 50.3% | 67,457 | 67,911 |
| 40% | 40.1% | 53,966 | 54,124 |
| 30% | 30.2% | 40,474 | 40,807 |
| 20% | 20.0% | 26,983 | 26,937 |
| 10% | 10.0% | 13,491 | 13,481 |
| Active Idle | 0 | 0 | |