
SPECpower_ssj2008
Aggregate Performance Report
Copyright © 2007-2010 Standard Performance Evaluation Corporation
| NEC Corporation Express5800/A1080a-D | ssj_ops@100% = 3,385,385 ssj_ops@100% per Host = 1,692,693 ssj_ops@100% per JVM = 105,793 |
||||
| Test Sponsor: | NEC Corporation | SPEC License #: | 9006 | Test Method: | Multi Node |
| Tested By: | NEC Corporation | Test Location: | Fuchu, Tokyo, Japan | Test Date: | Jul 5, 2010 |
| Hardware Availability: | May-2010 | Software Availability: | May-2009 | Publication: | Jul 28, 2010 |
| System Source: | Single Supplier | System Designation: | Server | Power Provisioning: | Line-powered |
| Target Load | Actual Load | ssj_ops | |
|---|---|---|---|
| Target | Actual | ||
| Calibration 1 | 3,373,121 | ||
| Calibration 2 | 3,435,124 | ||
| Calibration 3 | 3,433,650 | ||
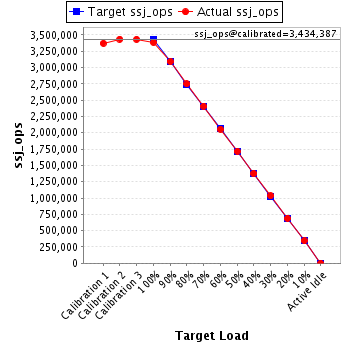
| ssj_ops@calibrated=3,434,387 | |||
| 100% | 98.6% | 3,434,387 | 3,385,385 |
| 90% | 90.1% | 3,090,948 | 3,093,154 |
| 80% | 80.0% | 2,747,509 | 2,749,151 |
| 70% | 70.2% | 2,404,071 | 2,410,547 |
| 60% | 59.9% | 2,060,632 | 2,057,038 |
| 50% | 50.0% | 1,717,193 | 1,716,118 |
| 40% | 40.0% | 1,373,755 | 1,373,590 |
| 30% | 30.1% | 1,030,316 | 1,032,561 |
| 20% | 20.1% | 686,877 | 689,537 |
| 10% | 10.0% | 343,439 | 344,738 |
| Active Idle | 0 | 0 | |
| # of Nodes | # of Chips | # of Cores | # of Threads | Total RAM (GB) | # of OS Images | # of JVM Instances |
|---|---|---|---|---|---|---|
| 2 | 8 | 64 | 128 | 128 | 2 | 32 |
| Set Identifier: | sut |
| Set Description: | Express5800/A1080a-D (Intel Xeon X7560, 2.26 GHz) |
| # of Identical Nodes: | 2 |
| Comment: | None |
| Hardware per Node | |
|---|---|
| Hardware Vendor: | NEC Corporation |
| Model: | Express5800/A1080a-D |
| Form Factor: | Other |
| CPU Name: | Intel Xeon X7560 |
| CPU Characteristics: | Octa-Core, 2.26 GHz, 24 MB L3 Cache |
| CPU Frequency (MHz): | 2266 |
| CPU(s) Enabled: | 32 cores, 4 chips, 8 cores/chip |
| Hardware Threads: | 64 (2 / core) |
| CPU(s) Orderable: | 1,2,3,4 chips |
| Primary Cache: | 32 KB I + 32 KB D on chip per core |
| Secondary Cache: | 256 KB I+D on chip per core |
| Tertiary Cache: | 24 MB I+D on chip per chip |
| Other Cache: | None |
| Memory Amount (GB): | 64 |
| # and size of DIMM: | 16 x 4096 MB |
| Memory Details: | 4GB 2Rx4 PC3-8500R ECC CL7; slots DIMM#1-DIMM#4 populated on each PMM (Processor Memory Module) |
| Power Supply Quantity and Rating (W): | None |
| Power Supply Details: | Shared |
| Disk Drive: | 1 x 300GB 10krpm HDD 2.5inch SAS |
| Disk Controller: | 6Gbps SAS RAID Controller for Embedded HDD/SSD |
| # and type of Network Interface Cards (NICs) Installed: | 1 x Integrated Intel 82576 Gigabit Dual Port Ethernet Controller |
| NICs Enabled in Firmware / OS / Connected: | 2/1/1 |
| Network Speed (Mbit): | 1000 |
| Keyboard: | None |
| Mouse: | None |
| Monitor: | None |
| Optical Drives: | No |
| Other Hardware: | None |
| Software per Node | |
|---|---|
| Power Management: | Power saver |
| Operating System (OS): | Microsoft Windows Server 2008 Enterprise x64 Edition |
| OS Version: | SP2 |
| Filesystem: | NTFS |
| JVM Vendor: | Oracle Corporation |
| JVM Version: | Oracle JRockit(R) 6 P28.0.0 (build P28.0.0-29-114096-1.6.0_11-20090427-1759-windows-x86_64) |
| JVM Command-line Options: | -Xms3700m -Xmx3700m -Xns3300m -XXaggressive -Xlargepages -Xgc:genpar -XXcallprofiling -XXgcthreads=2 -XXtlasize:min=4k,preferred=1024k |
| JVM Affinity: | start /affinity [F,F0,....,F00000000000000,F000000000000000] |
| JVM Instances: | 16 |
| JVM Initial Heap (MB): | 3700 |
| JVM Maximum Heap (MB): | 3700 |
| JVM Address Bits: | 64 |
| Boot Firmware Version: | 1.31 |
| Management Firmware Version: | 1.1.1.8 |
| Workload Version: | SSJ 1.2.6 |
| Director Location: | Controller |
| Other Software: | None |
| Host | ssj_ops@100% |
|---|---|
| LENA1 | 1,698,355 |
| LENA2 | 1,687,030 |
| ssj_ops@100% | 3,385,385 |
| ssj_ops@100% per Host | 1,692,693 |
| ssj_ops@100% per JVM | 105,793 |

| Target Load | Actual Load | ssj_ops | |
|---|---|---|---|
| Target | Actual | ||
| Calibration 1 | 1,696,425 | ||
| Calibration 2 | 1,727,700 | ||
| Calibration 3 | 1,726,681 | ||
| ssj_ops@calibrated=1,727,190 | |||
| 100% | 98.3% | 1,727,190 | 1,698,355 |
| 90% | 90.1% | 1,554,471 | 1,556,641 |
| 80% | 79.9% | 1,381,752 | 1,380,637 |
| 70% | 70.1% | 1,209,033 | 1,210,079 |
| 60% | 60.0% | 1,036,314 | 1,036,069 |
| 50% | 50.0% | 863,595 | 863,055 |
| 40% | 40.0% | 690,876 | 690,270 |
| 30% | 30.1% | 518,157 | 519,753 |
| 20% | 20.1% | 345,438 | 347,279 |
| 10% | 10.1% | 172,719 | 174,368 |
| Active Idle | 0 | 0 | |

| Target Load | Actual Load | ssj_ops | |
|---|---|---|---|
| Target | Actual | ||
| Calibration 1 | 1,676,696 | ||
| Calibration 2 | 1,707,424 | ||
| Calibration 3 | 1,706,969 | ||
| ssj_ops@calibrated=1,707,196 | |||
| 100% | 98.8% | 1,707,196 | 1,687,030 |
| 90% | 90.0% | 1,536,477 | 1,536,513 |
| 80% | 80.2% | 1,365,757 | 1,368,513 |
| 70% | 70.3% | 1,195,037 | 1,200,468 |
| 60% | 59.8% | 1,024,318 | 1,020,969 |
| 50% | 50.0% | 853,598 | 853,063 |
| 40% | 40.0% | 682,879 | 683,320 |
| 30% | 30.0% | 512,159 | 512,808 |
| 20% | 20.0% | 341,439 | 342,258 |
| 10% | 10.0% | 170,720 | 170,370 |
| Active Idle | 0 | 0 | |
