SPECpower_ssj2008
Host 'node3' Performance Report
Copyright © 2007-2009 Standard Performance Evaluation Corporation
| Hewlett-Packard Company ProLiant SL2x170z G6 (2.4 GHz, Intel Xeon L5530) | ssj_ops@100% = 530,294 ssj_ops@100% per JVM = 132,573 |
||||
| Test Sponsor: | Hewlett-Packard Company | SPEC License #: | 3 | Test Method: | Multi Node |
| Tested By: | Hewlett-Packard Company | Test Location: | Houston, TX, USA | Test Date: | Sep 3, 2009 |
| Hardware Availability: | Oct-2009 | Software Availability: | Jul-2009 | Publication: | Nov 4, 2009 |
| System Source: | Single Supplier | System Designation: | Server | Power Provisioning: | Line-powered |
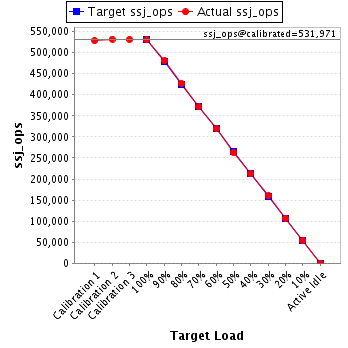
| Target Load | Actual Load | ssj_ops | |
|---|---|---|---|
| Target | Actual | ||
| Calibration 1 | 528,532 | ||
| Calibration 2 | 532,028 | ||
| Calibration 3 | 531,913 | ||
| ssj_ops@calibrated=531,971 | |||
| 100% | 99.7% | 531,971 | 530,294 |
| 90% | 90.3% | 478,773 | 480,285 |
| 80% | 80.2% | 425,576 | 426,484 |
| 70% | 69.8% | 372,379 | 371,379 |
| 60% | 60.1% | 319,182 | 319,961 |
| 50% | 49.5% | 265,985 | 263,330 |
| 40% | 39.9% | 212,788 | 212,020 |
| 30% | 30.0% | 159,591 | 159,690 |
| 20% | 20.0% | 106,394 | 106,568 |
| 10% | 10.3% | 53,197 | 54,714 |
| Active Idle | 0 | 0 | |
| Set Identifier: | sut |
| Set Description: | ProLiant SL2x170z G6 |
| # of Identical Nodes: | 4 |
| Comment: | None |
| Hardware | |
|---|---|
| Hardware Vendor: | Hewlett-Packard Company |
| Model: | ProLiant SL2x170z G6 (2.4 GHz, Intel Xeon L5530) |
| Form Factor: | 2U |
| CPU Name: | Intel Xeon L5530 |
| CPU Characteristics: | Quad-Core, 2.40 GHz, 8 MB L3 cache |
| CPU Frequency (MHz): | 2400 |
| CPU(s) Enabled: | 8 cores, 2 chips, 4 cores/chip |
| Hardware Threads: | 16 (2 / core) |
| CPU(s) Orderable: | 1,2 chips |
| Primary Cache: | 32 KB I + 32 KB D on chip per core |
| Secondary Cache: | 256 KB I+D on chip per core |
| Tertiary Cache: | 8 MB I+D on chip per chip |
| Other Cache: | None |
| Memory Amount (GB): | 8 |
| # and size of DIMM: | 4 x 2048 MB |
| Memory Details: | 2GB 2Rx8 PC3-10600E; slots 1 and 4 are populated on each processor |
| Power Supply Quantity and Rating (W): | None |
| Power Supply Details: | Shared |
| Disk Drive: | 1 x 60GB SSD 2.5" SATA, HP part #:586585-B21 |
| Disk Controller: | Integrated SATA |
| # and type of Network Interface Cards (NICs) Installed: | 2 x HP NC362i Dual Port Multifunction Gigabit Server Adapters |
| NICs Enabled in Firmware / OS / Connected: | 2/2/1 |
| Network Speed (Mbit): | 1000 |
| Keyboard: | None |
| Mouse: | None |
| Monitor: | None |
| Optical Drives: | No |
| Other Hardware: | None |
| Software | |
|---|---|
| Power Management: | Power saver plan in OS |
| Operating System (OS): | Windows Server 2008 x64, Enterprise Edition |
| OS Version: | SP2 |
| Filesystem: | NTFS |
| JVM Vendor: | IBM Corporation |
| JVM Version: | IBM J9 VM (build 2.4, J2RE 1.6.0 IBM J9 2.4 Windows Server 2008 amd64-64 jvmwa6460sr5-20090519_35743 (JIT enabled, AOT enabled) |
| JVM Command-line Options: | -Xaggressive -Xcompressedrefs -Xgcpolicy:gencon -Xmn1100m -Xms1600m -Xmx1600m -XlockReservation -Xnoloa -XtlhPrefetch -Xlp -Xgcthreads4 |
| JVM Affinity: | start /affinity [0xF, 0xF0, 0xF00, 0xF000] |
| JVM Instances: | 4 |
| JVM Initial Heap (MB): | 1600 |
| JVM Maximum Heap (MB): | 1600 |
| JVM Address Bits: | 64 |
| Boot Firmware Version: | O34 8/25/09 |
| Management Firmware Version: | 4.04 7/1/09 |
| Workload Version: | SSJ 1.2.6 |
| Director Location: | Controller |
| Other Software: | NIC driver, HP component cp010296.exe. Driver version: 10.3.49.400 |
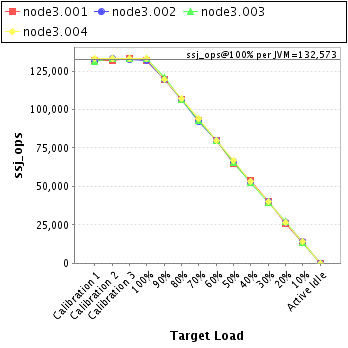
| JVM Instance | ssj_ops@100% |
|---|---|
| node3.001 | 132,088 |
| node3.002 | 131,940 |
| node3.003 | 132,927 |
| node3.004 | 133,339 |
| ssj_ops@100% | 530,294 |
| ssj_ops@100% per JVM | 132,573 |
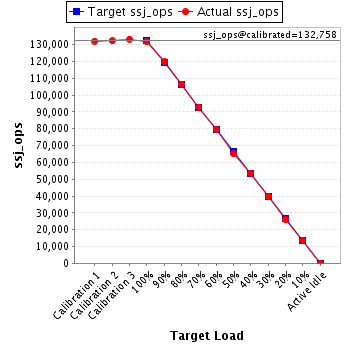
| Target Load | Actual Load | ssj_ops | |
|---|---|---|---|
| Target | Actual | ||
| Calibration 1 | 132,111 | ||
| Calibration 2 | 132,233 | ||
| Calibration 3 | 133,283 | ||
| ssj_ops@calibrated=132,758 | |||
| 100% | 99.5% | 132,758 | 132,088 |
| 90% | 90.2% | 119,482 | 119,788 |
| 80% | 80.3% | 106,206 | 106,571 |
| 70% | 70.0% | 92,931 | 92,921 |
| 60% | 60.1% | 79,655 | 79,750 |
| 50% | 49.0% | 66,379 | 65,033 |
| 40% | 40.3% | 53,103 | 53,562 |
| 30% | 30.0% | 39,827 | 39,886 |
| 20% | 19.5% | 26,552 | 25,937 |
| 10% | 10.3% | 13,276 | 13,708 |
| Active Idle | 0 | 0 | |
| Target Load | Actual Load | ssj_ops | |
|---|---|---|---|
| Target | Actual | ||
| Calibration 1 | 131,735 | ||
| Calibration 2 | 133,093 | ||
| Calibration 3 | 132,256 | ||
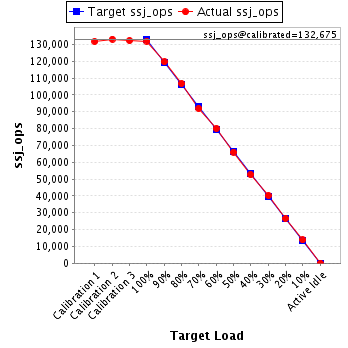
| ssj_ops@calibrated=132,675 | |||
| 100% | 99.4% | 132,675 | 131,940 |
| 90% | 90.1% | 119,407 | 119,581 |
| 80% | 80.5% | 106,140 | 106,777 |
| 70% | 69.3% | 92,872 | 91,916 |
| 60% | 60.3% | 79,605 | 80,032 |
| 50% | 49.8% | 66,337 | 66,061 |
| 40% | 39.6% | 53,070 | 52,592 |
| 30% | 30.3% | 39,802 | 40,236 |
| 20% | 20.1% | 26,535 | 26,634 |
| 10% | 10.4% | 13,267 | 13,841 |
| Active Idle | 0 | 0 | |
| Target Load | Actual Load | ssj_ops | |
|---|---|---|---|
| Target | Actual | ||
| Calibration 1 | 131,403 | ||
| Calibration 2 | 133,270 | ||
| Calibration 3 | 133,059 | ||
| ssj_ops@calibrated=133,165 | |||
| 100% | 99.8% | 133,165 | 132,927 |
| 90% | 90.9% | 119,848 | 121,073 |
| 80% | 79.8% | 106,532 | 106,226 |
| 70% | 69.6% | 93,215 | 92,651 |
| 60% | 60.1% | 79,899 | 80,067 |
| 50% | 49.2% | 66,582 | 65,523 |
| 40% | 39.4% | 53,266 | 52,523 |
| 30% | 29.7% | 39,949 | 39,562 |
| 20% | 20.5% | 26,633 | 27,314 |
| 10% | 10.0% | 13,316 | 13,283 |
| Active Idle | 0 | 0 | |

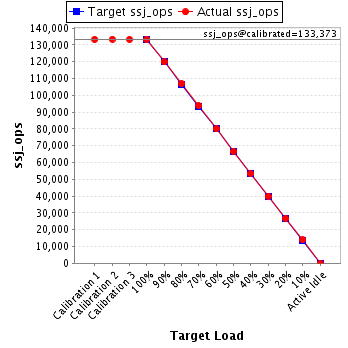
| Target Load | Actual Load | ssj_ops | |
|---|---|---|---|
| Target | Actual | ||
| Calibration 1 | 133,283 | ||
| Calibration 2 | 133,432 | ||
| Calibration 3 | 133,315 | ||
| ssj_ops@calibrated=133,373 | |||
| 100% | 100.0% | 133,373 | 133,339 |
| 90% | 89.9% | 120,036 | 119,843 |
| 80% | 80.2% | 106,699 | 106,910 |
| 70% | 70.4% | 93,361 | 93,890 |
| 60% | 60.1% | 80,024 | 80,111 |
| 50% | 50.0% | 66,687 | 66,713 |
| 40% | 40.0% | 53,349 | 53,344 |
| 30% | 30.0% | 40,012 | 40,006 |
| 20% | 20.0% | 26,675 | 26,683 |
| 10% | 10.4% | 13,337 | 13,882 |
| Active Idle | 0 | 0 | |