SPECpower_ssj2008
Host '0001' Performance Report
Copyright © 2007-2008 Standard Performance Evaluation Corporation
| SGI Altix XE250 (Intel Xeon processor E5472) | ssj_ops@100% = 341,642 ssj_ops@100% per JVM = 85,410 |
||||
| Test Sponsor: | SGI | SPEC License #: | 4 | Test Method: | Single Node |
| Tested By: | SGI | Test Location: | Mountain View,CA, USA | Test Date: | May 16, 2008 |
| Hardware Availability: | Feb-2008 | Software Availability: | Apr-2008 | Publication: | Jun 4, 2008 |
| System Source: | Single Supplier | System Designation: | Server | Power Provisioning: | Line-powered |
| Target Load | Actual Load | ssj_ops | |
|---|---|---|---|
| Target | Actual | ||
| Calibration 1 | 342,169 | ||
| Calibration 2 | 343,985 | ||
| Calibration 3 | 343,681 | ||
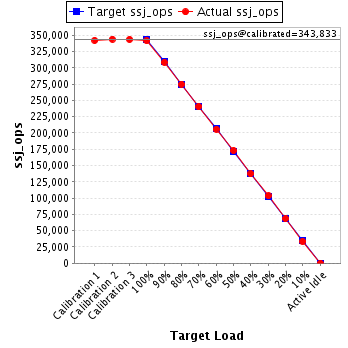
| ssj_ops@calibrated=343,833 | |||
| 100% | 99.4% | 343,833 | 341,642 |
| 90% | 89.8% | 309,450 | 308,608 |
| 80% | 79.9% | 275,067 | 274,889 |
| 70% | 70.0% | 240,683 | 240,514 |
| 60% | 59.9% | 206,300 | 205,952 |
| 50% | 50.3% | 171,917 | 173,061 |
| 40% | 39.9% | 137,533 | 137,159 |
| 30% | 30.1% | 103,150 | 103,391 |
| 20% | 19.9% | 68,767 | 68,466 |
| 10% | 9.8% | 34,383 | 33,544 |
| Active Idle | 0 | 0 | |
| Set Identifier: | sut |
| Set Description: | Altix XE250 (Intel Xeon processor E5472) |
| # of Identical Nodes: | 1 |
| Comment: | None |
| Hardware | |
|---|---|
| Hardware Vendor: | SGI |
| Model: | Altix XE250 (Intel Xeon processor E5472) |
| Form Factor: | -- |
| CPU Name: | Intel Xeon E5472 |
| CPU Characteristics: | 3.0 GHz, 12 MB L2 Cache, Quad-Core, 1600 MHz System Bus |
| CPU Frequency (MHz): | 3000 |
| CPU(s) Enabled: | 8 cores, 2 chips, 4 cores/chip |
| Hardware Threads: | 8 (1 / core) |
| CPU(s) Orderable: | 1,2 chips |
| Primary Cache: | 32 KB I + 32 KB D on chip per core |
| Secondary Cache: | 12 MB I+D on chip per chip, 6 MB shared / 2 cores |
| Tertiary Cache: | None |
| Other Cache: | None |
| Memory Amount (GB): | 16 |
| # and size of DIMM: | 4x4096 MB |
| Memory Details: | SGI part # 9010134, 4GB, DDR2, 800, CL5, ECC Slots: 1A, 2A, 3A, 4A |
| Power Supply Quantity and Rating (W): | 1 x 900 |
| Power Supply Details: | SGI part # 060-0276-001 |
| Disk Drive: | 1 x Seagate 300GB 15K RPM SAS |
| Disk Controller: | LSI Logic SAS1068E SAS |
| # and type of Network Interface Cards (NICs) Installed: | Integrated 2 x Intel Gigabit Ethernet 82575EB, igb driver |
| NICs Enabled in Firmware / OS / Connected: | 2/2/1 |
| Network Speed (Mbit): | 1000 |
| Keyboard: | None |
| Mouse: | None |
| Monitor: | None |
| Optical Drives: | None |
| Other Hardware: | None |
| Software | |
|---|---|
| Power Management: | Enabled(See SUT Notes) |
| Operating System (OS): | SUSE Linux Enterprise Server 10 (x86_64) |
| OS Version: | 10 SP1 |
| Filesystem: | xfs |
| JVM Vendor: | BEA Systems, Inc |
| JVM Version: | BEA JRockit(R) (build P27.5.0-5-97156-1.6.0_03-20080403-1523-linux-x86_64, compiled mode) |
| JVM Command-line Options: | -Xms3400m -Xns3200m -Xmx3400m -XXaggressive -XXlazyunlocking -XXthroughputcompaction -Xlargepages -Xgc:genpar -XXcallprofiling -XXtlasize:min=4k,preferred=1024k |
| JVM Affinity: | numactl --physcpubind[0,2][4,6][1,3][5,7] |
| JVM Instances: | 8 |
| JVM Initial Heap (MB): | 3400 |
| JVM Maximum Heap (MB): | 3400 |
| JVM Address Bits: | 64 |
| Boot Firmware Version: | -- |
| Management Firmware Version: | -- |
| Workload Version: | SSJ 1.1 |
| Director Location: | Controller |
| Other Software: | None |
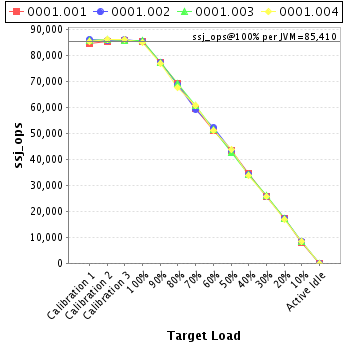
| JVM Instance | ssj_ops@100% |
|---|---|
| 0001.001 | 85,446 |
| 0001.002 | 85,393 |
| 0001.003 | 85,656 |
| 0001.004 | 85,147 |
| ssj_ops@100% | 341,642 |
| ssj_ops@100% per JVM | 85,410 |
| Target Load | Actual Load | ssj_ops | |
|---|---|---|---|
| Target | Actual | ||
| Calibration 1 | 84,783 | ||
| Calibration 2 | 85,539 | ||
| Calibration 3 | 85,677 | ||
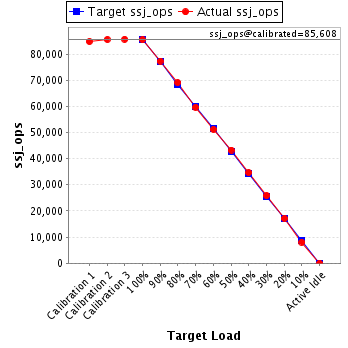
| ssj_ops@calibrated=85,608 | |||
| 100% | 99.8% | 85,608 | 85,446 |
| 90% | 90.3% | 77,047 | 77,327 |
| 80% | 80.7% | 68,486 | 69,071 |
| 70% | 69.7% | 59,926 | 59,681 |
| 60% | 59.8% | 51,365 | 51,209 |
| 50% | 50.6% | 42,804 | 43,299 |
| 40% | 40.5% | 34,243 | 34,662 |
| 30% | 30.2% | 25,682 | 25,871 |
| 20% | 20.1% | 17,122 | 17,171 |
| 10% | 9.4% | 8,561 | 8,071 |
| Active Idle | 0 | 0 | |
| Target Load | Actual Load | ssj_ops | |
|---|---|---|---|
| Target | Actual | ||
| Calibration 1 | 86,186 | ||
| Calibration 2 | 85,947 | ||
| Calibration 3 | 86,095 | ||
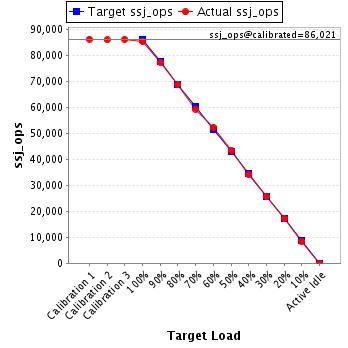
| ssj_ops@calibrated=86,021 | |||
| 100% | 99.3% | 86,021 | 85,393 |
| 90% | 89.8% | 77,419 | 77,239 |
| 80% | 80.0% | 68,817 | 68,819 |
| 70% | 69.0% | 60,215 | 59,316 |
| 60% | 60.7% | 51,613 | 52,194 |
| 50% | 50.3% | 43,010 | 43,247 |
| 40% | 39.9% | 34,408 | 34,280 |
| 30% | 29.9% | 25,806 | 25,744 |
| 20% | 19.9% | 17,204 | 17,129 |
| 10% | 9.9% | 8,602 | 8,517 |
| Active Idle | 0 | 0 | |
| Target Load | Actual Load | ssj_ops | |
|---|---|---|---|
| Target | Actual | ||
| Calibration 1 | 85,801 | ||
| Calibration 2 | 86,186 | ||
| Calibration 3 | 85,734 | ||
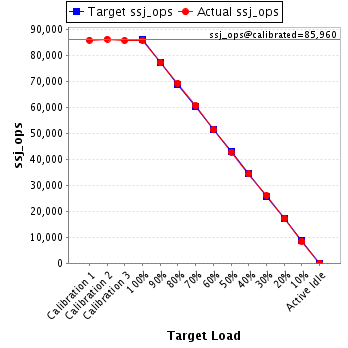
| ssj_ops@calibrated=85,960 | |||
| 100% | 99.6% | 85,960 | 85,656 |
| 90% | 89.8% | 77,364 | 77,154 |
| 80% | 80.6% | 68,768 | 69,301 |
| 70% | 70.5% | 60,172 | 60,609 |
| 60% | 59.7% | 51,576 | 51,340 |
| 50% | 49.8% | 42,980 | 42,774 |
| 40% | 39.9% | 34,384 | 34,330 |
| 30% | 30.2% | 25,788 | 26,001 |
| 20% | 19.9% | 17,192 | 17,125 |
| 10% | 9.8% | 8,596 | 8,458 |
| Active Idle | 0 | 0 | |
| Target Load | Actual Load | ssj_ops | |
|---|---|---|---|
| Target | Actual | ||
| Calibration 1 | 85,398 | ||
| Calibration 2 | 86,314 | ||
| Calibration 3 | 86,175 | ||
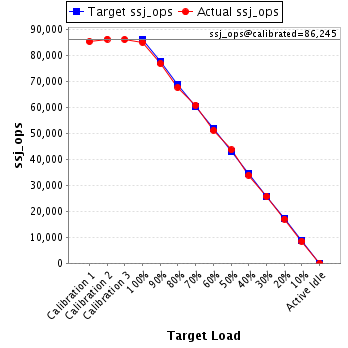
| ssj_ops@calibrated=86,245 | |||
| 100% | 98.7% | 86,245 | 85,147 |
| 90% | 89.2% | 77,620 | 76,888 |
| 80% | 78.5% | 68,996 | 67,698 |
| 70% | 70.6% | 60,371 | 60,908 |
| 60% | 59.4% | 51,747 | 51,209 |
| 50% | 50.7% | 43,122 | 43,740 |
| 40% | 39.3% | 34,498 | 33,886 |
| 30% | 29.9% | 25,873 | 25,774 |
| 20% | 19.8% | 17,249 | 17,041 |
| 10% | 9.9% | 8,624 | 8,499 |
| Active Idle | 0 | 0 | |