SPEC OSG SPECmail2008 Benchmark
Workload Characterization for SPECmail_MSEnt2008 Metric
Yun-seng Chao, Kanahl Kendrick, Stephen Pratt
3 June 2008
Summary
This document summarizes the studies on mail server workload collected from multiple university and corporate sources, using a variety of IMAP4 clients. The analyzed workloads consist of both SMTP and IMAP4 requests. Each request is described by parameters which fully characterize its behavior. The proposed models, which are obtained by analyzing these parameters, are able to reproduce the behavior of the mail server workloads.
The report is organized as follows. We start with a description of the
measurements and of the parameters considered in our studies. We then present
the models characterizing the mail server workloads and we briefly describe how
to use these models.
Measurements and Parameters
The measurements analyzed in our studies come from different sources. The measurements related to SMTP and IMAP4 have been provided by three (3) companies and by two universities. The collected sessions were divided into five IMAP4 and two SMTP groups. The sessions within each group form the basis for all of the parameters that define the Enterprise User Profile, emulated by the SPECmail2008 benchmark.
|
IMAP Information Sources – |
||||
|
Data Source |
Total Number of Users |
Number of IMAP Users |
Data Source Type |
Network Type |
|
Mirapoint |
223 |
223 |
Small company |
LAN |
|
Openwave |
2500 |
500 |
Medium company |
WAN |
|
Sun |
147 |
147 |
Medium workgroup |
LAN |
|
|
Unknown |
|
|
LAN |
|
|
Unknown |
|
|
LAN |
|
SPECmail2001 (ISP Model) |
10,000 |
10,000 |
Consumer |
Dialup |
Mailbox and Message Structures
The IMAP4 protocol allows email clients to create and maintain any number of folders and subfolders, in addition to the standard Inbox folder used in the SPECmail2001 POP3 user profile. The IMAP4 command set also allows email clients to ask the server to describe these structures. This information is independent of the delivery or retrieval protocols and so is treated outside of specific protocol and/or server context.
Multipurpose Internet Mail Extension (MIME) Profile
MIME is an internet attachment scheme, defined as a formal standard by RFCs 1521, 1522, and 1523. The Sun data set provided detained information about mailbox and message structure. Thus it is the basis for the following probability distribution tables used in the benchmark.
The initial processing of all message sizes distinguished between single part sizes and multipart sizes. The IMAP4 benchmark prioritizes individual MIME part size over the global message size distribution.
Single Part messages (76% of total)
- Use “Content-type: text/plain” in message headers
- Use subpart content size distribution
Multipart Message (24% of total)
- Use “Content Type: multipart/mixed; boundary=”xxxxxxxxx-counter” in message headers
- Use distributions for message part width and depth to help establish the set of multipart message bodies.
- Categorize MIME messages to fall into one of these pre-defined multipart buckets.
- Use subpart content size distribution to define the sub-part sizes in the fixed pool of pre-defined multipart messages.
Below are the distributions used in constructing messages in compliant with the MIME standard.
|
MIME Part size (bytes) vs. Probabilities (Sun) Distribution |
|||||
|
Part Size |
Probability |
Part Size |
Probability |
Part Size |
Probability |
|
2 |
0.6% |
256 |
10.5% |
32768 |
2.3% |
|
4 |
0.1% |
512 |
15.6% |
65536 |
1.2% |
|
8 |
0.4% |
1024 |
13.6% |
131072 |
0.7% |
|
16 |
0.8% |
2048 |
13.9% |
262144 |
0.4% |
|
32 |
1.8% |
4096 |
13.4% |
524288 |
0.3% |
|
64 |
4.1% |
8192 |
8.5% |
1048576 |
0.2% |
|
128 |
7.2% |
16384 |
4.3% |
2097152 |
0.1% |
The following table shows the distribution of the number of MIME parts at the top level (without regard to nesting). It reflects the count of multipart/mixed parts immediately “attached” to the main message. It does not reflect any counting of multipart/alternative parts (i.e. text/plane and text/html, alternative formats of the same text). Nor does it reflect the MIME attachment depths (“attachments” to “attachments” or forwarded messages).
|
MIME Top-Level Part Counts Distribution (Sun) |
|||||
|
Part Count |
Probability |
Part Count |
Probability |
Part Count |
Probability |
|
1 |
75.76% |
3 |
1.99% |
5 |
0.09% |
|
2 |
21.91% |
4 |
0.24% |
|
|
This next table shows the distribution of the nested MIME Part Levels that occur within a given message from the sample of MIME parts. It generally reflects messages or attachments which are forwarded multiple times, each time adding another depth level to the resulting message.
|
Distribution of MIME Part Depths (Sun) |
|||||
|
Part Depth |
Probability |
Part Depth |
Probability |
Part Depth |
Probability |
|
1 |
91.24% |
3 |
0.87% |
5 |
0.03% |
|
2 |
7.73% |
4 |
0.13% |
|
|
This third table shows the distribution of primary MIME Content Type (not including subtype) of all the parts in the entire sample.
|
MIME Content Type Distribution (Sun) |
|||
|
Content type |
Probability |
Content type |
Probability |
|
TEXT |
92.193% |
IMAGE |
0.888% |
|
APPLICATION |
4.265% |
AUDIO |
0.016% |
|
MESSAGE |
2.633% |
VIDEO |
0.004% |
After these values were reviewed, a former employee noted that the Unix company that provided MIME distributions tended to use more text messages. Other companies will have more and larger MIME parts that have richer, non-textual, content such as word processor documents, presentations, spreadsheets, web pages, calendar events, images, audio, and both rich and simple alternate MIME structures. The major effect of this shift is a tendency to increase the overall message sizes, and decreasing the Text content type in favor of the other categories.
However, increased Alternate structures does not eliminate the Text portion's counts. It just increases the other content types counters. Also, the IMAP server is not required to interpret the actual MIME parts content. It must extract the MIME part(s) and send the content, as is, to the IMAP4 client, which performs the interpretation. Therefore, the shift in Content Type distribution affects the benchmark's MIME structure of the message delivered to the SUT. The SUT still must deconstruct these MIME structures, but not the actual content.
Mailbox Distribution Profile
A mail server that supports IMAP is likely to support a hierarchy of several mailboxes (also known folders) in addition to the default INBOX mailbox for each user. Below are several distributions to construct the structure of mailboxes contained within a mailstore supported by IMAP. The data used is extracted from the three enterprise data samples (Mirapoint, Openwave, Sun).
The following table shows the probably of an individual user having a certain number of mailboxes (aka folders) at each level (depth). The data reflects the probability distributions for the first five (5) levels, even though the actual samples went many levels deeper than that. These lower levels were excluded from the benchmark because of the extremely small probability that such a level would exist.
|
Level by Level Subfolder Probability Distributions |
|||||||||||
|
Top to Level 1 |
Level 1 to 2 |
Level 2 to 3 |
Level 3 to 4 |
Level 4 to 5 |
Level 5 to 6 |
||||||
|
Width |
Probability |
Width |
Probability |
Width |
Probability |
Width |
Probability |
Width |
Probability |
Width |
Probability |
|
1 |
34.9% |
1 |
31.4% |
1 |
43.0% |
1 |
39.6% |
1 |
36.8% |
1 |
36.8% |
|
2 |
21.7% |
2 |
12.4% |
2 |
14.9% |
2 |
12.6% |
2 |
7.9% |
2 |
7.9% |
|
3 |
11.6% |
3 |
7.4% |
3 |
9.1% |
3 |
8.1% |
3 |
39.5% |
3 |
39.5% |
|
4 |
7.0% |
4 |
5.6% |
4 |
6.8% |
4 |
10.8% |
4 |
5.3% |
4 |
5.3% |
|
5 |
2.0% |
5 |
4.0% |
5 |
3.5% |
5 |
2.7% |
6 |
2.6% |
6 |
2.6% |
|
6 |
2.4% |
6 |
2.4% |
6 |
4.1% |
6 |
7.2% |
7 |
2.6% |
7 |
2.6% |
|
7 |
1.5% |
7 |
5.0% |
7 |
2.0% |
7 |
2.7% |
8 |
5.3% |
8 |
5.3% |
|
8 |
0.7% |
9 |
5.8% |
8 |
2.0% |
8 |
0.9% |
|
|
|
|
|
9 |
0.7% |
10 |
2.6% |
9 |
3.3% |
9 |
1.8% |
|
|
|
|
|
10 |
0.7% |
15 |
7.4% |
10 |
1.0% |
14 |
3.6% |
|
|
|
|
|
20 |
8.1% |
20 |
3.2% |
20 |
5.8% |
15 |
0.9% |
|
|
|
|
|
30 |
3.7% |
30 |
7.2% |
30 |
3.0% |
20 |
3.6% |
|
|
|
|
|
40 |
1.8% |
70 |
3.4% |
40 |
0.5% |
25 |
2.7% |
|
|
|
|
|
50 |
2.0% |
200 |
1.8% |
50 |
0.5% |
30 |
1.8% |
|
|
|
|
|
103 |
1.3% |
246 |
0.4% |
61 |
0.3% |
42 |
0.9% |
|
|
|
|
The following tables show the probability (Y) that a level has a percent (X) of mailboxes with another level of mailboxes (aka sub-folders).
|
Probability that Percent of Level 1 Mailboxes has Level 2 Mailboxes |
|||||||
|
Width X |
Probability Y |
Width X |
Probability Y |
Width X |
Probability Y |
Width X |
Probability Y |
|
0.0% |
58.4% |
25.0% |
2.2% |
50.0% |
0.2% |
75.0% |
1.1% |
|
5.0% |
2.4% |
30.0% |
1.3% |
55.0% |
9.3% |
80.0% |
0.2% |
|
10.0% |
1.7% |
35.0% |
5.4% |
60.0% |
0.4% |
85.0% |
0.0% |
|
15.0% |
3.5% |
40.0% |
0.7% |
65.0% |
0.0% |
90.0% |
0.0% |
|
20.0% |
3.0% |
45.0% |
1.5% |
70.0% |
2.4% |
95.0% |
0.0% |
|
|
|
|
|
|
|
100.0% |
6.3% |
|
Probability that Percent of Level 2 Mailboxes has Level 3 Mailboxes |
|||||||
|
Width X |
Probability Y |
Width X |
Probability Y |
Width X |
Probability Y |
Width X |
Probability Y |
|
0.0% |
46.0 % |
25.0% |
3.2% |
50.0% |
0.0% |
75.0% |
0.0% |
|
5.0% |
5.9% |
30.0% |
1.6% |
55.0% |
5.9% |
80.0% |
0.0% |
|
10.0% |
9.1% |
35.0% |
3.7% |
60.0% |
1.1% |
85.0% |
0.0% |
|
15.0% |
4.3% |
40.0% |
0.5% |
65.0% |
0.0% |
90.0% |
0.0% |
|
20.0% |
6.4% |
45.0% |
1.1% |
70.0% |
2.7% |
95.0% |
0.0% |
|
|
|
|
|
|
|
100.0% |
8.6% |
|
Probability that Percent of Level 3 Mailboxes has Level 4 Mailboxes |
|||||||
|
Width X |
Probability Y |
Width X |
Probability Y |
Width X |
Probability Y |
Width X |
Probability Y |
|
0.0% |
71.3% |
25.0% |
0.6% |
50.0% |
0.6% |
75.0% |
0.0% |
|
5.0% |
8.3% |
30.0% |
3.2% |
55.0% |
2.5% |
80.0% |
0.0% |
|
10.0% |
3.2% |
35.0% |
4.5% |
60.0% |
0.0% |
85.0% |
0.0% |
|
15.0% |
0.0% |
40.0% |
0.6% |
65.0% |
0.0% |
90.0% |
0.0% |
|
20.0% |
2.5% |
45.0% |
0.0% |
70.0% |
0.6% |
95.0% |
0.0% |
|
|
|
|
|
|
|
100.0% |
1.9% |
|
Probability that Percent of Level 4 Mailboxes has Level 5 Mailboxes |
|||||||
|
Width X |
Probability Y |
Width X |
Probability Y |
Width X |
Probability Y |
Width X |
Probability Y |
|
0.0% |
68.9% |
25.0% |
0.0% |
50.0% |
0.0% |
75.0% |
0.0% |
|
5.0% |
4.4% |
30.0% |
0.0% |
55.0% |
2.2% |
80.0% |
0.0% |
|
10.0% |
2.2% |
35.0% |
4.4% |
60.0% |
2.2% |
85.0% |
0.0% |
|
15.0% |
4.4% |
40.0% |
2.2% |
65.0% |
0.0% |
90.0% |
0.0% |
|
20.0% |
2.2% |
45.0% |
2.2% |
70.0% |
0.0% |
95.0% |
0.0% |
|
|
|
|
|
|
|
100.0% |
4.4% |
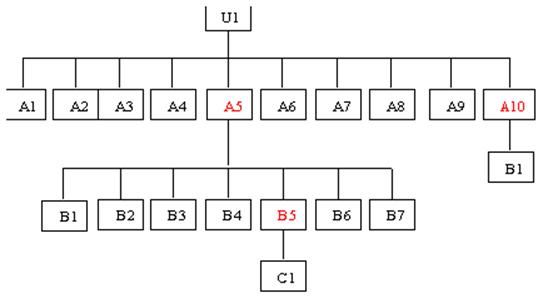
Mailbox Structure Example
Below is a walk through of the construction of a folder tree with a diagram to illustrate the use of the above distribution tables in creating a folder tree for user “U1”.
|
Folder Level Construction for User “U1” Example |
|||
|
Level |
Next Level |
Probability Computation |
Diagram Representation |
|
0 |
1 |
10.1% probability of 10
sub-folders |
Create folders A1 through
A10. |
|
|
|
7.2% of 20.0% of A1 through
A10 contain a level-2 sub-folder |
Mark folders A5 and A10 red
to indicate presence of Level 2 sub-folders |
|
1 |
2 |
6.3% probability of 7
sub-folders under A5 |
Create folders B1 through
B7 under A5 |
|
|
|
23.5% probability of (one) 1
sub-folder under A10 |
Folder B1 under A10 |
|
2 |
3 |
5.4% of 20.0% of the
level-2 folders under A5 contain a level-3 sub-folder |
Mark folder A5B5 red to
indicate presence of Level 3 sub-folders |
|
|
|
32.4% of 0.0% of A10B1 contain
a level-3 sub-folder |
No subfolders under A10B1 |
|
|
|
35.8% probability of one
(1) level-3 sub-folder under A5B5 |
Create folders C1 under
A5B5 |
|
3 |
4 |
56.8% of 0.0% of the
level-3 folder under A5B5 contain a level-4 sub-folder |
No subfolders under A5B5C1 |
The diagram below shows the mailbox structure for user U1.
Figure 1: Mailbox Structure Diagram
Peak Hour Determination
The overall peak traffic hour must be based on both SMTP and the corresponding IMAP activity over the same period of time. Therefore, only two data samples were used to determine the relative workloads – Mirapoint and Openwave. The other data samples did not provide corresponding SMTP logs for this purpose.
Peak Hour Traffic Volumes and Active Users
The following table shows the overall traffic volumes and users over the course of the peak day (determined by total number of message activity from the data samples).
|
Peak Mail Server
Traffic – |
||||||||
|
Data |
Mirapoint Samples |
Openwave Samples |
||||||
|
Sample Hour |
SMTP |
IMAP |
Combined |
Unique Sender/Rcpt |
SMTP |
IMAP |
Combined |
Unique Sender/Rcpt |
|
0 |
503 |
57 |
560 |
|
1169 |
5166 |
6335 |
|
|
1 |
571 |
60 |
631 |
|
1289 |
5435 |
6724 |
|
|
2 |
519 |
60 |
579 |
|
1033 |
4319 |
5352 |
|
|
3 |
456 |
60 |
516 |
|
1114 |
4210 |
5324 |
|
|
4 |
479 |
60 |
539 |
|
1158 |
4054 |
5212 |
|
|
5 |
503 |
63 |
566 |
|
1076 |
3777 |
4853 |
|
|
6 |
550 |
60 |
610 |
|
1108 |
3503 |
4611 |
|
|
7 |
869 |
103 |
972 |
|
1042 |
4566 |
5608 |
|
|
8 |
942 |
606 |
1548 |
|
1449 |
7383 |
8832 |
|
|
9 |
1198 |
1075 |
2273 |
|
2174 |
7315 |
9489 |
|
|
10 |
1029 |
2278 |
3307 |
90/160 |
2082 |
7247 |
9329 |
|
|
11 |
987 |
23015 |
24002 |
|
2217 |
6331 |
8548 |
|
|
12 |
874 |
2052 |
2926 |
|
2079 |
6186 |
8265 |
|
|
13 |
978 |
1507 |
2485 |
|
2120 |
7784 |
9904 |
|
|
14 |
1560 |
1235 |
2795 |
|
2818 |
8246 |
11064 |
|
|
15 |
1485 |
1119 |
2604 |
|
3809 |
10196 |
14005 |
|
|
16 |
841 |
783 |
1624 |
|
4846 |
10620 |
15466 |
1836/1836 |
|
17 |
803 |
541 |
1344 |
|
5665 |
9306 |
14971 |
|
|
18 |
502 |
466 |
968 |
|
5513 |
8504 |
14017 |
|
|
19 |
360 |
412 |
772 |
|
5125 |
6462 |
11587 |
|
|
20 |
316 |
249 |
565 |
|
4177 |
6260 |
10437 |
|
|
21 |
476 |
215 |
691 |
|
4440 |
6067 |
10507 |
|
|
22 |
377 |
218 |
595 |
|
4271 |
6133 |
10404 |
|
|
23 |
340 |
229 |
569 |
|
4004 |
6178 |
10182 |
|
|
Daily |
17,518 |
36,523 |
30,039 |
238/168 |
65,778 |
155,248 |
155,248 |
2,254/3,000 |
The Peak Hour Percent of Active Users is computed by first using the larger of the two unique Sending or Recipient users and dividing that value by the total number of provisioned users. The percentages are then pro-rated based on the relative number of actual users to compute the actual Percent of Active Users used in the benchmark.
|
Peak Hour Percent Provisioned Users |
|||
|
Company (Source) |
Data Type |
Number of Users |
Percent PH/Prov |
|
Mirapoint |
Peak Hour |
160 |
|
|
|
Provisioned |
269 |
59% |
|
Openwave |
Peak Hour |
1,836 |
|
|
|
Provisioned |
2,299 |
80% |
|
Normalized PH Percent Active Users |
78% |
||
PEAK_PCT_USERS =
"78"
The Peak Hour Activity Percentage can be derived by using the traffic volume from the peak hour and the daily total for each protocol. Again the benchmark value is computed by pro-rating each data sample within the overall user counts.
|
Peak Hour Percent Of Daily Traffic by Protocol |
|||
|
Company |
SMTP |
IMAP |
Combined |
|
Mirapoint |
6% |
6% |
11% |
|
Openwave |
7% |
7% |
10% |
|
Normalized PH Percent of Daily Traffic |
10% |
||
SMTP log files
SMTP Traffic Analysis
The SMTP log files reflect mail transfer agent workloads from the three enterprises, collected over the course of fourteen (14) to thirty (30) days of operation. The workload refers to all the requests processed by the mail server for delivering incoming and outgoing messages. These enterprises ranged from approximately 120 to 2100 users. The data logs cover the full 24-hour day, over the course of the data collection period.
The parameters used to describe the requests processed by the mail server are:
- time stamp of the request
- size [byte]
- number of recipients
The table below shows the statistics for SMTP traffic flows and message sizes for the three (3) enterprises. The ISP user profile statistics are included to illustrate the difference with the original user model.
|
SMTP In/Out-bound Traffic – |
||||
|
Data Source |
Percent Inbound Traffic |
Percent Outbound Traffic |
Average Message Size (KB) |
Data Source Type |
|
Mirapoint |
85% |
15% |
24 |
Small company |
|
Openwave |
92% |
8% |
44 |
Medium company |
|
Sun |
98% |
2% |
23 |
Medium workgroup |
|
All Sources ( |
93% |
7% |
38 |
Pro-rated medium company |
|
SPECmail2001 (ISP Model) |
53% |
47% |
25 |
Consumer Dialup |
The following two tables contain the profile of the number of recipients per
message, based on the Mirapoint and Openwave SMTP data from the busiest day of
the week. The recipient information
contains both data from recipients named in the RCPT TO lines, as well as,
recipient counts based on the mailing list expansions. The benchmark uses the
probably distributions in the second table to generate the actual SMTP traffic.
|
Peak Hour
SMTP Message Rate Comparison |
||||
|
Company (Source) |
Data Type |
Peak Hour Total Mesg/User |
Daily Total Mesg/User |
Peak Hour Mesg per Unique User |
|
Mirapoint |
Sender |
11.4 |
73.6 |
8.7 |
|
|
Recipient |
6.4 |
65.1 |
6.7 |
|
Openwave |
Sender |
2.6 |
29.2 |
0.5 |
|
|
Recipient |
2.6 |
21.9 |
4.9 |
|
Normalized PH Messages Per User |
5 |
|||
|
Peak Hour
From/To Analysis |
||||
|
Company (Source) |
Data Type |
From Local to Remote |
From Local to Local |
From Remote to Local |
|
Mirapoint |
Count |
84 |
431 |
262 |
|
|
% of Total |
11% |
55% |
34% |
|
Openwave |
Count |
195 |
789 |
429 |
|
|
% of Total |
14% |
56% |
30% |
|
Normalized PH SMTP Message Flow |
13% |
56% |
31% |
|
|
SMTP Recipients per Message – |
|||
|
Data Source |
Minimum |
Average |
Maximum |
|
Mirapoint |
1 |
2.0 |
133 |
|
Openwave |
1 |
3.3 |
74 |
|
Sun Microsystems |
n/a |
n/a |
n/a |
|
All |
1 |
3.1 |
133 |
|
SPECmail2001 (ISP) |
1 |
2 |
20 |
|
SMTP Recipients per Message Distribution |
|||
|
Recipients |
Probability |
Recipients |
Probability |
|
1 |
46.3875% |
11 |
1.00% |
|
2 |
11.00% |
12 |
0.30% |
|
3 |
9.00% |
13 |
0.10% |
|
4 |
8.00% |
14 |
0.05% |
|
5 |
7.00% |
15 |
0.05% |
|
6 |
6.00% |
16 |
0.05% |
|
7 |
5.00% |
30 |
0.05% |
|
8 |
4.00% |
50 |
0.01% |
|
10 |
2.00% |
100 |
0.0025% |
As stated above, the recipient distribution includes traffic routed through mailing lists. The data showed that 7% of overall SMTP traffic was sent to a mail distribution list. This data is included in the recipient distributions above, but described below. The benchmark does not require creation of any distribution lists.
|
Mailing
List Count Profile |
|||
|
Source |
Minimum |
Average |
Maximum |
|
Mirapoint |
n/a |
n/a |
n/a |
|
Openwave |
1 |
12 |
58 |
|
Sun |
n/a |
n/a |
n/a |
|
SPECmail2001 |
n/a |
n/a |
n/a |
|
Mailing
List Count Distribution (Openwave) |
|||||
|
Recipients |
Probability |
Recipients |
Probability |
Recipients |
Probability |
|
1 |
15.2% |
11 |
2.2% |
22 |
1.0% |
|
2 |
8.4% |
12 |
2.5% |
24 |
1.8% |
|
3 |
5.5% |
13 |
2.2% |
25 |
1.3% |
|
4 |
6.0% |
14 |
2.3% |
28 |
1.1% |
|
5 |
6.9% |
15 |
1.4% |
30 |
0.8% |
|
6 |
6.9% |
16 |
1.8% |
33 |
0.9% |
|
7 |
4.4% |
17 |
2.0% |
40 |
2.5% |
|
8 |
4.3% |
18 |
1.1% |
50 |
2.0% |
|
9 |
4.8% |
19 |
0.5% |
60 |
4.7% |
|
10 |
3.6% |
21 |
2.0% |
|
|
SMTP Message Analysis
The SPECmail2001 method created a single level message that met a fixed message size distribution. Originally, SPECmail2008 attempted to follow the same criteria: generate messages according to the MIME distributions and then map these messages to the final SMTP derived message size distribution. However, these MIME distribution compliant messages did not comply with the SMTP log derived message size distribution. Analysis of the cause found the main reason for this size discrepency. The IMAP message samples form only a subset of the messages flowing through the e-mail system. The POP3 users on these same e-mail servers delete a substantial proportion of their messages, which does not keep messages on the e-mail server. Therefore, these missing messages did not contribute to the MIME definitions of the whole mail store.
Subsequent benchmark design choices prioritized message MIME parts structure and enclosure sizes over the derived SMTP message sizes. The SMTP log derived findings are presented here, but not used by the benchmark.
The SMTP log derived message size data differs between Consumer and Enterprise users. As with the earlier SPECmail2001, the size of each message is counted message size buckets. Overall, the average message size processed through the MTA increased from 24.5 KB to 38.57 KB.
|
Message Size Statistics from SMTP Samples (KB) |
||||
|
SPEC OSG Benchmark |
Minimum (KB) |
Average (KB) |
Median (KB) |
Maximum (MB) |
|
SPECmail2001 |
1 |
24.5 |
2.5 |
2.7 |
|
SPECmail2008 MSEnt2008 |
0.05 |
38.57 |
3.56 |
21.0 |
The following tables describe the size distribution of all messages that flowed through the SMTP servers. This information is included here for completeness.
|
SMTP Message Size Probability Distribution |
|||
|
Message Size |
Probability |
Message Size |
Probability |
|
256 |
0.65% |
16384 |
4.03% |
|
512 |
6.46% |
65536 |
4.25% |
|
1024 |
17.50% |
262144 |
2.39% |
|
2048 |
31.90% |
1048576 |
0.87% |
|
4096 |
22.47% |
4194304 |
0.32% |
|
8192 |
9.12% |
10760758 |
0.04% |
The characteristic overall message size distribution for Enterprise messages remains very similar to the ISP Consumer, based on values reported in the available SMTP logs. A majority continues to be small messages less than 8 KB in size (78% versus 86%). However, more large messages exist, and these messages have a much larger size.
SMTP Message Rates
The corporate SMTP samples showed the following characteristics.
|
SMTP Message Inter-Arrival
Time |
|||
|
Mean (s) |
Standard Deviation |
Minimum |
Maximum |
|
2.80 |
2.37 |
0 |
15 |
SMTP Normalized Profile (Peak Hour)
|
Config Parameter |
Value |
Defnition |
|
PEAK_PCT_USERS |
78 |
Percent of provisioned users
receiving messages in the peak hour (also known as 'Active users'). |
|
MSG_RECEIVED_PER_PEAK_HOUR |
5 |
Number of messages received
by 'Active users' in the peak hour |
|
LOCAL_TO_LOCAL_PCT |
56 |
Percent of total messages
sent from Local users to Local users |
|
REMOTE_TO_LOCAL_PCT |
31 |
Percent of total messages
sent from Remote users to Local users |
|
LOCAL_TO_REMOTE_PCT |
13 |
Percent of total messages
sent from Local users to Remote users |
|
PEAK_LOAD_PERCENT |
32 |
Percent of the daily load occurring
during the peak hour |
Workload models
We have built a model for each of the parameters characterizing the SMTP requests.
Inter-arrival time distribution
The message inter-arrival time computation uses a simplified model because the total number of messages tends not to be enough to fulfill a complex distribution. Therefore, the time between message delivery is computed as the total number of messages to be delivered over the duration of the load test run time, divided by that run time.
Inter-arrival Time = (Number of Active Users) X
(Messages per User) X (Recipients per Message) / Load Test Time (s)
Message Construction
As described in the message size and MIME parts analysis, the benchmark chose to follow message structural and attachment size distributions rather than the total message size distribution used by the earlier SPECmail2001 benchmark. In that benchmark, the email server tends not to care about the actual message MIME structure and recognizes just headers versus body parts. IMAP4 email clients understand the concepts of attachments and expect the e-mail server to understand the various message parts. This meant that the e-mail server must evaluate the actual structure of each message. Therefore, message structure and individual attachment sizes affect the actual message size, since the MIME structural description is embedded in the message but not visible to most users.
The benchmark uses the above MIME Parts, MIME Part Sizes and MIME Depth distribution tables to construct each message stored in the mail store.
MIME_PART_SIZE =
"2,0.6%; 4,1.0%; 8,1.2%; 16,1.6%; 32,1.8%; 64,4.1%; 128,8.2%; 256,11.5%;
512,16.6%; 1024,14.6%; 2048,14.9%; 4096,14.4%; 8192,9.5%"
Number of recipients
Unlike the Consumer ISP user model, the
MSG_RECP_DISTRIBUTION
= "1,67.6%; 2,11.75%; 3,5.0%; 4,3.7%; 5,3.0%; 6,2.3%; 7,1.3%; 8,0.4%;
10,0.1%; 11,0.1%; 12,0.2%; 13,0.4%; 14,0.25%; 15,0.2%; 16,0.75%; 30,1.75%;
50,1.10%; 100,0.1%"
How to use the models
The models described in the previous sections can be used to reproduce the behavior of the real workload of a mail server. In particular, the use of these models is based on sampling the various distributions identified for each of the three characterizing parameters.
To sample the Weibull distribution obtained for the inter-arrival times, it is necessary to invert the function and to derive the inter-arrival time from the probability distribution. To make it short, let u denote a random number uniformly distributed between 0 and 1, the inter-arrival time t i between the i-th and (i-1)-th request is given by:
t i = a * (- log (u) ) 1/b (***)
where log denotes the natural logarithm, a and b are the parameters of the Weibull function. The procedure should then start by drawing a random number u and by computing the corresponding value of t using the previous formula. Note that u should be strictly greater than 0. For u=1, the value of the inter-arrival time is equal to zero.
In the case of message size and number of recipients, it is necessary to
sample the distribution obtained from the buckets. Again it is necessary
to draw a random number uniformly distributed between 0 and 1.
Scaling issues
Scaling issues arise when the workload model has to be used to represent the load of mail servers characterized by a smaller or larger number of users. This is particularly the case of the arrivals of the requests whose rate depends on the number of users of the mail server. The SPECMail2001 benchmark assumed a linear behavior of the arrival rates, that is, the arrival rate of the requests of a mail server with 100,000 users is 10 times the arrival rate of a mail server with 10,000 users. However, the SPECMail2008 benchmark will never approach the lower limits mandated in the previous model. There are just not that many enterprises with 10,000 employees, much less 100,000. A second consideration is that the number of new messages arriving during the peak hour is only a very small portion of the each user’s mail store.
Therefore, the number of messages arriving for each user is spread at regular intervals. The overall SMTP work load is determined by the message count multiplied by the number of users, and divided by sixty (60) seconds.
IMAP4 log files
The IMAP data have been collected from various mail servers at the
The parameters used to describe each IMAP session are:
- time stamp
- number of messages and mailbox size
- number and size of messages retrieved/deleted within a session
The table below shows the IMAP command percentages generated during each
data sample’s peak hour.
|
|
|||||
|
Mirapoint |
Openwave |
Purdue |
Sun |
Wollongang |
Average |
|
13.0% |
6.8% |
8.6% |
11.6% |
13.3% |
10.7% |
The statistics refer to one working day (24 hours); we have observed that the
behavior of the users is very different over week-end days.
IMAP Session Model
Analysis of the 10’s of thousands of individual IMAP sessions led to the conclusion that different IMAP e-mail clients use the different interaction models. Furthermore, these models were more complex than the POP3 sessions. Each IMAP e-mail client could initiate from one (1) to five (5) concurrent session(s), each with its own distinct session initiation patterns.
This leads to a complex IMAP Session model, defined by the combination of two categories: client-type and command sequences. A command-sequence is a series of IMAP commands performing one or more mail operations within a specific session. A client-type is a collection of one or more command-sequences.
The following table describe the criteria for each command-sequence.
|
Command Sequence |
Client Software |
General Characteristic |
Comments |
|
1 |
Netscape (Mozilla), Pine, Mulberry) |
·
Create
connection ·
Perform several
operations using a variety of commands (probe folder for new messages,
deleting, and moving messages, updating flags, list available folders,
appending messages, searching for messages, checkpointing,
etc.) ·
Occasionally
probe folders for new messages ·
Fetch headers
if any messages arrived ·
Occasionally
fetch body (whole or parts of body) · Focuses on a specific folder · Does not log out session |
This
is one of the “primary” sessions that tend to stay logged into
the IMAP server for many hours or days. Netscape
uses UID commands, Pine and Mulberry do not. Probing folders is accomplished by: 1. Netscape: NOOP; UID FETCH n:* (FLAGS) 2. Mulberry: SEARCH UNSEEN; SEARCH DELETED; FETCH 1:m
(FLAG ENVELOPE BODYSTRUCTURE, …) 3. Pine: NOOP |
|
2 |
Outlook, Outlook Express,
Mulberry |
·
Create
connection ·
Perform several
operations using a variety of commands (probe folder for new messages,
deleting, and moving messages, updating flags, list available folders,
appending messages, searching for messages, checkpointing,
etc.) ·
Occasionally
fetch headers ·
Occasionally
fetch header and whole body · Does not focus on a specific folder · Does not log out of session |
This
is one of the “primary” sessions that tend to stay logged into
the IMAP server for many hours or days. Probing
folders is accomplished by these IMAP
commands: ·
UID FETCH n:*
(UID, BODY.PEEK[HEADER], …) ·
UID FETCH 1:n-1
(UID FLAGS) |
|
3 |
Fetchmail, Outlook Express |
·
Create
connection ·
Fetch headers ·
Fetch whole
body ·
Logout |
These sessions are very
sporadic and show dependency on results returned from Command Sequence 4. |
|
4 |
Outlook,
Outlook Express, Netscape - periodic or triggered actions |
·
Create
connection ·
Occasionally
probe folders for new messages ·
Occasionally
issue other IMAP commands that does not alter the state of the mailstore
(such as UNSUBSCRIBE or LIST) ·
Sometimes logs
out, not always |
These sessions show very
automated behavior and are generated at fixed intervals for each user. Probing folders is accomplished by: ·
Outlook 2002
– Inbox: ·
Outlook 2002
– Others: ·
2. Outlook
Express: |
|
5 |
Mulberry, Netscape |
·
Create
connection ·
Occasionally
list or probe folders ·
Perform
specific tasks, such as deleting, messages, or appending messages, etc. ·
Alters the
state of the mail store ·
Logout |
These sessions tend to
focus on a specific set of tasks and then log out of the IMAP server. |
IMAP4 clients will use one or more of the five (5) command sequences. The IMAP4 benchmark emulates four (4) client types. During the benchmark run, each of these client type threads represents a single user. A client may connect one or more times to the IMAP servers.
|
Client Type |
Component Command Sequence |
Comments |
|
1 |
1 4 |
These two (2) command
sequences operate independently and concurrently. Some of these clients will use message
index number while others use the message UID. |
|
2 |
1 4 5 |
These three (3) command
sequences operate independently and concurrently. Some of these clients will use message
index number while others use the message UID. |
|
3 |
2 3 4 |
Command
sequence 3 IMAP commands and activities are based on the results from the
other command sequences. |
|
4 |
2 4 5 |
These three (3) command
sequences operator independently and concurrently. The message index number is used instead of
message UID. |
The compliant run uses the following combination to determine sequencing and dependencies.
CLIENT_TYPE_DISTRIBUTION = "1,31.373%; 3,32.353%; 4,3.922%; 5,2.941%; 13,3.922%; 14,10.784%; 15,1.961%; 24,0.980%; 34,2.941%; 45,2.941%; 134,0.980%; 145,3.922%; 1245,0.980%"
Each tuple defines the command sequence grouping (1 == CS1, 34 == CS3+CS4), and the percentage of overall load generator client threads that will implement each combination. The number of IMAP sessions varies as this matrix changes. Each load generator thread is assigned one specific combination.
IMAP Sample Selection
The extracted IMAP sessions were categorized according to command sequence types. However, some command sequences had an enormous number of sessions while others command sequence sample counts corresponded to the number of users. The fact that each client type uses more than one command sequence also forces the IMAP session selection criteria to gather all related sessions.
The final selection criteria used all IMAP sessions grouped by IMAP user name (found in each sessions’ login state). The resulting data set provides a more coherent model of not only individual primary command sequences (the premise of the SPECMail2001 benchmark) but also the number of related IMAP sessions and actions.
IMAP Command States
The IMAP command set allows many combinations of parameters and options. This means that a single IMAP command can perform more than one logical task, and on one or more messages at the same time. The best example is the FETCH command and its variant, UID FETCH. This single command has been used to retrieve not only the message body, but also message meta-data, headers and as a means to probe a folder for new messages. The latter (folder probe) is also complemented by the IMAP STATUS command, which provides a summary of old/new/deleted message.
The versatility of the IMAP command set leads to a need to expand the concept of a state from a simple command to the specific combination of a command and its parameters. Included in this combination is the understanding of the number of messages encompassed by that command state, as well as whether it is against an individual, contiguous series or a disjoint set of messages.
|
State Identfier |
State Name |
|
1.
|
APPEND |
|
2.
|
CHECK |
|
3.
|
CLOSE |
|
4.
|
COPY_NUM_FOLDER |
|
5.
|
COPY_RANGE_FOLDER |
|
6.
|
CREATE |
|
7.
|
DELETE |
|
8.
|
EXAMINE_FOLDER |
|
9.
|
EXAMINE_INBOX |
|
10.
|
EXAMINE_INBOXSENT |
|
11.
|
EXAMINE_SENT |
|
12.
|
EXAMINE_SENT_ITEMS |
|
13.
|
EXPUNGE |
|
14.
|
FETCH_NUM |
|
15.
|
FETCH_NUM_BODYALL |
|
16.
|
FETCH_NUM_BODYPARTS |
|
17.
|
FETCH_NUM_BODYPEEK |
|
18.
|
FETCH_NUM_BODYPEEK_HEADER |
|
19.
|
FETCH_NUM_BODYPEEK_HEADERFIELDS |
|
20.
|
FETCH_NUM_BODYSTRUCTURE_FLAGS |
|
21.
|
FETCH_NUM_BODY_BODYALL_HEADERFIELDS |
|
22.
|
FETCH_NUM_BODY_HEADER |
|
23.
|
FETCH_NUM_ENVELOPE_BODYPEEK_HEADERFIELDS_BODYSTRUCTURE_FLAGS_INTERNALDATE_RFC822SIZE |
|
24.
|
FETCH_NUM_ENVELOPE_BODYPEEK_HEADERFIELDS_FLAGS_INTERNALDATE_RFC822SIZE_UID |
|
25.
|
FETCH_NUM_FLAGS |
|
26.
|
FETCH_NUM_FLAGS_BODYPEEK_HEADERFIELDS_INTERNALDATE_RFC822SIZE |
|
27.
|
FETCH_NUM_FLAGS_BODYSTRUCTURE_ENVELOPE_INTERNALDATE_RFC822SIZE_UID |
|
28.
|
FETCH_NUM_RFC822HEADER |
|
29.
|
FETCH_NUM_RFC822TEXT |
|
30.
|
FETCH_NUM_UID |
|
31.
|
FETCH_NUM_UID_BODYPEEK_HEADERFIELDS_ENVELOPE_FLAGS_INTERNALDATE_RFC822SIZE |
|
32.
|
FETCH_RANGE_UID |
|
33.
|
FETCH_RANGE_BODYPEEK_HEADERFIELDS |
|
34.
|
FETCH_RANGE_ENVELOPE_BODYPEEK_HEADERFIELDS_FLAGS_INTERNALDATE_RFC822SIZE_UID |
|
35.
|
FETCH_RANGE_FLAGS_BODYPEEK_HEADERFIELDS_INTERNALDATE_RFC822SIZE |
|
36.
|
FETCH_RANGE_FLAGS_BODYSTRUCTURE_ENVELOPE_INTERNALDATE_RFC822SIZE_UID |
|
37.
|
FETCH_RANGE_UID_BODYPEEK_HEADERFIELDS_ENVELOPE_FLAGS_INTERNALDATE_RFC822SIZE |
|
38.
|
FETCH_SERIES_ENVELOPE_BODYPEEK_HEADERFIELDS_FLAGS_INTERNALDATE_RFC822SIZE_UID |
|
39.
|
FETCH_SERIES_ENVELOPE_BODYSTRUCTURE_INTERNALDATE_RFC822SIZE |
|
40.
|
FETCH_SERIES_FLAGS_BODYPEEK_HEADERFIELDS_INTERNALDATE_RFC822SIZE |
|
41.
|
FETCH_SERIES_UID |
|
42.
|
FETCH_UID |
|
43.
|
LIST |
|
44.
|
LOGIN |
|
45.
|
LOGOUT |
|
46.
|
LSUB_NULL_FOLDER |
|
47.
|
LSUB_NULL_PART |
|
48.
|
LSUB_NULL_SENT |
|
49.
|
LSUB_NULL_WILDCARD |
|
50.
|
LSUB_WILDCARD_WILDCARD |
|
51.
|
NOOP |
|
52.
|
RENAME_FOLDER_FOLDER |
|
53.
|
RENAME_INBOXINBOXSENT_INBOXTRASHINBOXSENT |
|
54.
|
SEARCH_ALL_DELETED |
|
55.
|
SEARCH_ALL_RANGE_CHARSET_RFCHEADER |
|
56.
|
SEARCH_ALL_RFCHEADER |
|
57.
|
SEARCH_ALL_UNDELETED_UNSEEN |
|
58.
|
SEARCH_DELETED |
|
59.
|
SEARCH_RFCHEADER |
|
60.
|
SEARCH_UNDELETED |
|
61.
|
SEARCH_UNSEEN |
|
62.
|
SELECT_ |
|
63.
|
SELECT_FOLDER |
|
64.
|
SELECT_FOLDER_ITEMS |
|
65.
|
SELECT_INBOX |
|
66.
|
SELECT_INBOXSENT |
|
67.
|
SELECT_INBOXSENT_ITEMS |
|
68.
|
SELECT_SENT |
|
69.
|
SELECT_SENT_ITEMS |
|
70.
|
STARTED |
|
71.
|
STATUS_FOLDER_ITEMS_MESSAGES_UNSEEN |
|
72.
|
STATUS_FOLDER_ITEMS_UNSEEN |
|
73.
|
STATUS_FOLDER_MESSAGES |
|
74.
|
STATUS_FOLDER_MESSAGES_RECENT_UNSEEN_UIDVALIDITY_UIDNEXT |
|
75.
|
STATUS_FOLDER_MESSAGES_UNSEEN |
|
76.
|
STATUS_FOLDER_UIDNEXT |
|
77.
|
STATUS_FOLDER_UIDNEXT_UIDVALIDITY_MESSAGES |
|
78.
|
STATUS_FOLDER_UNSEEN |
|
79.
|
STATUS_INBOXSENT_ITEMS_MESSAGES_UNSEEN |
|
80.
|
STATUS_INBOXSENT_ITEMS_UNSEEN |
|
81.
|
STATUS_INBOXSENT_UNSEEN |
|
82.
|
STATUS_INBOXSENT_MESSAGES_UNSEEN |
|
83.
|
STATUS_INBOX_MESSAGES_RECENT_UNSEEN_UIDVALIDITY_UIDNEXT |
|
84.
|
STATUS_INBOX_MESSAGES_UNSEEN |
|
85.
|
STATUS_INBOX_UIDNEXT |
|
86.
|
STATUS_INBOX_UIDNEXT_UIDVALIDITY_MESSAGES |
|
87.
|
STATUS_INBOX_UNSEEN |
|
88.
|
STATUS_SENT_ITEMS_MESSAGES_UNSEEN |
|
89.
|
STATUS_SENT_ITEMS_UNSEEN |
|
90.
|
STATUS_SENT_MESSAGES_UNSEEN |
|
91.
|
STATUS_SENT_UNSEEN |
|
92.
|
STORE_NUM_SET_FLAGS_ANSWERED |
|
93.
|
STORE_NUM_SET_FLAGS_DELETED |
|
94.
|
STORE_NUM_SET_FLAGS_SEEN |
|
95.
|
STORE_NUM_UNSET_FLAGS_DELETED |
|
96.
|
STORE_NUM_UNSET_FLAGS_SEEN |
|
97.
|
STORE_RANGE_SET_FLAGS_DELETED |
|
98.
|
STORE_RANGE_SET_FLAGS_SEEN |
|
99.
|
STORE_SERIES_SET_FLAGS_DELETED |
|
100.
|
STORE_UNTILEND_SET_FLAGS_DELETED |
|
101.
|
STORE_UNTILEND_SET_FLAGS_SEEN |
|
102.
|
SUBSCRIBE_FOLDER |
|
103.
|
SUBSCRIBE_INBOXSENT |
|
104.
|
UID_COPY_NUM_FOLDER |
|
105.
|
UID_COPY_NUM_INBOX |
|
106.
|
UID_COPY_NUM_INBOXSENT |
|
107.
|
UID_COPY_RANGE_FOLDER |
|
108.
|
UID_COPY_RANGE_INBOX |
|
109.
|
UID_COPY_RANGE_INBOXSENT |
|
110.
|
UID_COPY_SERIES_FOLDER |
|
111.
|
UID_FETCH_NUM_BODY |
|
112.
|
UID_FETCH_NUM_BODYALL |
|
113.
|
UID_FETCH_NUM_BODYPARTS |
|
114.
|
UID_FETCH_NUM_BODYPEEK |
|
115.
|
UID_FETCH_NUM_BODYPEEKALL |
|
116.
|
UID_FETCH_NUM_BODYPEEK_HEADER |
|
117.
|
UID_FETCH_NUM_BODYPEEK_UID |
|
118.
|
UID_FETCH_NUM_BODYSTRUCTURE |
|
119.
|
UID_FETCH_NUM_BODY_BODYMIMEALL_BODYMIMEPARTS_HEADER |
|
120.
|
UID_FETCH_NUM_BODY_BODYMIMEALL_HEADER |
|
121.
|
UID_FETCH_NUM_BODY_HEADER |
|
122.
|
UID_FETCH_NUM_ENVELOPE |
|
123.
|
UID_FETCH_NUM_FLAGS |
|
124.
|
UID_FETCH_NUM_RFC822SIZE |
|
125.
|
UID_FETCH_NUM_UID |
|
126.
|
UID_FETCH_NUM_UID_BODYPEEK_FLAGS_INTERNALDATE |
|
127.
|
UID_FETCH_NUM_UID_BODYPEEK_FLAGS_INTERNALDATE_RFC822SIZE |
|
128.
|
UID_FETCH_NUM_UID_BODYPEEK_HEADERFIELDS_FLAGS_RFC822SIZE |
|
129.
|
UID_FETCH_NUM_UID_BODYPEEK_HEADER_FLAGS_INTERNALDATE_RFC822SIZE |
|
130.
|
UID_FETCH_NUM_UID_BODYPEEK_RFC822SIZE |
|
131.
|
UID_FETCH_NUM_UID_BODY_RFC822SIZE |
|
132.
|
UID_FETCH_RANGE_UID_BODYPEEK_FLAGS_INTERNALDATE |
|
133.
|
UID_FETCH_RANGE_UID_BODYPEEK_HEADERFIELDS_FLAGS_RFC822SIZE |
|
134.
|
UID_FETCH_RANGE_UID_BODYPEEK_RFC822SIZE |
|
135.
|
UID_FETCH_RANGE_UID_ENVELOPE_FLAGS_INTERNALDATE_RFC822SIZE |
|
136.
|
UID_FETCH_RANGE_UID_FLAGS |
|
137.
|
UID_FETCH_RANGE_UID_RFC822SIZE_BODYPEEK_HEADERFIELDS |
|
138.
|
UID_FETCH_RANGE_UID_UID_BODYPEEK_HEADER_HEADERFIELDS_FLAGS_FLAGS_RFC822SIZE_RFC822SIZE_UID |
|
139.
|
UID_FETCH_SERIES_UID_BODYPEEK_FLAGS_INTERNALDATE |
|
140.
|
UID_FETCH_SERIES_UID_BODYPEEK_HEADERFIELDS_FLAGS_RFC822SIZE |
|
141.
|
UID_FETCH_SERIES_UID_BODYPEEK_RFC822SIZE |
|
142.
|
UID_FETCH_UID_BODYPEEK_HEADERFIELDS_FLAGS_RFC822SIZE |
|
143.
|
UID_FETCH_UID_BODYPEEK_HEADER_FLAGS_INTERNALDATE_RFC822SIZE |
|
144.
|
UID_FETCH_UNTILEND_BODYPEEK_HEADERFIELDS_ENVELOPE_FLAGS_INTERNALDATE_RFC822SIZE_UID |
|
145.
|
UID_FETCH_UNTILEND_ENVELOPE_FLAGS_INTERNALDATE_RFC822SIZE_UID |
|
146.
|
UID_FETCH_UNTILEND_FLAGS |
|
147.
|
UID_FETCH_UNTILEND_UID_BODYPEEK_HEADERFIELDS_FLAGS_RFC822SIZE |
|
148.
|
UID_FETCH_UNTILEND_UID_BODYPEEK_HEADER_FLAGS_INTERNALDATE_RFC822SIZE |
|
149.
|
UID_FETCH_UNTILEND_UID_FLAGS |
|
150.
|
UID_FETCH_UNTILEND_UID_FLAGS_INTERNALDATE_RFC822HEADER_RFC822SIZE |
|
151.
|
UID_SEARCH_ANSWERED |
|
152.
|
UID_SEARCH_DELETED |
|
153.
|
UID_SEARCH_FLAGGED |
|
154.
|
UID_SEARCH_HEADER_QUESTION_RFCHEADER_UNDELETED |
|
155.
|
UID_SEARCH_HEADER_RFCHEADER_UNDELETED |
|
156.
|
UID_SEARCH_HEADER_UNDELETED |
|
157.
|
UID_SEARCH_KEYWORD |
|
158.
|
UID_SEARCH_NOTDELETED_UID_UNTILEND |
|
159.
|
UID_SEARCH_RFCHEADER_UNDELETED |
|
160.
|
UID_SEARCH_SEEN |
|
161.
|
UID_SEARCH_SINCE |
|
162.
|
UID_SEARCH_UID_NUM |
|
163.
|
UID_SEARCH_UID_NUM_NOTDELETED |
|
164.
|
UID_SEARCH_UID_RANGE |
|
165.
|
UID_SEARCH_UID_RANGE_NOTDELETED |
|
166.
|
UID_SEARCH_UID_UNTILEND_UNDELETED_UNDRAFT_UNSEEN |
|
167.
|
UID_SEARCH_UID_UNTILEND_UNDELETED_UNSEEN |
|
168.
|
UID_SEARCH_UNDELETED |
|
169.
|
UID_SEARCH_UNDELETED_UNSEEN |
|
170.
|
UID_SEARCH_UNSEEN |
|
171.
|
UID_SEARCH_UNTILEND |
|
172.
|
UID_STORE_NUM_SET_FLAGS_ANSWERED |
|
173.
|
UID_STORE_NUM_SET_FLAGS_ANSWERED_DELETED_SEEN |
|
174.
|
UID_STORE_NUM_SET_FLAGS_ANSWERED_SEEN |
|
175.
|
UID_STORE_NUM_SET_FLAGS_DELETED |
|
176.
|
UID_STORE_NUM_SET_FLAGS_DELETED_SEEN |
|
177.
|
UID_STORE_NUM_SET_FLAGS_FLAGGED |
|
178.
|
UID_STORE_NUM_SET_FLAGS_SEEN |
|
179.
|
UID_STORE_NUM_SET_FLAGS_SEEN_ANSWERED |
|
180.
|
UID_STORE_NUM_SET_FLAGS_SEEN_DELETED |
|
181.
|
UID_STORE_NUM_UNSET_FLAGS |
|
182.
|
UID_STORE_NUM_UNSET_FLAGS_ANSWERED |
|
183.
|
UID_STORE_NUM_UNSET_FLAGS_DELETED |
|
184.
|
UID_STORE_NUM_UNSET_FLAGS_FLAGGED |
|
185.
|
UID_STORE_NUM_UNSET_FLAGS_FLAGGED_ANSWERED |
|
186.
|
UID_STORE_NUM_UNSET_FLAGS_FLAGGED_FORWARDED_MDNSENT_DELETED_DRAFT |
|
187.
|
UID_STORE_NUM_UNSET_FLAGS_SEEN |
|
188.
|
UID_STORE_NUM_UNSET_FLAGS_SEEN_ANSWERED |
|
189.
|
UID_STORE_NUM_UNSET_FLAGS_SEEN_ANSWERED_DELETED |
|
190.
|
UID_STORE_NUM_UNSET_FLAGS_SEEN_ANSWERED_DELETED_DRAFT_FLAGGED |
|
191.
|
UID_STORE_NUM_UNSET_FLAGS_SEEN_ANSWERED_DELETED_FLAGGED |
|
192.
|
UID_STORE_NUM_UNSET_FLAGS_SEEN_ANSWERED_FLAGGED |
|
193.
|
UID_STORE_NUM_UNSET_FLAGS_SEEN_DELETED |
|
194.
|
UID_STORE_NUM_UNSET_FLAGS_SEEN_FLAGGED |
|
195.
|
UID_STORE_NUM_UNSET_FLAGS_SEEN_FORWARDED_MDNSENT_ANSWERED_DELETED_DRAFT_FLAGGED |
|
196.
|
UID_STORE_NUM_UNSET_FLAGS_SEEN_FORWARDED_MDNSENT_DELETED_DRAFT_FLAGGED |
|
197.
|
UID_STORE_NUM_UNSET_FLAGS_SEEN_MDNSENT_ANSWERED_DELETED_DRAFT_FLAGGED |
|
198.
|
UID_STORE_RANGE_SET_FLAGS_ANSWERED |
|
199.
|
UID_STORE_RANGE_SET_FLAGS_DELETED |
|
200.
|
UID_STORE_RANGE_SET_FLAGS_DELETED_SEEN |
|
201.
|
UID_STORE_RANGE_SET_FLAGS_SEEN |
|
202.
|
UID_STORE_RANGE_SET_FLAGS_SEEN_DELETED |
|
203.
|
UID_STORE_RANGE_UNSET_FLAGS |
|
204.
|
UID_STORE_RANGE_UNSET_FLAGS_ANSWERED_FORWARDED_MDNSENT_DELETED_DRAFT_FLAGGED |
|
205.
|
UID_STORE_RANGE_UNSET_FLAGS_DELETED |
|
206.
|
UID_STORE_RANGE_UNSET_FLAGS_SEEN |
|
207.
|
UID_STORE_RANGE_UNSET_FLAGS_SEEN_FORWARDED_MDNSENT_ANSWERED_DELETED_DRAFT_FLAGGED |
|
208.
|
UID_STORE_SERIES_SET_FLAGS_DELETED |
|
209.
|
UID_STORE_SERIES_SET_FLAGS_DELETED_SEEN |
|
210.
|
UID_STORE_SERIES_SET_FLAGS_SEEN |
|
211.
|
UID_STORE_SERIES_UNSET_FLAGS_SEEN_FORWARDED_MDNSENT_ANSWERED_DELETED_DRAFT_FLAGGED |
|
212.
|
UID_STORE_UNSET_FLAGS_SEEN |
|
213.
|
UNSUBSCRIBE_FOLDER |
|
214.
|
SEARCH_ALL_CALL_INFORMATION |
|
215.
|
UID_COPY_NUM_ |
|
216.
|
UID_COPY_NUM_TRASH |
|
217.
|
UID_COPY_RANGE_TRASH |
|
218.
|
UID_COPY_SERIES_TRASH |
|
219.
|
UID_FETCH_NUM_BODYPEEK_RFC822SIZE_UID |
|
220.
|
UID_FETCH_NUM_BODY_RFC822SIZE_UID |
|
221.
|
UID_FETCH_NUM_UID_BODYPEEK_HEADER_FLAGS_RFC822SIZE |
|
222.
|
UID_FETCH_RANGE_UID_BODYPEEK_HEADER_FLAGS_RFC822SIZE |
|
223.
|
LSUB |
|
224.
|
SUBSCRIBE_TRASH |
|
225.
|
UID_COPY_NUM |
|
226.
|
UID_COPY_RANGE |
|
227.
|
UID_COPY_SERIES |
|
228.
|
UID_FETCH_NUM_BODYMIMEALL |
|
229.
|
UID_FETCH_NUM_UID_BODYSTRUCTURE |
|
230.
|
UID_FETCH_RANGE_BODYPEEK_HEADERFIELDS |
|
231.
|
UID_FETCH_UNTILEND_FLAGS_RFC822SIZE |
|
232.
|
SESSION_START |
Functionally, there are many redundant states. However, it was felt that the effort to use message unique identifier (UID) versus the variable message index number is significant. The UID remains fixed for the life of the mailstore. The message index number changes as the number of messages change. This means a message has many relative index numbers across multiple IMAP sessions. For similar reasons, it was felt that operating on a contiguous range of messages generates a different workload than a random set of message numbers.
The various FETCH commands against headers and body sections make more sense when divided according to command sequences and client types. Many of these are the other half of a folder probe, depending on the client type. The present or absence of MIME parts also factor into the construction of the final command, as these lead to further probes of individual MIME parts.
The actual state transition charts used by the benchmark is too complex for this document. The Architecture White Paper provides the named objects used in the SPECmail2008 source code.
Inter-arrival Time Distributions
The uncertainty or randomness associated with the arrival of IMAP commands to the server is modeled using a Markov model to specify the statistical relationships between commands as transition-probability matrices. Each command sequence has its own probabilities and probability distributions of specific states. All entries in these transition-probability matrices were derived from a subset of the data samples. The base inter-arrival transition matrix uses a lognormal formula similar to the one used for SPECMail2001. Please consult the source code for the actual values.
IMAP Scaling Considerations
Since each IMAP user represents a variable number of IMAP sessions and incurs a considerable amount of storage space, scaling has problems at both ends of the mandated range. A further complication is the actual distribution of command sequences, since some occur much more frequently than others.
A benchmark run with too few users runs into the problem of missing command sequences as well as compliance with the mail store folder structures, message size and count distributions. Experiments have shown that a minimum of 200 users must be used for a compliant run that meets folder and message structure distributions.
The other end of the scaling problem lies in the number of IMAP users and the fact that each user represents one or more concurrent IMAP session. The IMAP benchmark apparently supports fewer users per load generator, compared to SPECmail2001. But this is very misleading since the correct consideration should be the concurrent number of client sessions and their activity levels in these sessions.
The POP3 benchmark defines very short session times - on the order of a few seconds for at least 75% of all POP3 sessions that find no messages to retrieve. So dispite the large number of defined POP3 users, the 25% active users only log into the system four times during the peak hour. Furthermore, the typical POP3 session lasts only 2-5 seconds, executing at most 10 commands (25%), but usually three commands (75%) within each session. This means that only a small subset of users is actively connected at any one time.
In constrast, IMAP users are always connected and active. The number of IMAP users determines the minimum concurrent IMAP sessions that stay logged into the IMAP server for the entire peak hour simulation. The client type distribution values then determines the number of ancillary IMAP sessions that will be generated. This means the IMAP server should allow at least
4.5 X UserCount