Copyright © 2015-2022 Standard Performance Evaluation Corporation
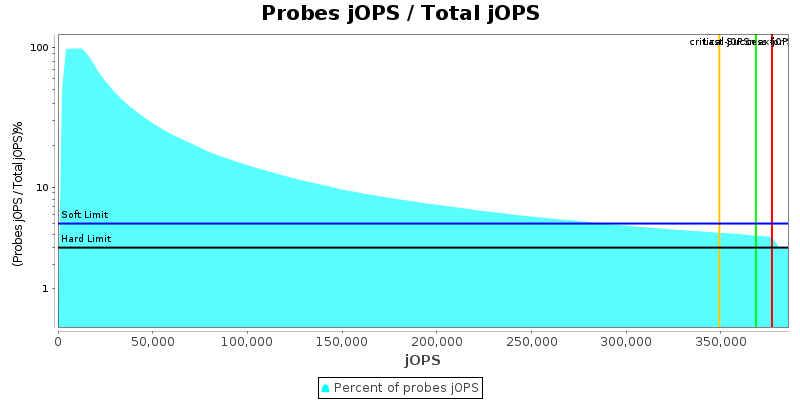
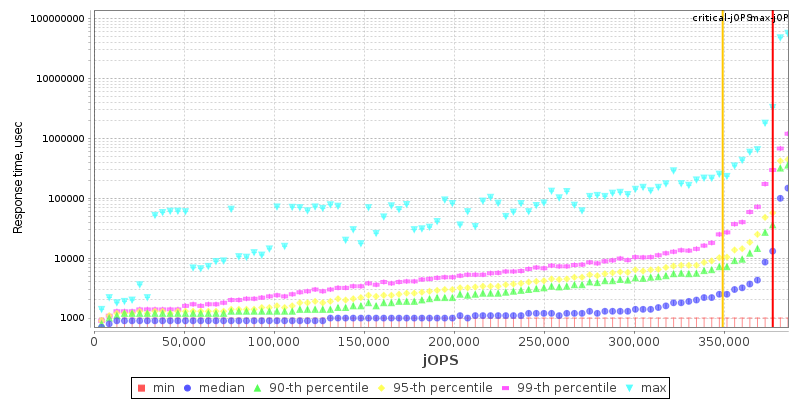
| Dell Inc. PowerEdge R7625 | 376911 SPECjbb2015-Composite max-jOPS 349118 SPECjbb2015-Composite critical-jOPS |
||
| Tested by: Dell Inc. | Test Sponsor: Dell Inc. | Test location: Round Rock, TX | Test date: Oct 19, 2022 |
| SPEC license #: 55 | Hardware Availability: Nov-2022 | Software Availability: Aug-2022 | Publication: Thu Nov 10 10:32:32 EST 2022 |
|
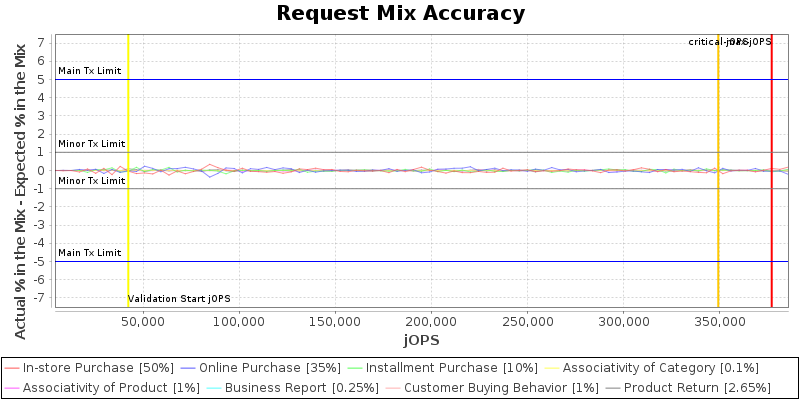
SPECjbb2015-Composite: Single JVM/Single Host
(# of groups: 2) |
 |
|
|
|
||||||||||||||||||||||||||||||||||||||||||||||||||||||||||||||||||||||||||||||||||||||||||||||||||||||||||||||||||||||||||||||||||||
|
|
||||||||||||||||||||||||||||||||||||
|
|
|||||||||||||||||||||||||||||||||||||||||||||||||||||||||||||||||||||||||||||||||||||||||||||||||||||||||||||||||||||||||||||||||||||||||
 |
|
| This section lists properties only set by user | ||||||||||||||||||||||||||||||
| ||||||||||||||||||||||||||||||
| View table in csv format |
| Level: COMPLIANCE | ||
| Check | Agent | Result |
| Check properties on compliance | All | PASSED |
| Level: CORRECTNESS | ||
| Check | Agent | Result |
| Compare SM and HQ Inventory | All | PASSED |