SPECpower_ssj2008
Aggregate Performance Report
Copyright © 2007-2025 Standard Performance Evaluation Corporation
| Lenovo Global Technology ThinkEdge SE100 | ssj_ops@100% = 1,964,578 ssj_ops@100% per Host = 982,289 ssj_ops@100% per JVM = 61,393 |
||||
| Test Sponsor: | Lenovo Global Technology | SPEC License #: | 9017 | Test Method: | Multi Node |
| Tested By: | Lenovo Global Technology | Test Location: | Beijing, China | Test Date: | Jun 27, 2025 |
| Hardware Availability: | May-2025 | Software Availability: | Sep-2024 | Publication: | Jul 16, 2025 |
| System Source: | Single Supplier | System Designation: | Server | Power Provisioning: | Line-powered |
| Target Load | Actual Load | ssj_ops | |
|---|---|---|---|
| Target | Actual | ||
| Calibration 1 | 1,643,093 | ||
| Calibration 2 | 1,938,640 | ||
| Calibration 3 | 1,998,833 | ||
| ssj_ops@calibrated=1,968,737 | |||
| 100% | 99.8% | 1,968,737 | 1,964,578 |
| 90% | 89.9% | 1,771,863 | 1,769,403 |
| 80% | 79.9% | 1,574,989 | 1,572,285 |
| 70% | 69.9% | 1,378,116 | 1,377,112 |
| 60% | 60.0% | 1,181,242 | 1,182,081 |
| 50% | 50.1% | 984,368 | 985,600 |
| 40% | 40.0% | 787,495 | 787,109 |
| 30% | 30.0% | 590,621 | 590,568 |
| 20% | 20.0% | 393,747 | 393,905 |
| 10% | 10.0% | 196,874 | 196,728 |
| Active Idle | 0 | 0 | |

| # of Nodes | # of Chips | # of Cores | # of Threads | Total RAM (GB) | # of OS Images | # of JVM Instances |
|---|---|---|---|---|---|---|
| 2 | 2 | 32 | 32 | 32.0 | 2 | 32 |
| Set Identifier: | sut |
| Set Description: | System Under Test |
| # of Identical Nodes: | 2 |
| Comment: | 'SUT' |
| Hardware per Node | |
|---|---|
| Hardware Vendor: | Lenovo Global Technology |
| Model: | ThinkEdge SE100 |
| Form Factor: | 1U |
| CPU Name: | Intel Core Ultra 7 255H |
| CPU Characteristics: | 16 Core, 2.0GHz, 24MB L3 Cache |
| CPU Frequency (MHz): | 2000 |
| CPU(s) Enabled: | 16 cores, 1 chip, 16 cores/chip |
| Hardware Threads: | 16 (1 / core) |
| CPU(s) Orderable: | 1 chip |
| Primary Cache: | 64 KB I + 48 KB D on chip per core |
| Secondary Cache: | 3 MB I+D on chip per core |
| Tertiary Cache: | 24 MB I+D on chip per chip |
| Other Cache: | None |
| Memory Amount (GB): | 16 |
| # and size of DIMM: | 2 x 8192 MB |
| Memory Details: | 8GB 1Rx16 PC5-6400B; slots 1 and 2 populated |
| Power Supply Quantity and Rating (W): | None |
| Power Supply Details: | Shared |
| Disk Drive: | 1 x 240GB M.2 SSD P/N:4XB7A89422 |
| Disk Controller: | Integrated SATA controller |
| # and type of Network Interface Cards (NICs) Installed: | 1 x 1GbE RJ45 |
| NICs Enabled in Firmware / OS / Connected: | 4/4/1 |
| Network Speed (Mbit): | 1000 |
| Keyboard: | None |
| Mouse: | None |
| Monitor: | None |
| Optical Drives: | No |
| Other Hardware: | None |
| Software per Node | |
|---|---|
| Power Management: | Enabled (see SUT Notes) |
| Operating System (OS): | Microsoft Windows 11 Enterprise |
| OS Version: | Version 24H2(OS Build 26100.1742) |
| Filesystem: | NTFS |
| JVM Vendor: | Oracle Corporation |
| JVM Version: | Java HotSpot(TM) 64-Bit Server VM (build 17.0.10+11-LTS-240, mixed mode, sharing), version 17.0.10 |
| JVM Command-line Options: | -server -Xmn450m -Xms512m -Xmx512m -XX:ParallelGCThreads=2 -XX:+UseLargePages -XX:InlineSmallCode=1500 -XX:AutoBoxCacheMax=20000 -XX:+UseParallelGC -XX:FreqInlineSize=2500 -XX:CompileThresholdScaling=210 |
| JVM Affinity: | start /NODE [0] /AFFINITY [0x1,0x2,0x4,0x8,0x10,0x20,0x40,0x80,0x100,0x200,0x400,0x800,0x1000,0x2000,0x4000,0x8000] |
| JVM Instances: | 16 |
| JVM Initial Heap (MB): | 512 |
| JVM Maximum Heap (MB): | 512 |
| JVM Address Bits: | 64 |
| Boot Firmware Version: | DZE104U |
| Management Firmware Version: | DZX310C |
| Workload Version: | SSJ 1.2.10 |
| Director Location: | Controller |
| Other Software: | KB5043080 |
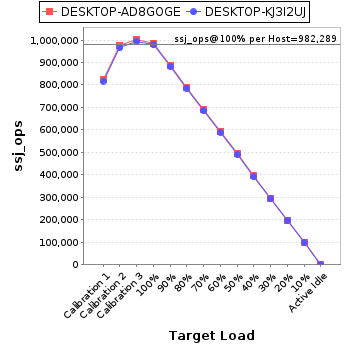
| Host | ssj_ops@100% |
|---|---|
| DESKTOP-AD8GOGE | 986,497 |
| DESKTOP-KJ3I2UJ | 978,080 |
| ssj_ops@100% | 1,964,578 |
| ssj_ops@100% per Host | 982,289 |
| ssj_ops@100% per JVM | 61,393 |
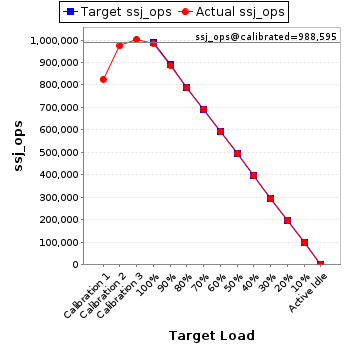
| Target Load | Actual Load | ssj_ops | |
|---|---|---|---|
| Target | Actual | ||
| Calibration 1 | 825,591 | ||
| Calibration 2 | 973,619 | ||
| Calibration 3 | 1,003,571 | ||
| ssj_ops@calibrated=988,595 | |||
| 100% | 99.8% | 988,595 | 986,497 |
| 90% | 89.7% | 889,736 | 886,791 |
| 80% | 79.6% | 790,876 | 787,212 |
| 70% | 70.0% | 692,017 | 692,248 |
| 60% | 60.0% | 593,157 | 592,778 |
| 50% | 50.1% | 494,298 | 495,677 |
| 40% | 40.1% | 395,438 | 396,189 |
| 30% | 30.0% | 296,579 | 296,269 |
| 20% | 20.0% | 197,719 | 197,641 |
| 10% | 10.0% | 98,860 | 98,777 |
| Active Idle | 0 | 0 | |
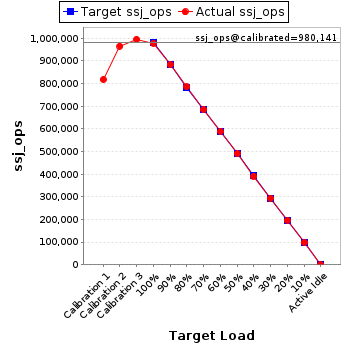
| Target Load | Actual Load | ssj_ops | |
|---|---|---|---|
| Target | Actual | ||
| Calibration 1 | 817,502 | ||
| Calibration 2 | 965,021 | ||
| Calibration 3 | 995,262 | ||
| ssj_ops@calibrated=980,141 | |||
| 100% | 99.8% | 980,141 | 978,080 |
| 90% | 90.0% | 882,127 | 882,613 |
| 80% | 80.1% | 784,113 | 785,073 |
| 70% | 69.9% | 686,099 | 684,863 |
| 60% | 60.1% | 588,085 | 589,303 |
| 50% | 50.0% | 490,071 | 489,923 |
| 40% | 39.9% | 392,057 | 390,920 |
| 30% | 30.0% | 294,042 | 294,299 |
| 20% | 20.0% | 196,028 | 196,264 |
| 10% | 10.0% | 98,014 | 97,951 |
| Active Idle | 0 | 0 | |