SPECpower_ssj2008
Aggregate Performance Report
Copyright © 2007-2025 Standard Performance Evaluation Corporation
| Lenovo Global Technology ThinkEdge SE100 | ssj_ops@100% = 2,054,417 ssj_ops@100% per Host = 1,027,209 ssj_ops@100% per JVM = 64,201 |
||||
| Test Sponsor: | Lenovo Global Technology | SPEC License #: | 9017 | Test Method: | Multi Node |
| Tested By: | Lenovo Global Technology | Test Location: | Beijing, China | Test Date: | Jun 12, 2025 |
| Hardware Availability: | May-2025 | Software Availability: | Feb-2025 | Publication: | Jul 1, 2025 |
| System Source: | Single Supplier | System Designation: | Server | Power Provisioning: | Line-powered |
| Target Load | Actual Load | ssj_ops | |
|---|---|---|---|
| Target | Actual | ||
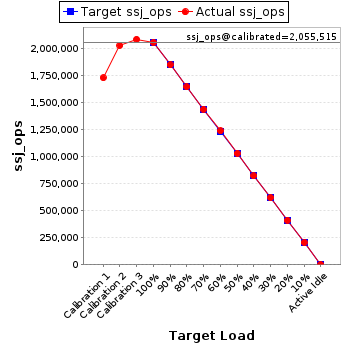
| Calibration 1 | 1,726,324 | ||
| Calibration 2 | 2,026,864 | ||
| Calibration 3 | 2,084,167 | ||
| ssj_ops@calibrated=2,055,515 | |||
| 100% | 99.9% | 2,055,515 | 2,054,417 |
| 90% | 89.8% | 1,849,964 | 1,846,536 |
| 80% | 80.0% | 1,644,412 | 1,643,738 |
| 70% | 69.9% | 1,438,861 | 1,437,447 |
| 60% | 60.1% | 1,233,309 | 1,236,206 |
| 50% | 50.0% | 1,027,758 | 1,027,731 |
| 40% | 39.9% | 822,206 | 820,400 |
| 30% | 30.1% | 616,655 | 618,508 |
| 20% | 20.0% | 411,103 | 410,907 |
| 10% | 10.0% | 205,552 | 205,079 |
| Active Idle | 0 | 0 | |
| # of Nodes | # of Chips | # of Cores | # of Threads | Total RAM (GB) | # of OS Images | # of JVM Instances |
|---|---|---|---|---|---|---|
| 2 | 2 | 32 | 32 | 32.0 | 2 | 32 |
| Set Identifier: | sut |
| Set Description: | System Under Test |
| # of Identical Nodes: | 2 |
| Comment: | 'SUT' |
| Hardware per Node | |
|---|---|
| Hardware Vendor: | Lenovo Global Technology |
| Model: | ThinkEdge SE100 |
| Form Factor: | 1U |
| CPU Name: | Intel Core Ultra 7 255H |
| CPU Characteristics: | 16 Core, 2.0GHz, 24MB L3 Cache |
| CPU Frequency (MHz): | 2000 |
| CPU(s) Enabled: | 16 cores, 1 chip, 16 cores/chip |
| Hardware Threads: | 16 (1 / core) |
| CPU(s) Orderable: | 1 chip |
| Primary Cache: | 64 KB I + 48 KB D on chip per core |
| Secondary Cache: | 3 MB I+D on chip per core |
| Tertiary Cache: | 24 MB I+D on chip per chip |
| Other Cache: | None |
| Memory Amount (GB): | 16 |
| # and size of DIMM: | 2 x 8192 MB |
| Memory Details: | 8GB 1Rx16 PC5-6400B; slots 1 and 2 populated |
| Power Supply Quantity and Rating (W): | None |
| Power Supply Details: | Shared |
| Disk Drive: | 1 x 240GB M.2 SSD P/N:4XB7A89422 |
| Disk Controller: | Integrated SATA controller |
| # and type of Network Interface Cards (NICs) Installed: | 1 x 1GbE RJ45 |
| NICs Enabled in Firmware / OS / Connected: | 4/4/1 |
| Network Speed (Mbit): | 1000 |
| Keyboard: | None |
| Mouse: | None |
| Monitor: | None |
| Optical Drives: | No |
| Other Hardware: | None |
| Software per Node | |
|---|---|
| Power Management: | Enabled (see SUT Notes) |
| Operating System (OS): | Ubuntu 24.04.2 LTS 64-bit |
| OS Version: | Linux 6.8.0-60-generic |
| Filesystem: | ext4 |
| JVM Vendor: | Oracle Corporation |
| JVM Version: | Java HotSpot(TM) 64-Bit Server VM (build 17.0.10+11-LTS-240, mixed mode, sharing), version 17.0.10 |
| JVM Command-line Options: | -server -Xmn450m -Xms512m -Xmx512m -XX:ParallelGCThreads=2 -XX:+UseLargePages -XX:InlineSmallCode=1500 -XX:AutoBoxCacheMax=20000 -XX:+UseParallelGC -XX:FreqInlineSize=2500 -XX:CompileThresholdScaling=210 |
| JVM Affinity: | for each physicalCore { numactl -C physicalCoreId } |
| JVM Instances: | 16 |
| JVM Initial Heap (MB): | 512 |
| JVM Maximum Heap (MB): | 512 |
| JVM Address Bits: | 64 |
| Boot Firmware Version: | DZE104U |
| Management Firmware Version: | DZX310C |
| Workload Version: | SSJ 1.2.10 |
| Director Location: | Controller |
| Other Software: | None |
| Host | ssj_ops@100% |
|---|---|
| perf-1 | 1,024,560 |
| perf-2 | 1,029,857 |
| ssj_ops@100% | 2,054,417 |
| ssj_ops@100% per Host | 1,027,209 |
| ssj_ops@100% per JVM | 64,201 |

| Target Load | Actual Load | ssj_ops | |
|---|---|---|---|
| Target | Actual | ||
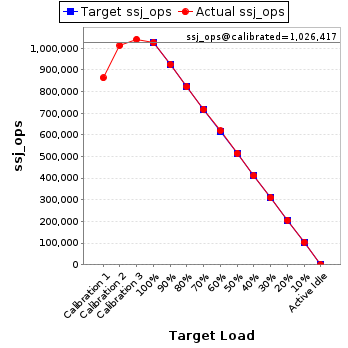
| Calibration 1 | 862,118 | ||
| Calibration 2 | 1,012,077 | ||
| Calibration 3 | 1,040,757 | ||
| ssj_ops@calibrated=1,026,417 | |||
| 100% | 99.8% | 1,026,417 | 1,024,560 |
| 90% | 90.0% | 923,776 | 923,875 |
| 80% | 80.0% | 821,134 | 820,833 |
| 70% | 69.8% | 718,492 | 716,908 |
| 60% | 60.2% | 615,850 | 617,682 |
| 50% | 50.0% | 513,209 | 513,587 |
| 40% | 40.0% | 410,567 | 410,142 |
| 30% | 30.1% | 307,925 | 308,950 |
| 20% | 20.0% | 205,283 | 205,051 |
| 10% | 10.1% | 102,642 | 103,801 |
| Active Idle | 0 | 0 | |
| Target Load | Actual Load | ssj_ops | |
|---|---|---|---|
| Target | Actual | ||
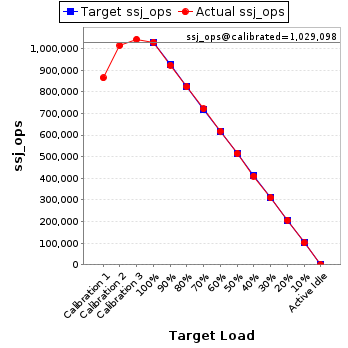
| Calibration 1 | 864,206 | ||
| Calibration 2 | 1,014,786 | ||
| Calibration 3 | 1,043,410 | ||
| ssj_ops@calibrated=1,029,098 | |||
| 100% | 100.1% | 1,029,098 | 1,029,857 |
| 90% | 89.7% | 926,188 | 922,662 |
| 80% | 80.0% | 823,279 | 822,905 |
| 70% | 70.0% | 720,369 | 720,540 |
| 60% | 60.1% | 617,459 | 618,524 |
| 50% | 50.0% | 514,549 | 514,144 |
| 40% | 39.9% | 411,639 | 410,258 |
| 30% | 30.1% | 308,729 | 309,559 |
| 20% | 20.0% | 205,820 | 205,857 |
| 10% | 9.8% | 102,910 | 101,278 |
| Active Idle | 0 | 0 | |