| Target Load |
Actual Load |
ssj_ops |
| Target |
Actual |
| Calibration 1 |
|
|
4,321,351 |
| Calibration 2 |
|
|
4,237,913 |
| Calibration 3 |
|
|
4,232,565 |
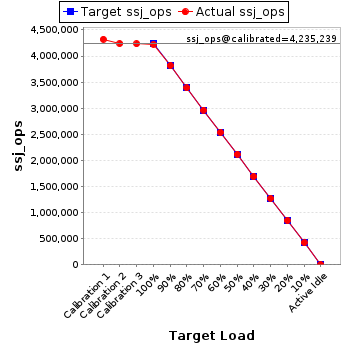
| ssj_ops@calibrated=4,235,239 |
| 100% |
99.7% |
4,235,239 |
4,222,435 |
| 90% |
90.1% |
3,811,715 |
3,815,961 |
| 80% |
80.0% |
3,388,191 |
3,387,432 |
| 70% |
70.0% |
2,964,667 |
2,964,413 |
| 60% |
60.0% |
2,541,143 |
2,539,623 |
| 50% |
50.0% |
2,117,619 |
2,116,785 |
| 40% |
40.0% |
1,694,095 |
1,692,048 |
| 30% |
30.1% |
1,270,572 |
1,273,101 |
| 20% |
20.0% |
847,048 |
845,536 |
| 10% |
10.0% |
423,524 |
422,507 |
| Active Idle |
|
0 |
0 |
| JVM Instance |
ssj_ops@100% |
| localhost.001 |
133,174 |
| localhost.002 |
134,352 |
| localhost.003 |
133,595 |
| localhost.004 |
132,903 |
| localhost.005 |
129,192 |
| localhost.006 |
135,406 |
| localhost.007 |
133,418 |
| localhost.008 |
134,324 |
| localhost.009 |
133,033 |
| localhost.010 |
130,295 |
| localhost.011 |
129,830 |
| localhost.012 |
127,433 |
| localhost.013 |
135,249 |
| localhost.014 |
122,634 |
| localhost.015 |
132,933 |
| localhost.016 |
132,616 |
| localhost.017 |
131,854 |
| localhost.018 |
132,682 |
| localhost.019 |
134,198 |
| localhost.020 |
133,993 |
| localhost.021 |
131,665 |
| localhost.022 |
132,886 |
| localhost.023 |
132,655 |
| localhost.024 |
127,641 |
| localhost.025 |
134,726 |
| localhost.026 |
134,292 |
| localhost.027 |
135,680 |
| localhost.028 |
134,728 |
| localhost.029 |
133,344 |
| localhost.030 |
129,199 |
| localhost.031 |
120,110 |
| localhost.032 |
132,395 |
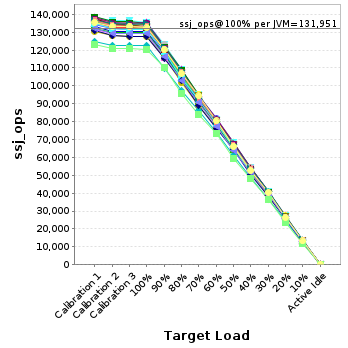
| ssj_ops@100% |
4,222,435 |
| ssj_ops@100% per JVM |
131,951 |
JVM 'localhost.001' Scores:
| Target Load |
Actual Load |
ssj_ops |
| Target |
Actual |
| Calibration 1 |
|
|
136,623 |
| Calibration 2 |
|
|
133,817 |
| Calibration 3 |
|
|
133,676 |
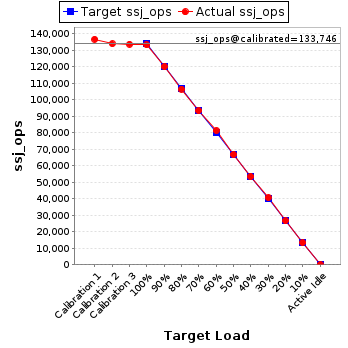
| ssj_ops@calibrated=133,746 |
| 100% |
99.6% |
133,746 |
133,174 |
| 90% |
89.7% |
120,372 |
120,036 |
| 80% |
79.6% |
106,997 |
106,453 |
| 70% |
69.8% |
93,622 |
93,331 |
| 60% |
60.8% |
80,248 |
81,269 |
| 50% |
49.9% |
66,873 |
66,716 |
| 40% |
39.9% |
53,499 |
53,396 |
| 30% |
30.3% |
40,124 |
40,584 |
| 20% |
19.8% |
26,749 |
26,525 |
| 10% |
10.0% |
13,375 |
13,358 |
| Active Idle |
|
0 |
0 |
JVM 'localhost.002' Scores:
| Target Load |
Actual Load |
ssj_ops |
| Target |
Actual |
| Calibration 1 |
|
|
137,655 |
| Calibration 2 |
|
|
134,809 |
| Calibration 3 |
|
|
134,648 |
| ssj_ops@calibrated=134,728 |
| 100% |
99.7% |
134,728 |
134,352 |
| 90% |
89.8% |
121,256 |
120,984 |
| 80% |
80.1% |
107,783 |
107,954 |
| 70% |
70.3% |
94,310 |
94,654 |
| 60% |
60.6% |
80,837 |
81,653 |
| 50% |
50.0% |
67,364 |
67,387 |
| 40% |
40.4% |
53,891 |
54,494 |
| 30% |
30.1% |
40,419 |
40,556 |
| 20% |
20.2% |
26,946 |
27,250 |
| 10% |
9.9% |
13,473 |
13,291 |
| Active Idle |
|
0 |
0 |
JVM 'localhost.003' Scores:
| Target Load |
Actual Load |
ssj_ops |
| Target |
Actual |
| Calibration 1 |
|
|
136,807 |
| Calibration 2 |
|
|
133,880 |
| Calibration 3 |
|
|
133,975 |
| ssj_ops@calibrated=133,928 |
| 100% |
99.8% |
133,928 |
133,595 |
| 90% |
90.1% |
120,535 |
120,678 |
| 80% |
80.6% |
107,142 |
107,885 |
| 70% |
70.3% |
93,749 |
94,193 |
| 60% |
59.4% |
80,357 |
79,495 |
| 50% |
51.0% |
66,964 |
68,249 |
| 40% |
40.0% |
53,571 |
53,608 |
| 30% |
30.0% |
40,178 |
40,196 |
| 20% |
20.0% |
26,786 |
26,779 |
| 10% |
9.9% |
13,393 |
13,286 |
| Active Idle |
|
0 |
0 |
JVM 'localhost.004' Scores:
| Target Load |
Actual Load |
ssj_ops |
| Target |
Actual |
| Calibration 1 |
|
|
136,400 |
| Calibration 2 |
|
|
134,123 |
| Calibration 3 |
|
|
133,916 |
| ssj_ops@calibrated=134,019 |
| 100% |
99.2% |
134,019 |
132,903 |
| 90% |
90.2% |
120,617 |
120,936 |
| 80% |
80.4% |
107,215 |
107,809 |
| 70% |
69.4% |
93,813 |
93,031 |
| 60% |
60.3% |
80,412 |
80,871 |
| 50% |
50.1% |
67,010 |
67,154 |
| 40% |
40.2% |
53,608 |
53,825 |
| 30% |
29.9% |
40,206 |
40,120 |
| 20% |
19.7% |
26,804 |
26,383 |
| 10% |
9.8% |
13,402 |
13,082 |
| Active Idle |
|
0 |
0 |
JVM 'localhost.005' Scores:
| Target Load |
Actual Load |
ssj_ops |
| Target |
Actual |
| Calibration 1 |
|
|
131,594 |
| Calibration 2 |
|
|
129,036 |
| Calibration 3 |
|
|
129,009 |
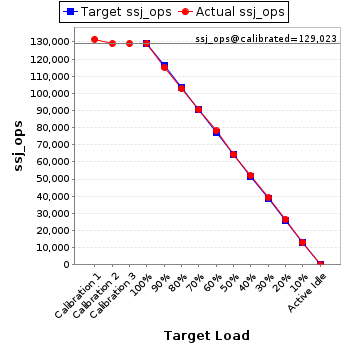
| ssj_ops@calibrated=129,023 |
| 100% |
100.1% |
129,023 |
129,192 |
| 90% |
89.2% |
116,121 |
115,131 |
| 80% |
79.6% |
103,218 |
102,729 |
| 70% |
70.2% |
90,316 |
90,526 |
| 60% |
60.5% |
77,414 |
78,043 |
| 50% |
49.9% |
64,511 |
64,411 |
| 40% |
40.2% |
51,609 |
51,875 |
| 30% |
30.2% |
38,707 |
38,971 |
| 20% |
20.5% |
25,805 |
26,429 |
| 10% |
10.1% |
12,902 |
12,976 |
| Active Idle |
|
0 |
0 |
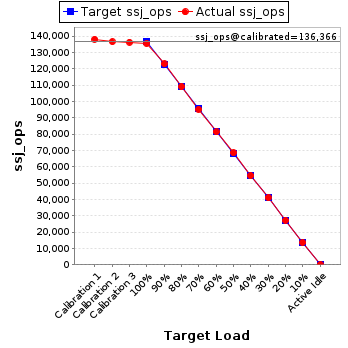
JVM 'localhost.006' Scores:
| Target Load |
Actual Load |
ssj_ops |
| Target |
Actual |
| Calibration 1 |
|
|
138,019 |
| Calibration 2 |
|
|
136,490 |
| Calibration 3 |
|
|
136,243 |
| ssj_ops@calibrated=136,366 |
| 100% |
99.3% |
136,366 |
135,406 |
| 90% |
90.1% |
122,730 |
122,928 |
| 80% |
79.9% |
109,093 |
108,978 |
| 70% |
69.7% |
95,456 |
95,110 |
| 60% |
59.6% |
81,820 |
81,239 |
| 50% |
50.2% |
68,183 |
68,416 |
| 40% |
39.9% |
54,547 |
54,408 |
| 30% |
30.0% |
40,910 |
40,968 |
| 20% |
20.0% |
27,273 |
27,238 |
| 10% |
10.0% |
13,637 |
13,633 |
| Active Idle |
|
0 |
0 |
JVM 'localhost.007' Scores:
| Target Load |
Actual Load |
ssj_ops |
| Target |
Actual |
| Calibration 1 |
|
|
136,813 |
| Calibration 2 |
|
|
133,773 |
| Calibration 3 |
|
|
133,635 |
| ssj_ops@calibrated=133,704 |
| 100% |
99.8% |
133,704 |
133,418 |
| 90% |
90.3% |
120,334 |
120,765 |
| 80% |
80.1% |
106,963 |
107,161 |
| 70% |
70.2% |
93,593 |
93,854 |
| 60% |
59.3% |
80,222 |
79,341 |
| 50% |
49.7% |
66,852 |
66,428 |
| 40% |
39.3% |
53,482 |
52,533 |
| 30% |
29.9% |
40,111 |
39,996 |
| 20% |
20.2% |
26,741 |
27,042 |
| 10% |
9.6% |
13,370 |
12,874 |
| Active Idle |
|
0 |
0 |
JVM 'localhost.008' Scores:
| Target Load |
Actual Load |
ssj_ops |
| Target |
Actual |
| Calibration 1 |
|
|
138,008 |
| Calibration 2 |
|
|
135,311 |
| Calibration 3 |
|
|
135,138 |
| ssj_ops@calibrated=135,225 |
| 100% |
99.3% |
135,225 |
134,324 |
| 90% |
90.0% |
121,702 |
121,717 |
| 80% |
79.5% |
108,180 |
107,543 |
| 70% |
69.6% |
94,657 |
94,049 |
| 60% |
60.1% |
81,135 |
81,314 |
| 50% |
50.4% |
67,612 |
68,090 |
| 40% |
40.3% |
54,090 |
54,428 |
| 30% |
30.4% |
40,567 |
41,100 |
| 20% |
19.7% |
27,045 |
26,664 |
| 10% |
10.2% |
13,522 |
13,775 |
| Active Idle |
|
0 |
0 |
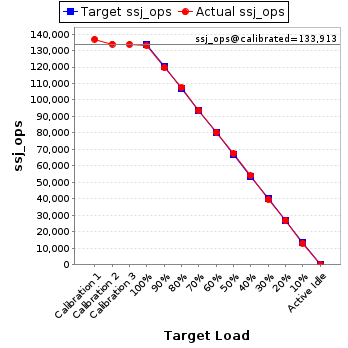
JVM 'localhost.009' Scores:
| Target Load |
Actual Load |
ssj_ops |
| Target |
Actual |
| Calibration 1 |
|
|
136,872 |
| Calibration 2 |
|
|
133,973 |
| Calibration 3 |
|
|
133,853 |
| ssj_ops@calibrated=133,913 |
| 100% |
99.3% |
133,913 |
133,033 |
| 90% |
89.2% |
120,522 |
119,508 |
| 80% |
80.3% |
107,130 |
107,511 |
| 70% |
69.9% |
93,739 |
93,588 |
| 60% |
60.1% |
80,348 |
80,433 |
| 50% |
50.4% |
66,957 |
67,447 |
| 40% |
40.3% |
53,565 |
53,967 |
| 30% |
29.6% |
40,174 |
39,658 |
| 20% |
19.9% |
26,783 |
26,686 |
| 10% |
9.7% |
13,391 |
12,958 |
| Active Idle |
|
0 |
0 |
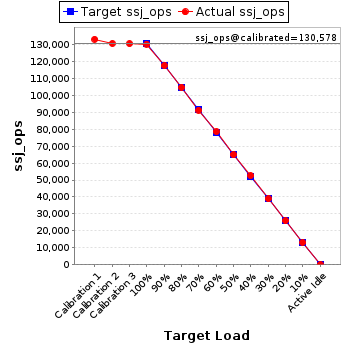
JVM 'localhost.010' Scores:
| Target Load |
Actual Load |
ssj_ops |
| Target |
Actual |
| Calibration 1 |
|
|
133,160 |
| Calibration 2 |
|
|
130,639 |
| Calibration 3 |
|
|
130,517 |
| ssj_ops@calibrated=130,578 |
| 100% |
99.8% |
130,578 |
130,295 |
| 90% |
90.1% |
117,520 |
117,596 |
| 80% |
80.2% |
104,462 |
104,751 |
| 70% |
69.9% |
91,405 |
91,221 |
| 60% |
60.2% |
78,347 |
78,564 |
| 50% |
49.7% |
65,289 |
64,884 |
| 40% |
40.3% |
52,231 |
52,621 |
| 30% |
29.8% |
39,173 |
38,919 |
| 20% |
19.8% |
26,116 |
25,917 |
| 10% |
10.1% |
13,058 |
13,179 |
| Active Idle |
|
0 |
0 |
JVM 'localhost.011' Scores:
| Target Load |
Actual Load |
ssj_ops |
| Target |
Actual |
| Calibration 1 |
|
|
132,240 |
| Calibration 2 |
|
|
129,833 |
| Calibration 3 |
|
|
129,616 |
| ssj_ops@calibrated=129,724 |
| 100% |
100.1% |
129,724 |
129,830 |
| 90% |
90.3% |
116,752 |
117,189 |
| 80% |
80.2% |
103,779 |
103,997 |
| 70% |
69.9% |
90,807 |
90,644 |
| 60% |
60.4% |
77,835 |
78,363 |
| 50% |
49.7% |
64,862 |
64,483 |
| 40% |
40.2% |
51,890 |
52,128 |
| 30% |
30.2% |
38,917 |
39,121 |
| 20% |
19.9% |
25,945 |
25,823 |
| 10% |
9.8% |
12,972 |
12,712 |
| Active Idle |
|
0 |
0 |
JVM 'localhost.012' Scores:
| Target Load |
Actual Load |
ssj_ops |
| Target |
Actual |
| Calibration 1 |
|
|
130,494 |
| Calibration 2 |
|
|
127,858 |
| Calibration 3 |
|
|
127,673 |
| ssj_ops@calibrated=127,765 |
| 100% |
99.7% |
127,765 |
127,433 |
| 90% |
90.6% |
114,989 |
115,706 |
| 80% |
79.6% |
102,212 |
101,763 |
| 70% |
69.4% |
89,436 |
88,722 |
| 60% |
59.9% |
76,659 |
76,574 |
| 50% |
50.3% |
63,883 |
64,291 |
| 40% |
40.2% |
51,106 |
51,418 |
| 30% |
29.9% |
38,330 |
38,254 |
| 20% |
20.1% |
25,553 |
25,674 |
| 10% |
10.4% |
12,777 |
13,275 |
| Active Idle |
|
0 |
0 |
JVM 'localhost.013' Scores:
| Target Load |
Actual Load |
ssj_ops |
| Target |
Actual |
| Calibration 1 |
|
|
138,338 |
| Calibration 2 |
|
|
135,012 |
| Calibration 3 |
|
|
134,878 |
| ssj_ops@calibrated=134,945 |
| 100% |
100.2% |
134,945 |
135,249 |
| 90% |
90.4% |
121,450 |
121,980 |
| 80% |
80.7% |
107,956 |
108,877 |
| 70% |
70.2% |
94,461 |
94,745 |
| 60% |
59.7% |
80,967 |
80,603 |
| 50% |
49.8% |
67,472 |
67,138 |
| 40% |
39.8% |
53,978 |
53,655 |
| 30% |
29.8% |
40,483 |
40,254 |
| 20% |
20.5% |
26,989 |
27,608 |
| 10% |
9.7% |
13,494 |
13,154 |
| Active Idle |
|
0 |
0 |
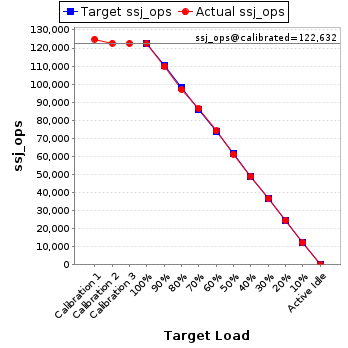
JVM 'localhost.014' Scores:
| Target Load |
Actual Load |
ssj_ops |
| Target |
Actual |
| Calibration 1 |
|
|
124,864 |
| Calibration 2 |
|
|
122,672 |
| Calibration 3 |
|
|
122,592 |
| ssj_ops@calibrated=122,632 |
| 100% |
100.0% |
122,632 |
122,634 |
| 90% |
89.5% |
110,369 |
109,813 |
| 80% |
79.2% |
98,106 |
97,130 |
| 70% |
70.5% |
85,842 |
86,454 |
| 60% |
60.4% |
73,579 |
74,094 |
| 50% |
49.9% |
61,316 |
61,196 |
| 40% |
39.9% |
49,053 |
48,930 |
| 30% |
29.8% |
36,790 |
36,598 |
| 20% |
20.1% |
24,526 |
24,664 |
| 10% |
10.0% |
12,263 |
12,212 |
| Active Idle |
|
0 |
0 |
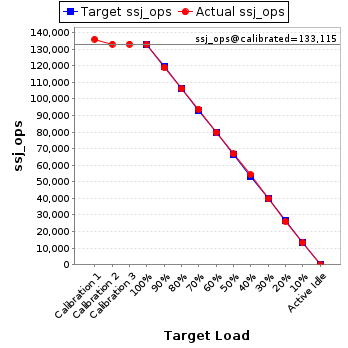
JVM 'localhost.015' Scores:
| Target Load |
Actual Load |
ssj_ops |
| Target |
Actual |
| Calibration 1 |
|
|
136,039 |
| Calibration 2 |
|
|
133,081 |
| Calibration 3 |
|
|
133,149 |
| ssj_ops@calibrated=133,115 |
| 100% |
99.9% |
133,115 |
132,933 |
| 90% |
89.4% |
119,804 |
118,955 |
| 80% |
79.7% |
106,492 |
106,036 |
| 70% |
70.5% |
93,181 |
93,837 |
| 60% |
60.0% |
79,869 |
79,871 |
| 50% |
50.2% |
66,558 |
66,845 |
| 40% |
40.8% |
53,246 |
54,300 |
| 30% |
29.8% |
39,935 |
39,713 |
| 20% |
19.7% |
26,623 |
26,162 |
| 10% |
9.9% |
13,312 |
13,171 |
| Active Idle |
|
0 |
0 |
JVM 'localhost.016' Scores:
| Target Load |
Actual Load |
ssj_ops |
| Target |
Actual |
| Calibration 1 |
|
|
135,345 |
| Calibration 2 |
|
|
132,602 |
| Calibration 3 |
|
|
132,832 |
| ssj_ops@calibrated=132,717 |
| 100% |
99.9% |
132,717 |
132,616 |
| 90% |
89.0% |
119,445 |
118,054 |
| 80% |
80.9% |
106,173 |
107,351 |
| 70% |
69.8% |
92,902 |
92,588 |
| 60% |
59.1% |
79,630 |
78,392 |
| 50% |
50.7% |
66,358 |
67,260 |
| 40% |
40.0% |
53,087 |
53,049 |
| 30% |
30.2% |
39,815 |
40,018 |
| 20% |
20.1% |
26,543 |
26,737 |
| 10% |
9.9% |
13,272 |
13,167 |
| Active Idle |
|
0 |
0 |
JVM 'localhost.017' Scores:
| Target Load |
Actual Load |
ssj_ops |
| Target |
Actual |
| Calibration 1 |
|
|
134,164 |
| Calibration 2 |
|
|
131,794 |
| Calibration 3 |
|
|
131,550 |
| ssj_ops@calibrated=131,672 |
| 100% |
100.1% |
131,672 |
131,854 |
| 90% |
89.8% |
118,505 |
118,264 |
| 80% |
80.2% |
105,338 |
105,538 |
| 70% |
70.1% |
92,171 |
92,344 |
| 60% |
60.3% |
79,003 |
79,350 |
| 50% |
50.2% |
65,836 |
66,073 |
| 40% |
40.2% |
52,669 |
52,871 |
| 30% |
30.3% |
39,502 |
39,893 |
| 20% |
19.8% |
26,334 |
26,052 |
| 10% |
10.1% |
13,167 |
13,242 |
| Active Idle |
|
0 |
0 |
JVM 'localhost.018' Scores:
| Target Load |
Actual Load |
ssj_ops |
| Target |
Actual |
| Calibration 1 |
|
|
136,028 |
| Calibration 2 |
|
|
133,199 |
| Calibration 3 |
|
|
132,979 |
| ssj_ops@calibrated=133,089 |
| 100% |
99.7% |
133,089 |
132,682 |
| 90% |
90.6% |
119,780 |
120,577 |
| 80% |
79.1% |
106,471 |
105,288 |
| 70% |
70.2% |
93,162 |
93,380 |
| 60% |
60.3% |
79,853 |
80,248 |
| 50% |
49.2% |
66,544 |
65,484 |
| 40% |
39.7% |
53,236 |
52,820 |
| 30% |
30.8% |
39,927 |
40,997 |
| 20% |
19.6% |
26,618 |
26,071 |
| 10% |
10.1% |
13,309 |
13,467 |
| Active Idle |
|
0 |
0 |
JVM 'localhost.019' Scores:
| Target Load |
Actual Load |
ssj_ops |
| Target |
Actual |
| Calibration 1 |
|
|
138,040 |
| Calibration 2 |
|
|
135,178 |
| Calibration 3 |
|
|
134,707 |
| ssj_ops@calibrated=134,943 |
| 100% |
99.4% |
134,943 |
134,198 |
| 90% |
90.2% |
121,448 |
121,731 |
| 80% |
79.4% |
107,954 |
107,198 |
| 70% |
70.3% |
94,460 |
94,912 |
| 60% |
58.9% |
80,966 |
79,467 |
| 50% |
49.7% |
67,471 |
67,081 |
| 40% |
39.6% |
53,977 |
53,404 |
| 30% |
30.1% |
40,483 |
40,574 |
| 20% |
20.2% |
26,989 |
27,237 |
| 10% |
9.9% |
13,494 |
13,371 |
| Active Idle |
|
0 |
0 |
JVM 'localhost.020' Scores:
| Target Load |
Actual Load |
ssj_ops |
| Target |
Actual |
| Calibration 1 |
|
|
136,690 |
| Calibration 2 |
|
|
133,926 |
| Calibration 3 |
|
|
134,078 |
| ssj_ops@calibrated=134,002 |
| 100% |
100.0% |
134,002 |
133,993 |
| 90% |
90.7% |
120,602 |
121,499 |
| 80% |
80.6% |
107,202 |
108,055 |
| 70% |
70.2% |
93,801 |
94,010 |
| 60% |
59.9% |
80,401 |
80,211 |
| 50% |
50.1% |
67,001 |
67,141 |
| 40% |
40.2% |
53,601 |
53,832 |
| 30% |
30.0% |
40,201 |
40,211 |
| 20% |
19.8% |
26,800 |
26,585 |
| 10% |
10.2% |
13,400 |
13,617 |
| Active Idle |
|
0 |
0 |
JVM 'localhost.021' Scores:
| Target Load |
Actual Load |
ssj_ops |
| Target |
Actual |
| Calibration 1 |
|
|
134,698 |
| Calibration 2 |
|
|
132,024 |
| Calibration 3 |
|
|
131,740 |
| ssj_ops@calibrated=131,882 |
| 100% |
99.8% |
131,882 |
131,665 |
| 90% |
90.5% |
118,694 |
119,400 |
| 80% |
78.9% |
105,505 |
104,083 |
| 70% |
70.0% |
92,317 |
92,361 |
| 60% |
59.8% |
79,129 |
78,893 |
| 50% |
49.9% |
65,941 |
65,770 |
| 40% |
39.4% |
52,753 |
51,966 |
| 30% |
30.3% |
39,565 |
39,948 |
| 20% |
20.1% |
26,376 |
26,542 |
| 10% |
9.9% |
13,188 |
13,075 |
| Active Idle |
|
0 |
0 |
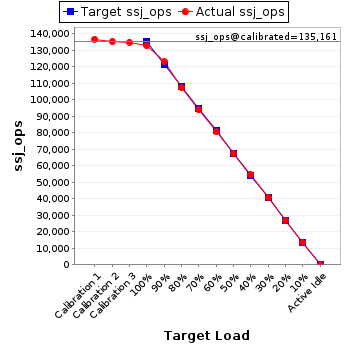
JVM 'localhost.022' Scores:
| Target Load |
Actual Load |
ssj_ops |
| Target |
Actual |
| Calibration 1 |
|
|
136,713 |
| Calibration 2 |
|
|
135,319 |
| Calibration 3 |
|
|
135,004 |
| ssj_ops@calibrated=135,161 |
| 100% |
98.3% |
135,161 |
132,886 |
| 90% |
91.0% |
121,645 |
123,009 |
| 80% |
79.5% |
108,129 |
107,505 |
| 70% |
69.6% |
94,613 |
94,030 |
| 60% |
59.6% |
81,097 |
80,584 |
| 50% |
49.9% |
67,581 |
67,462 |
| 40% |
40.3% |
54,065 |
54,455 |
| 30% |
30.0% |
40,548 |
40,559 |
| 20% |
19.9% |
27,032 |
26,954 |
| 10% |
9.9% |
13,516 |
13,367 |
| Active Idle |
|
0 |
0 |
JVM 'localhost.023' Scores:
| Target Load |
Actual Load |
ssj_ops |
| Target |
Actual |
| Calibration 1 |
|
|
137,383 |
| Calibration 2 |
|
|
134,180 |
| Calibration 3 |
|
|
134,154 |
| ssj_ops@calibrated=134,167 |
| 100% |
98.9% |
134,167 |
132,655 |
| 90% |
89.9% |
120,750 |
120,583 |
| 80% |
80.4% |
107,334 |
107,867 |
| 70% |
70.1% |
93,917 |
94,050 |
| 60% |
60.5% |
80,500 |
81,155 |
| 50% |
49.9% |
67,084 |
66,928 |
| 40% |
39.9% |
53,667 |
53,557 |
| 30% |
30.2% |
40,250 |
40,479 |
| 20% |
20.1% |
26,833 |
27,017 |
| 10% |
9.9% |
13,417 |
13,333 |
| Active Idle |
|
0 |
0 |
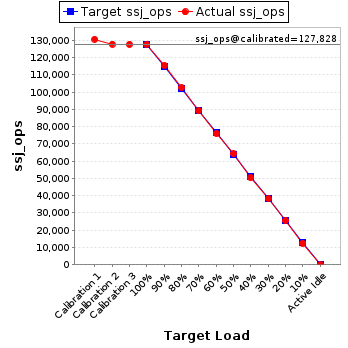
JVM 'localhost.024' Scores:
| Target Load |
Actual Load |
ssj_ops |
| Target |
Actual |
| Calibration 1 |
|
|
130,677 |
| Calibration 2 |
|
|
127,885 |
| Calibration 3 |
|
|
127,772 |
| ssj_ops@calibrated=127,828 |
| 100% |
99.9% |
127,828 |
127,641 |
| 90% |
90.4% |
115,046 |
115,547 |
| 80% |
80.4% |
102,263 |
102,731 |
| 70% |
69.7% |
89,480 |
89,134 |
| 60% |
59.5% |
76,697 |
76,095 |
| 50% |
50.3% |
63,914 |
64,256 |
| 40% |
39.5% |
51,131 |
50,429 |
| 30% |
29.9% |
38,349 |
38,231 |
| 20% |
20.0% |
25,566 |
25,606 |
| 10% |
9.8% |
12,783 |
12,491 |
| Active Idle |
|
0 |
0 |
JVM 'localhost.025' Scores:
| Target Load |
Actual Load |
ssj_ops |
| Target |
Actual |
| Calibration 1 |
|
|
138,804 |
| Calibration 2 |
|
|
135,969 |
| Calibration 3 |
|
|
135,774 |
| ssj_ops@calibrated=135,872 |
| 100% |
99.2% |
135,872 |
134,726 |
| 90% |
89.9% |
122,285 |
122,124 |
| 80% |
80.4% |
108,697 |
109,306 |
| 70% |
70.0% |
95,110 |
95,061 |
| 60% |
59.1% |
81,523 |
80,237 |
| 50% |
49.9% |
67,936 |
67,825 |
| 40% |
39.8% |
54,349 |
54,078 |
| 30% |
30.2% |
40,762 |
41,081 |
| 20% |
19.8% |
27,174 |
26,893 |
| 10% |
10.1% |
13,587 |
13,712 |
| Active Idle |
|
0 |
0 |
JVM 'localhost.026' Scores:
| Target Load |
Actual Load |
ssj_ops |
| Target |
Actual |
| Calibration 1 |
|
|
136,763 |
| Calibration 2 |
|
|
134,198 |
| Calibration 3 |
|
|
133,977 |
| ssj_ops@calibrated=134,088 |
| 100% |
100.2% |
134,088 |
134,292 |
| 90% |
90.1% |
120,679 |
120,760 |
| 80% |
80.0% |
107,270 |
107,291 |
| 70% |
70.5% |
93,861 |
94,507 |
| 60% |
60.1% |
80,453 |
80,558 |
| 50% |
49.9% |
67,044 |
66,955 |
| 40% |
39.3% |
53,635 |
52,675 |
| 30% |
29.4% |
40,226 |
39,442 |
| 20% |
19.9% |
26,818 |
26,725 |
| 10% |
10.0% |
13,409 |
13,462 |
| Active Idle |
|
0 |
0 |
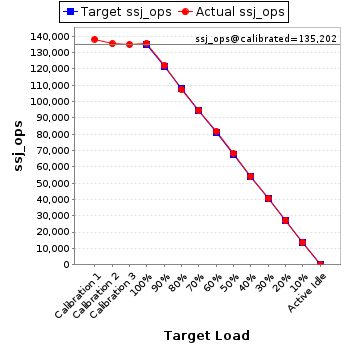
JVM 'localhost.027' Scores:
| Target Load |
Actual Load |
ssj_ops |
| Target |
Actual |
| Calibration 1 |
|
|
138,170 |
| Calibration 2 |
|
|
135,409 |
| Calibration 3 |
|
|
134,995 |
| ssj_ops@calibrated=135,202 |
| 100% |
100.4% |
135,202 |
135,680 |
| 90% |
90.1% |
121,682 |
121,836 |
| 80% |
79.4% |
108,162 |
107,367 |
| 70% |
69.9% |
94,642 |
94,485 |
| 60% |
60.5% |
81,121 |
81,733 |
| 50% |
50.4% |
67,601 |
68,195 |
| 40% |
40.1% |
54,081 |
54,210 |
| 30% |
30.1% |
40,561 |
40,685 |
| 20% |
19.9% |
27,040 |
26,936 |
| 10% |
10.1% |
13,520 |
13,596 |
| Active Idle |
|
0 |
0 |
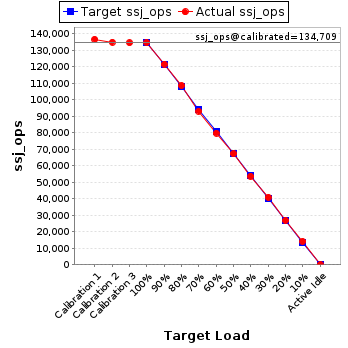
JVM 'localhost.028' Scores:
| Target Load |
Actual Load |
ssj_ops |
| Target |
Actual |
| Calibration 1 |
|
|
136,677 |
| Calibration 2 |
|
|
134,927 |
| Calibration 3 |
|
|
134,491 |
| ssj_ops@calibrated=134,709 |
| 100% |
100.0% |
134,709 |
134,728 |
| 90% |
90.3% |
121,238 |
121,600 |
| 80% |
80.6% |
107,768 |
108,603 |
| 70% |
69.1% |
94,297 |
93,095 |
| 60% |
59.3% |
80,826 |
79,821 |
| 50% |
49.8% |
67,355 |
67,149 |
| 40% |
39.8% |
53,884 |
53,592 |
| 30% |
30.3% |
40,413 |
40,862 |
| 20% |
20.0% |
26,942 |
26,954 |
| 10% |
10.5% |
13,471 |
14,137 |
| Active Idle |
|
0 |
0 |
JVM 'localhost.029' Scores:
| Target Load |
Actual Load |
ssj_ops |
| Target |
Actual |
| Calibration 1 |
|
|
136,462 |
| Calibration 2 |
|
|
133,799 |
| Calibration 3 |
|
|
133,436 |
| ssj_ops@calibrated=133,617 |
| 100% |
99.8% |
133,617 |
133,344 |
| 90% |
90.2% |
120,256 |
120,502 |
| 80% |
80.2% |
106,894 |
107,166 |
| 70% |
70.0% |
93,532 |
93,566 |
| 60% |
59.9% |
80,170 |
80,064 |
| 50% |
50.0% |
66,809 |
66,868 |
| 40% |
39.7% |
53,447 |
53,040 |
| 30% |
29.3% |
40,085 |
39,208 |
| 20% |
19.9% |
26,723 |
26,619 |
| 10% |
10.0% |
13,362 |
13,322 |
| Active Idle |
|
0 |
0 |
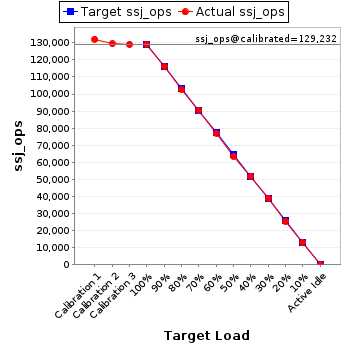
JVM 'localhost.030' Scores:
| Target Load |
Actual Load |
ssj_ops |
| Target |
Actual |
| Calibration 1 |
|
|
132,093 |
| Calibration 2 |
|
|
129,399 |
| Calibration 3 |
|
|
129,065 |
| ssj_ops@calibrated=129,232 |
| 100% |
100.0% |
129,232 |
129,199 |
| 90% |
89.9% |
116,309 |
116,174 |
| 80% |
79.6% |
103,386 |
102,813 |
| 70% |
70.1% |
90,462 |
90,575 |
| 60% |
59.7% |
77,539 |
77,147 |
| 50% |
49.2% |
64,616 |
63,629 |
| 40% |
40.0% |
51,693 |
51,716 |
| 30% |
30.2% |
38,770 |
39,024 |
| 20% |
19.8% |
25,846 |
25,536 |
| 10% |
10.1% |
12,923 |
13,029 |
| Active Idle |
|
0 |
0 |
JVM 'localhost.031' Scores:
| Target Load |
Actual Load |
ssj_ops |
| Target |
Actual |
| Calibration 1 |
|
|
123,202 |
| Calibration 2 |
|
|
120,609 |
| Calibration 3 |
|
|
120,592 |
| ssj_ops@calibrated=120,601 |
| 100% |
99.6% |
120,601 |
120,110 |
| 90% |
91.3% |
108,541 |
110,114 |
| 80% |
79.3% |
96,481 |
95,675 |
| 70% |
69.6% |
84,421 |
83,897 |
| 60% |
61.0% |
72,361 |
73,570 |
| 50% |
49.3% |
60,300 |
59,451 |
| 40% |
39.9% |
48,240 |
48,124 |
| 30% |
30.3% |
36,180 |
36,497 |
| 20% |
19.7% |
24,120 |
23,810 |
| 10% |
9.9% |
12,060 |
11,905 |
| Active Idle |
|
0 |
0 |
JVM 'localhost.032' Scores:
| Target Load |
Actual Load |
ssj_ops |
| Target |
Actual |
| Calibration 1 |
|
|
135,518 |
| Calibration 2 |
|
|
133,187 |
| Calibration 3 |
|
|
132,900 |
| ssj_ops@calibrated=133,044 |
| 100% |
99.5% |
133,044 |
132,395 |
| 90% |
90.4% |
119,739 |
120,265 |
| 80% |
80.4% |
106,435 |
107,018 |
| 70% |
71.0% |
93,131 |
94,458 |
| 60% |
60.4% |
79,826 |
80,373 |
| 50% |
49.7% |
66,522 |
66,121 |
| 40% |
39.6% |
53,217 |
52,646 |
| 30% |
30.4% |
39,913 |
40,383 |
| 20% |
19.9% |
26,609 |
26,417 |
| 10% |
10.0% |
13,304 |
13,279 |
| Active Idle |
|
0 |
0 |