
SPECpower_ssj2008
Host 'SP_SUT' Performance Report
Copyright © 2007-2023 Standard Performance Evaluation Corporation
| Dell Inc. PowerEdge C6615 (AMD EPYC 8534P, 2.30 GHz) | ssj_ops@100% = 7,073,925 ssj_ops@100% per JVM = 221,060 |
||||
| Test Sponsor: | Dell Inc. | SPEC License #: | 6573 | Test Method: | Multi Node |
| Tested By: | Dell Inc. | Test Location: | Round Rock, TX, USA | Test Date: | Oct 5, 2023 |
| Hardware Availability: | Dec-2023 | Software Availability: | Feb-2022 | Publication: | Oct 30, 2023 |
| System Source: | Single Supplier | System Designation: | Server | Power Provisioning: | Line-powered |
| Target Load | Actual Load | ssj_ops | |
|---|---|---|---|
| Target | Actual | ||
| Calibration 1 | 7,224,286 | ||
| Calibration 2 | 7,135,893 | ||
| Calibration 3 | 7,140,542 | ||
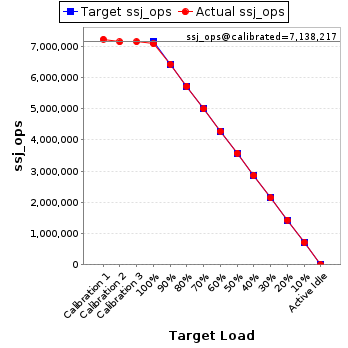
| ssj_ops@calibrated=7,138,217 | |||
| 100% | 99.1% | 7,138,217 | 7,073,925 |
| 90% | 90.0% | 6,424,396 | 6,423,595 |
| 80% | 80.1% | 5,710,574 | 5,716,752 |
| 70% | 69.9% | 4,996,752 | 4,989,375 |
| 60% | 59.9% | 4,282,930 | 4,277,043 |
| 50% | 50.0% | 3,569,109 | 3,569,706 |
| 40% | 40.0% | 2,855,287 | 2,858,405 |
| 30% | 30.0% | 2,141,465 | 2,139,117 |
| 20% | 20.1% | 1,427,643 | 1,431,362 |
| 10% | 10.0% | 713,822 | 714,622 |
| Active Idle | 0 | 0 | |
| Set Identifier: | sut |
| Set Description: | System Under Test |
| # of Identical Nodes: | 3 |
| Comment: | PowerEdge C6615 |
| Hardware | |
|---|---|
| Hardware Vendor: | Dell Inc. |
| Model: | PowerEdge C6615 (AMD EPYC 8534P, 2.30 GHz) |
| Form Factor: | Blade |
| CPU Name: | AMD EPYC 8534P |
| CPU Characteristics: | 64-Core, 2.30GHz, 128 MB L3 Cache |
| CPU Frequency (MHz): | 2300 |
| CPU(s) Enabled: | 64 cores, 1 chip, 64 cores/chip |
| Hardware Threads: | 128 (2 / core) |
| CPU(s) Orderable: | 1 chip |
| Primary Cache: | 32 KB I + 32 KB D on chip per core |
| Secondary Cache: | 1 MB I+D on chip per core |
| Tertiary Cache: | 128 MB I+D on chip per chip, 16 MB shared / 8 cores |
| Other Cache: | None |
| Memory Amount (GB): | 96 |
| # and size of DIMM: | 6 x 16 GB |
| Memory Details: | 16GB 1Rx8 PC5-4800-R (Slots A1-6 populated) |
| Power Supply Quantity and Rating (W): | None |
| Power Supply Details: | Shared |
| Disk Drive: | 1 x Dell NVMe PE8010 RI M.2 960GB, Dell p/n 21GXV |
| Disk Controller: | BOSS controller card, Dell p/n 3YGWT |
| # and type of Network Interface Cards (NICs) Installed: | Onboard 1 x Broadcom NetXtreme Gigabit Ethernet (BCM5720) |
| NICs Enabled in Firmware / OS / Connected: | 1/1/1 |
| Network Speed (Mbit): | 1000 |
| Keyboard: | None |
| Mouse: | None |
| Monitor: | None |
| Optical Drives: | No |
| Other Hardware: | None |
| Software | |
|---|---|
| Power Management: | Power saver power plan enabled in OS |
| Operating System (OS): | Microsoft Windows Server 2022 Datacenter |
| OS Version: | Version 21H2(OS Build 20348.558) |
| Filesystem: | NTFS |
| JVM Vendor: | Oracle Corporation |
| JVM Version: | Java HotSpot(TM) 64-Bit Server VM (build 17.0.1+12-LTS-39, mixed mode) |
| JVM Command-line Options: | -XX:AllocatePrefetchDistance=256 -XX:SurvivorRatio=8 -XX:TargetSurvivorRatio=99 -server -Xmn1900m -Xms2048m -Xmx2048m -XX:ParallelGCThreads=2 -XX:+UseLargePages -XX:LargePageSizeInBytes=2m -XX:InlineSmallCode=3900 -XX:UseAVX=1 -XX:AutoBoxCacheMax=20000 -XX:+UseParallelGC -XX:+OptimizeFill -XX:+AggressiveHeap |
| JVM Affinity: | start /NODE [0-7] /AFFINITY [0xF, 0xF0, 0xF00, 0xF000] |
| JVM Instances: | 32 |
| JVM Initial Heap (MB): | 2048 |
| JVM Maximum Heap (MB): | 2048 |
| JVM Address Bits: | 64 |
| Boot Firmware Version: | 0.3.3 |
| Management Firmware Version: | 7.00.55.00 (Build 10) |
| Workload Version: | SSJ 1.2.10 |
| Director Location: | Controller |
| Other Software: | None |
| JVM Instance | ssj_ops@100% |
|---|---|
| SP_SUT.001 | 228,430 |
| SP_SUT.002 | 223,228 |
| SP_SUT.003 | 214,344 |
| SP_SUT.004 | 212,039 |
| SP_SUT.005 | 222,081 |
| SP_SUT.006 | 219,587 |
| SP_SUT.007 | 224,430 |
| SP_SUT.008 | 208,734 |
| SP_SUT.009 | 226,783 |
| SP_SUT.010 | 222,882 |
| SP_SUT.011 | 216,954 |
| SP_SUT.012 | 226,996 |
| SP_SUT.013 | 223,627 |
| SP_SUT.014 | 210,683 |
| SP_SUT.015 | 212,261 |
| SP_SUT.016 | 224,361 |
| SP_SUT.017 | 223,268 |
| SP_SUT.018 | 222,501 |
| SP_SUT.019 | 221,586 |
| SP_SUT.020 | 216,366 |
| SP_SUT.021 | 227,025 |
| SP_SUT.022 | 226,700 |
| SP_SUT.023 | 215,705 |
| SP_SUT.024 | 220,671 |
| SP_SUT.025 | 219,631 |
| SP_SUT.026 | 226,595 |
| SP_SUT.027 | 220,650 |
| SP_SUT.028 | 224,004 |
| SP_SUT.029 | 227,987 |
| SP_SUT.030 | 221,185 |
| SP_SUT.031 | 217,541 |
| SP_SUT.032 | 225,090 |
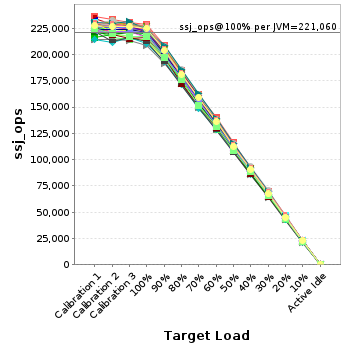
| ssj_ops@100% | 7,073,925 |
| ssj_ops@100% per JVM | 221,060 |
| Target Load | Actual Load | ssj_ops | |
|---|---|---|---|
| Target | Actual | ||
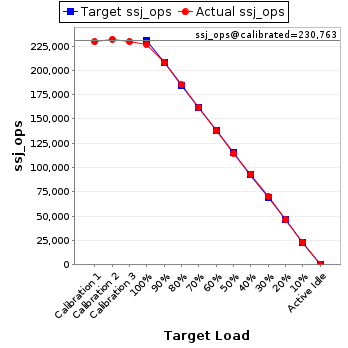
| Calibration 1 | 236,230 | ||
| Calibration 2 | 232,821 | ||
| Calibration 3 | 230,487 | ||
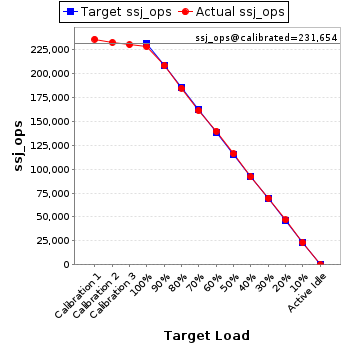
| ssj_ops@calibrated=231,654 | |||
| 100% | 98.6% | 231,654 | 228,430 |
| 90% | 90.1% | 208,489 | 208,657 |
| 80% | 79.9% | 185,323 | 185,052 |
| 70% | 69.7% | 162,158 | 161,454 |
| 60% | 60.4% | 138,992 | 139,831 |
| 50% | 50.1% | 115,827 | 116,104 |
| 40% | 39.7% | 92,662 | 91,946 |
| 30% | 30.1% | 69,496 | 69,701 |
| 20% | 20.2% | 46,331 | 46,814 |
| 10% | 10.1% | 23,165 | 23,290 |
| Active Idle | 0 | 0 | |
| Target Load | Actual Load | ssj_ops | |
|---|---|---|---|
| Target | Actual | ||
| Calibration 1 | 223,749 | ||
| Calibration 2 | 226,793 | ||
| Calibration 3 | 223,337 | ||
| ssj_ops@calibrated=225,065 | |||
| 100% | 99.2% | 225,065 | 223,228 |
| 90% | 89.6% | 202,558 | 201,580 |
| 80% | 79.6% | 180,052 | 179,209 |
| 70% | 69.9% | 157,545 | 157,381 |
| 60% | 59.9% | 135,039 | 134,888 |
| 50% | 49.7% | 112,532 | 111,759 |
| 40% | 39.9% | 90,026 | 89,717 |
| 30% | 29.8% | 67,519 | 67,163 |
| 20% | 20.2% | 45,013 | 45,454 |
| 10% | 10.0% | 22,506 | 22,517 |
| Active Idle | 0 | 0 | |

| Target Load | Actual Load | ssj_ops | |
|---|---|---|---|
| Target | Actual | ||
| Calibration 1 | 223,075 | ||
| Calibration 2 | 216,487 | ||
| Calibration 3 | 214,314 | ||
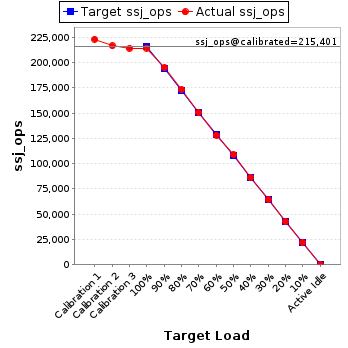
| ssj_ops@calibrated=215,401 | |||
| 100% | 99.5% | 215,401 | 214,344 |
| 90% | 90.4% | 193,861 | 194,811 |
| 80% | 80.5% | 172,321 | 173,361 |
| 70% | 70.0% | 150,780 | 150,698 |
| 60% | 59.6% | 129,240 | 128,312 |
| 50% | 50.6% | 107,700 | 108,986 |
| 40% | 40.1% | 86,160 | 86,385 |
| 30% | 30.0% | 64,620 | 64,661 |
| 20% | 19.8% | 43,080 | 42,620 |
| 10% | 10.1% | 21,540 | 21,820 |
| Active Idle | 0 | 0 | |
| Target Load | Actual Load | ssj_ops | |
|---|---|---|---|
| Target | Actual | ||
| Calibration 1 | 223,362 | ||
| Calibration 2 | 219,414 | ||
| Calibration 3 | 216,907 | ||
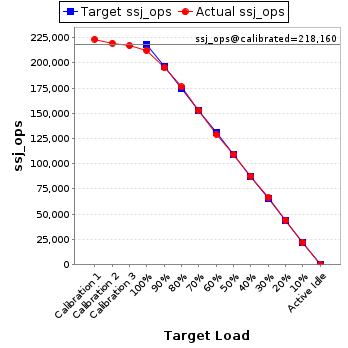
| ssj_ops@calibrated=218,160 | |||
| 100% | 97.2% | 218,160 | 212,039 |
| 90% | 89.4% | 196,344 | 195,035 |
| 80% | 80.7% | 174,528 | 176,078 |
| 70% | 69.9% | 152,712 | 152,548 |
| 60% | 59.3% | 130,896 | 129,323 |
| 50% | 50.1% | 109,080 | 109,236 |
| 40% | 40.2% | 87,264 | 87,672 |
| 30% | 30.3% | 65,448 | 66,167 |
| 20% | 20.2% | 43,632 | 44,108 |
| 10% | 10.0% | 21,816 | 21,907 |
| Active Idle | 0 | 0 | |
| Target Load | Actual Load | ssj_ops | |
|---|---|---|---|
| Target | Actual | ||
| Calibration 1 | 228,137 | ||
| Calibration 2 | 218,337 | ||
| Calibration 3 | 223,461 | ||
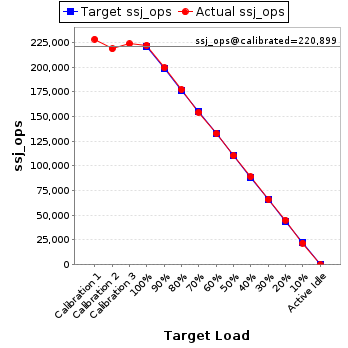
| ssj_ops@calibrated=220,899 | |||
| 100% | 100.5% | 220,899 | 222,081 |
| 90% | 90.2% | 198,809 | 199,308 |
| 80% | 80.3% | 176,719 | 177,307 |
| 70% | 69.8% | 154,629 | 154,164 |
| 60% | 60.0% | 132,539 | 132,608 |
| 50% | 49.9% | 110,449 | 110,274 |
| 40% | 40.3% | 88,360 | 88,945 |
| 30% | 29.8% | 66,270 | 65,895 |
| 20% | 20.4% | 44,180 | 45,103 |
| 10% | 9.9% | 22,090 | 21,854 |
| Active Idle | 0 | 0 | |
| Target Load | Actual Load | ssj_ops | |
|---|---|---|---|
| Target | Actual | ||
| Calibration 1 | 225,738 | ||
| Calibration 2 | 218,843 | ||
| Calibration 3 | 221,846 | ||
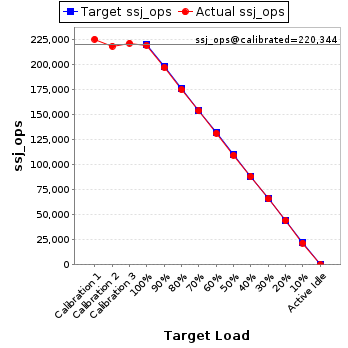
| ssj_ops@calibrated=220,344 | |||
| 100% | 99.7% | 220,344 | 219,587 |
| 90% | 89.6% | 198,310 | 197,369 |
| 80% | 79.5% | 176,276 | 175,223 |
| 70% | 69.8% | 154,241 | 153,903 |
| 60% | 59.7% | 132,207 | 131,544 |
| 50% | 49.7% | 110,172 | 109,504 |
| 40% | 40.1% | 88,138 | 88,266 |
| 30% | 29.9% | 66,103 | 65,814 |
| 20% | 20.0% | 44,069 | 44,146 |
| 10% | 9.8% | 22,034 | 21,690 |
| Active Idle | 0 | 0 | |
| Target Load | Actual Load | ssj_ops | |
|---|---|---|---|
| Target | Actual | ||
| Calibration 1 | 231,593 | ||
| Calibration 2 | 228,312 | ||
| Calibration 3 | 225,329 | ||
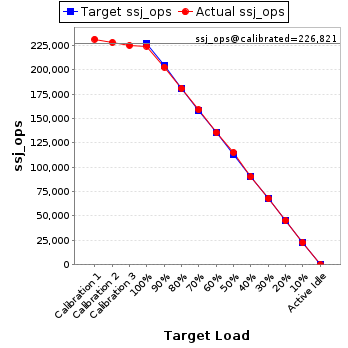
| ssj_ops@calibrated=226,821 | |||
| 100% | 98.9% | 226,821 | 224,430 |
| 90% | 89.5% | 204,139 | 202,922 |
| 80% | 79.9% | 181,457 | 181,165 |
| 70% | 70.2% | 158,775 | 159,128 |
| 60% | 59.8% | 136,092 | 135,748 |
| 50% | 50.8% | 113,410 | 115,300 |
| 40% | 39.8% | 90,728 | 90,186 |
| 30% | 30.0% | 68,046 | 67,970 |
| 20% | 20.0% | 45,364 | 45,363 |
| 10% | 10.1% | 22,682 | 22,805 |
| Active Idle | 0 | 0 | |
| Target Load | Actual Load | ssj_ops | |
|---|---|---|---|
| Target | Actual | ||
| Calibration 1 | 213,808 | ||
| Calibration 2 | 213,968 | ||
| Calibration 3 | 213,487 | ||
| ssj_ops@calibrated=213,727 | |||
| 100% | 97.7% | 213,727 | 208,734 |
| 90% | 89.6% | 192,355 | 191,459 |
| 80% | 80.5% | 170,982 | 171,994 |
| 70% | 69.9% | 149,609 | 149,372 |
| 60% | 60.0% | 128,236 | 128,186 |
| 50% | 50.5% | 106,864 | 107,992 |
| 40% | 40.2% | 85,491 | 85,888 |
| 30% | 29.9% | 64,118 | 63,833 |
| 20% | 20.1% | 42,745 | 43,057 |
| 10% | 10.1% | 21,373 | 21,520 |
| Active Idle | 0 | 0 | |

| Target Load | Actual Load | ssj_ops | |
|---|---|---|---|
| Target | Actual | ||
| Calibration 1 | 233,907 | ||
| Calibration 2 | 228,412 | ||
| Calibration 3 | 229,635 | ||
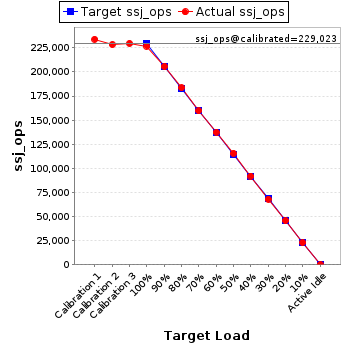
| ssj_ops@calibrated=229,023 | |||
| 100% | 99.0% | 229,023 | 226,783 |
| 90% | 89.8% | 206,121 | 205,719 |
| 80% | 80.1% | 183,219 | 183,528 |
| 70% | 69.7% | 160,316 | 159,573 |
| 60% | 60.1% | 137,414 | 137,556 |
| 50% | 50.5% | 114,512 | 115,599 |
| 40% | 40.2% | 91,609 | 91,999 |
| 30% | 29.7% | 68,707 | 68,024 |
| 20% | 19.9% | 45,805 | 45,608 |
| 10% | 10.0% | 22,902 | 22,958 |
| Active Idle | 0 | 0 | |
| Target Load | Actual Load | ssj_ops | |
|---|---|---|---|
| Target | Actual | ||
| Calibration 1 | 232,783 | ||
| Calibration 2 | 220,155 | ||
| Calibration 3 | 223,527 | ||
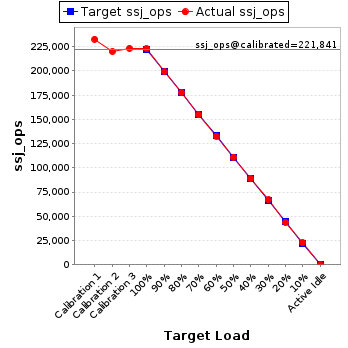
| ssj_ops@calibrated=221,841 | |||
| 100% | 100.5% | 221,841 | 222,882 |
| 90% | 89.7% | 199,657 | 199,049 |
| 80% | 80.0% | 177,473 | 177,560 |
| 70% | 69.8% | 155,289 | 154,884 |
| 60% | 59.9% | 133,105 | 132,835 |
| 50% | 50.1% | 110,921 | 111,122 |
| 40% | 40.1% | 88,736 | 88,929 |
| 30% | 30.1% | 66,552 | 66,782 |
| 20% | 19.7% | 44,368 | 43,622 |
| 10% | 10.2% | 22,184 | 22,682 |
| Active Idle | 0 | 0 | |
| Target Load | Actual Load | ssj_ops | |
|---|---|---|---|
| Target | Actual | ||
| Calibration 1 | 216,536 | ||
| Calibration 2 | 218,863 | ||
| Calibration 3 | 221,550 | ||
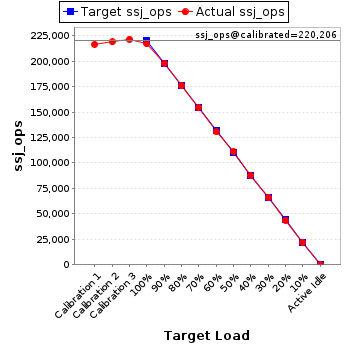
| ssj_ops@calibrated=220,206 | |||
| 100% | 98.5% | 220,206 | 216,954 |
| 90% | 89.8% | 198,186 | 197,724 |
| 80% | 79.8% | 176,165 | 175,711 |
| 70% | 70.1% | 154,145 | 154,306 |
| 60% | 59.3% | 132,124 | 130,488 |
| 50% | 50.3% | 110,103 | 110,808 |
| 40% | 39.8% | 88,083 | 87,618 |
| 30% | 30.1% | 66,062 | 66,207 |
| 20% | 19.9% | 44,041 | 43,736 |
| 10% | 10.0% | 22,021 | 21,916 |
| Active Idle | 0 | 0 | |
| Target Load | Actual Load | ssj_ops | |
|---|---|---|---|
| Target | Actual | ||
| Calibration 1 | 226,246 | ||
| Calibration 2 | 232,176 | ||
| Calibration 3 | 226,693 | ||
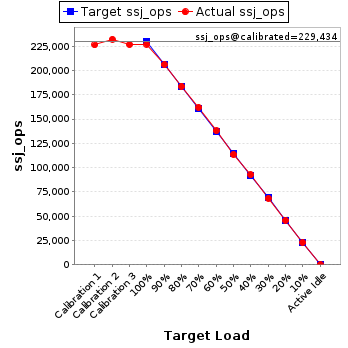
| ssj_ops@calibrated=229,434 | |||
| 100% | 98.9% | 229,434 | 226,996 |
| 90% | 89.8% | 206,491 | 206,091 |
| 80% | 80.1% | 183,548 | 183,703 |
| 70% | 70.6% | 160,604 | 162,002 |
| 60% | 60.1% | 137,661 | 137,929 |
| 50% | 49.4% | 114,717 | 113,447 |
| 40% | 40.4% | 91,774 | 92,656 |
| 30% | 29.8% | 68,830 | 68,307 |
| 20% | 20.0% | 45,887 | 45,807 |
| 10% | 10.0% | 22,943 | 22,937 |
| Active Idle | 0 | 0 | |
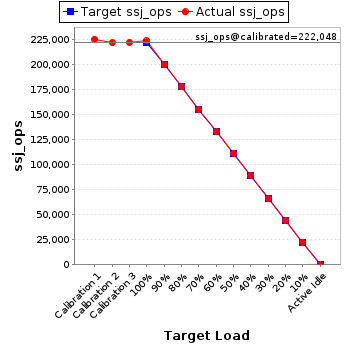
| Target Load | Actual Load | ssj_ops | |
|---|---|---|---|
| Target | Actual | ||
| Calibration 1 | 225,361 | ||
| Calibration 2 | 221,814 | ||
| Calibration 3 | 222,283 | ||
| ssj_ops@calibrated=222,048 | |||
| 100% | 100.7% | 222,048 | 223,627 |
| 90% | 90.0% | 199,843 | 199,928 |
| 80% | 80.0% | 177,639 | 177,743 |
| 70% | 70.0% | 155,434 | 155,372 |
| 60% | 59.9% | 133,229 | 132,984 |
| 50% | 50.1% | 111,024 | 111,343 |
| 40% | 40.3% | 88,819 | 89,499 |
| 30% | 29.7% | 66,614 | 66,055 |
| 20% | 20.0% | 44,410 | 44,441 |
| 10% | 10.2% | 22,205 | 22,541 |
| Active Idle | 0 | 0 | |
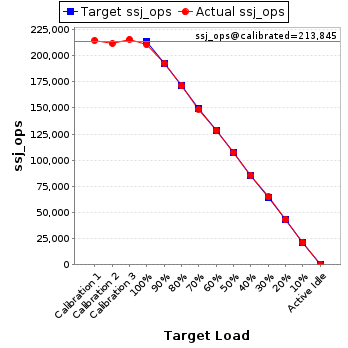
| Target Load | Actual Load | ssj_ops | |
|---|---|---|---|
| Target | Actual | ||
| Calibration 1 | 214,645 | ||
| Calibration 2 | 211,867 | ||
| Calibration 3 | 215,823 | ||
| ssj_ops@calibrated=213,845 | |||
| 100% | 98.5% | 213,845 | 210,683 |
| 90% | 90.2% | 192,461 | 192,882 |
| 80% | 80.0% | 171,076 | 171,066 |
| 70% | 69.6% | 149,692 | 148,873 |
| 60% | 60.1% | 128,307 | 128,520 |
| 50% | 50.1% | 106,923 | 107,225 |
| 40% | 40.1% | 85,538 | 85,728 |
| 30% | 30.3% | 64,154 | 64,790 |
| 20% | 20.3% | 42,769 | 43,315 |
| 10% | 10.1% | 21,385 | 21,516 |
| Active Idle | 0 | 0 | |
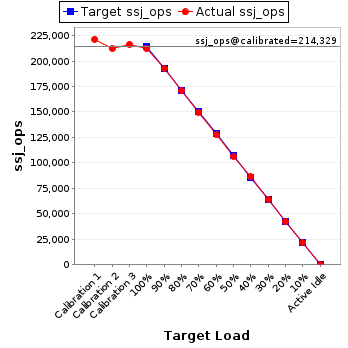
| Target Load | Actual Load | ssj_ops | |
|---|---|---|---|
| Target | Actual | ||
| Calibration 1 | 221,471 | ||
| Calibration 2 | 212,384 | ||
| Calibration 3 | 216,274 | ||
| ssj_ops@calibrated=214,329 | |||
| 100% | 99.0% | 214,329 | 212,261 |
| 90% | 89.9% | 192,896 | 192,686 |
| 80% | 79.7% | 171,463 | 170,736 |
| 70% | 69.9% | 150,030 | 149,876 |
| 60% | 59.6% | 128,597 | 127,809 |
| 50% | 49.6% | 107,164 | 106,326 |
| 40% | 40.2% | 85,732 | 86,214 |
| 30% | 30.0% | 64,299 | 64,328 |
| 20% | 19.8% | 42,866 | 42,443 |
| 10% | 10.0% | 21,433 | 21,453 |
| Active Idle | 0 | 0 | |
| Target Load | Actual Load | ssj_ops | |
|---|---|---|---|
| Target | Actual | ||
| Calibration 1 | 222,326 | ||
| Calibration 2 | 224,171 | ||
| Calibration 3 | 224,723 | ||
| ssj_ops@calibrated=224,447 | |||
| 100% | 100.0% | 224,447 | 224,361 |
| 90% | 89.7% | 202,002 | 201,375 |
| 80% | 80.0% | 179,558 | 179,636 |
| 70% | 69.4% | 157,113 | 155,761 |
| 60% | 59.5% | 134,668 | 133,510 |
| 50% | 50.0% | 112,224 | 112,276 |
| 40% | 39.5% | 89,779 | 88,748 |
| 30% | 30.3% | 67,334 | 68,047 |
| 20% | 20.3% | 44,889 | 45,483 |
| 10% | 9.9% | 22,445 | 22,126 |
| Active Idle | 0 | 0 | |

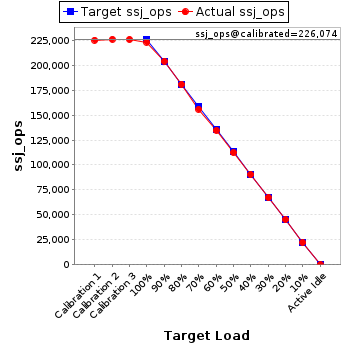
| Target Load | Actual Load | ssj_ops | |
|---|---|---|---|
| Target | Actual | ||
| Calibration 1 | 225,315 | ||
| Calibration 2 | 226,162 | ||
| Calibration 3 | 225,986 | ||
| ssj_ops@calibrated=226,074 | |||
| 100% | 98.8% | 226,074 | 223,268 |
| 90% | 90.3% | 203,466 | 204,161 |
| 80% | 80.0% | 180,859 | 180,903 |
| 70% | 69.0% | 158,252 | 155,979 |
| 60% | 59.6% | 135,644 | 134,661 |
| 50% | 49.7% | 113,037 | 112,462 |
| 40% | 40.0% | 90,429 | 90,404 |
| 30% | 29.8% | 67,822 | 67,319 |
| 20% | 20.0% | 45,215 | 45,293 |
| 10% | 9.9% | 22,607 | 22,409 |
| Active Idle | 0 | 0 | |
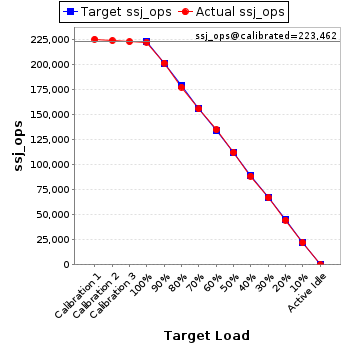
| Target Load | Actual Load | ssj_ops | |
|---|---|---|---|
| Target | Actual | ||
| Calibration 1 | 225,352 | ||
| Calibration 2 | 224,006 | ||
| Calibration 3 | 222,918 | ||
| ssj_ops@calibrated=223,462 | |||
| 100% | 99.6% | 223,462 | 222,501 |
| 90% | 90.2% | 201,116 | 201,596 |
| 80% | 79.5% | 178,770 | 177,547 |
| 70% | 69.7% | 156,423 | 155,689 |
| 60% | 60.4% | 134,077 | 135,058 |
| 50% | 50.2% | 111,731 | 112,202 |
| 40% | 39.6% | 89,385 | 88,512 |
| 30% | 29.9% | 67,039 | 66,926 |
| 20% | 20.0% | 44,692 | 44,594 |
| 10% | 9.9% | 22,346 | 22,170 |
| Active Idle | 0 | 0 | |
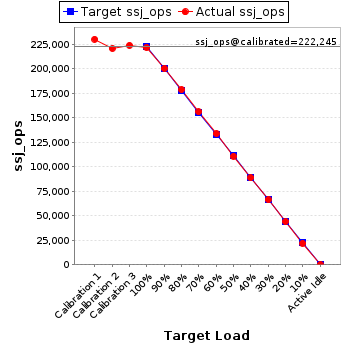
| Target Load | Actual Load | ssj_ops | |
|---|---|---|---|
| Target | Actual | ||
| Calibration 1 | 230,067 | ||
| Calibration 2 | 220,665 | ||
| Calibration 3 | 223,825 | ||
| ssj_ops@calibrated=222,245 | |||
| 100% | 99.7% | 222,245 | 221,586 |
| 90% | 90.1% | 200,020 | 200,273 |
| 80% | 80.4% | 177,796 | 178,747 |
| 70% | 70.2% | 155,571 | 156,017 |
| 60% | 60.2% | 133,347 | 133,784 |
| 50% | 49.8% | 111,122 | 110,747 |
| 40% | 39.9% | 88,898 | 88,667 |
| 30% | 29.8% | 66,673 | 66,285 |
| 20% | 19.8% | 44,449 | 43,903 |
| 10% | 9.8% | 22,224 | 21,820 |
| Active Idle | 0 | 0 | |
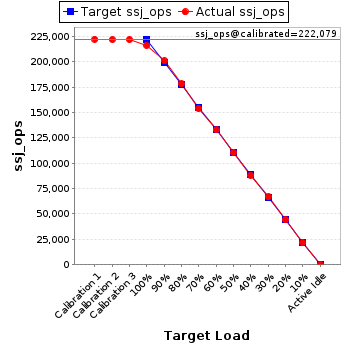
| Target Load | Actual Load | ssj_ops | |
|---|---|---|---|
| Target | Actual | ||
| Calibration 1 | 222,423 | ||
| Calibration 2 | 222,050 | ||
| Calibration 3 | 222,107 | ||
| ssj_ops@calibrated=222,079 | |||
| 100% | 97.4% | 222,079 | 216,366 |
| 90% | 90.6% | 199,871 | 201,180 |
| 80% | 80.3% | 177,663 | 178,299 |
| 70% | 69.4% | 155,455 | 154,101 |
| 60% | 59.9% | 133,247 | 132,918 |
| 50% | 49.8% | 111,039 | 110,526 |
| 40% | 39.8% | 88,831 | 88,332 |
| 30% | 30.1% | 66,624 | 66,900 |
| 20% | 20.0% | 44,416 | 44,309 |
| 10% | 9.8% | 22,208 | 21,712 |
| Active Idle | 0 | 0 | |
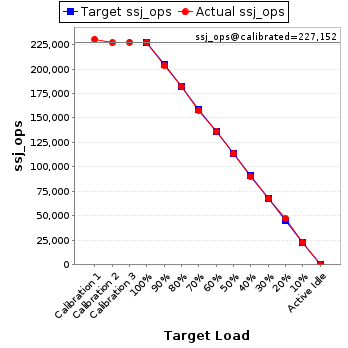
| Target Load | Actual Load | ssj_ops | |
|---|---|---|---|
| Target | Actual | ||
| Calibration 1 | 230,499 | ||
| Calibration 2 | 226,833 | ||
| Calibration 3 | 227,471 | ||
| ssj_ops@calibrated=227,152 | |||
| 100% | 99.9% | 227,152 | 227,025 |
| 90% | 89.6% | 204,437 | 203,505 |
| 80% | 80.2% | 181,721 | 182,185 |
| 70% | 69.4% | 159,006 | 157,678 |
| 60% | 60.1% | 136,291 | 136,474 |
| 50% | 50.0% | 113,576 | 113,525 |
| 40% | 39.7% | 90,861 | 90,196 |
| 30% | 29.8% | 68,146 | 67,702 |
| 20% | 20.7% | 45,430 | 47,131 |
| 10% | 10.0% | 22,715 | 22,822 |
| Active Idle | 0 | 0 | |
| Target Load | Actual Load | ssj_ops | |
|---|---|---|---|
| Target | Actual | ||
| Calibration 1 | 229,379 | ||
| Calibration 2 | 232,060 | ||
| Calibration 3 | 229,466 | ||
| ssj_ops@calibrated=230,763 | |||
| 100% | 98.2% | 230,763 | 226,700 |
| 90% | 90.0% | 207,687 | 207,788 |
| 80% | 80.3% | 184,611 | 185,387 |
| 70% | 70.1% | 161,534 | 161,747 |
| 60% | 59.7% | 138,458 | 137,701 |
| 50% | 49.8% | 115,382 | 114,887 |
| 40% | 40.3% | 92,305 | 92,956 |
| 30% | 30.5% | 69,229 | 70,316 |
| 20% | 20.1% | 46,153 | 46,282 |
| 10% | 10.0% | 23,076 | 23,176 |
| Active Idle | 0 | 0 | |
| Target Load | Actual Load | ssj_ops | |
|---|---|---|---|
| Target | Actual | ||
| Calibration 1 | 225,599 | ||
| Calibration 2 | 219,222 | ||
| Calibration 3 | 215,202 | ||
| ssj_ops@calibrated=217,212 | |||
| 100% | 99.3% | 217,212 | 215,705 |
| 90% | 90.9% | 195,491 | 197,382 |
| 80% | 79.6% | 173,770 | 172,857 |
| 70% | 69.6% | 152,048 | 151,135 |
| 60% | 60.1% | 130,327 | 130,446 |
| 50% | 50.1% | 108,606 | 108,914 |
| 40% | 39.9% | 86,885 | 86,610 |
| 30% | 29.9% | 65,164 | 65,005 |
| 20% | 20.4% | 43,442 | 44,243 |
| 10% | 10.0% | 21,721 | 21,707 |
| Active Idle | 0 | 0 | |

| Target Load | Actual Load | ssj_ops | |
|---|---|---|---|
| Target | Actual | ||
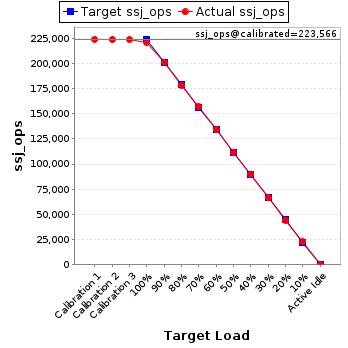
| Calibration 1 | 223,943 | ||
| Calibration 2 | 223,613 | ||
| Calibration 3 | 223,518 | ||
| ssj_ops@calibrated=223,566 | |||
| 100% | 98.7% | 223,566 | 220,671 |
| 90% | 90.0% | 201,209 | 201,266 |
| 80% | 79.8% | 178,853 | 178,422 |
| 70% | 70.1% | 156,496 | 156,782 |
| 60% | 60.0% | 134,139 | 134,077 |
| 50% | 49.6% | 111,783 | 110,999 |
| 40% | 40.3% | 89,426 | 89,999 |
| 30% | 29.7% | 67,070 | 66,384 |
| 20% | 19.7% | 44,713 | 44,078 |
| 10% | 10.2% | 22,357 | 22,766 |
| Active Idle | 0 | 0 | |
| Target Load | Actual Load | ssj_ops | |
|---|---|---|---|
| Target | Actual | ||
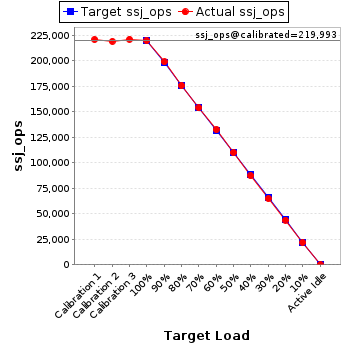
| Calibration 1 | 220,778 | ||
| Calibration 2 | 218,940 | ||
| Calibration 3 | 221,047 | ||
| ssj_ops@calibrated=219,993 | |||
| 100% | 99.8% | 219,993 | 219,631 |
| 90% | 90.4% | 197,994 | 198,831 |
| 80% | 79.8% | 175,995 | 175,575 |
| 70% | 69.9% | 153,995 | 153,714 |
| 60% | 60.3% | 131,996 | 132,610 |
| 50% | 50.0% | 109,997 | 109,962 |
| 40% | 39.6% | 87,997 | 87,041 |
| 30% | 29.5% | 65,998 | 64,791 |
| 20% | 19.9% | 43,999 | 43,786 |
| 10% | 9.9% | 21,999 | 21,874 |
| Active Idle | 0 | 0 | |
| Target Load | Actual Load | ssj_ops | |
|---|---|---|---|
| Target | Actual | ||
| Calibration 1 | 228,961 | ||
| Calibration 2 | 225,334 | ||
| Calibration 3 | 228,611 | ||
| ssj_ops@calibrated=226,972 | |||
| 100% | 99.8% | 226,972 | 226,595 |
| 90% | 90.0% | 204,275 | 204,364 |
| 80% | 80.2% | 181,578 | 181,935 |
| 70% | 69.8% | 158,881 | 158,405 |
| 60% | 59.5% | 136,183 | 135,123 |
| 50% | 49.5% | 113,486 | 112,450 |
| 40% | 40.2% | 90,789 | 91,209 |
| 30% | 29.5% | 68,092 | 66,953 |
| 20% | 20.0% | 45,394 | 45,352 |
| 10% | 9.9% | 22,697 | 22,511 |
| Active Idle | 0 | 0 | |

| Target Load | Actual Load | ssj_ops | |
|---|---|---|---|
| Target | Actual | ||
| Calibration 1 | 228,333 | ||
| Calibration 2 | 226,255 | ||
| Calibration 3 | 227,319 | ||
| ssj_ops@calibrated=226,787 | |||
| 100% | 97.3% | 226,787 | 220,650 |
| 90% | 89.9% | 204,108 | 203,831 |
| 80% | 80.6% | 181,430 | 182,731 |
| 70% | 70.6% | 158,751 | 160,151 |
| 60% | 59.9% | 136,072 | 135,769 |
| 50% | 50.5% | 113,394 | 114,604 |
| 40% | 40.7% | 90,715 | 92,276 |
| 30% | 30.2% | 68,036 | 68,491 |
| 20% | 20.0% | 45,357 | 45,374 |
| 10% | 10.1% | 22,679 | 22,850 |
| Active Idle | 0 | 0 | |

| Target Load | Actual Load | ssj_ops | |
|---|---|---|---|
| Target | Actual | ||
| Calibration 1 | 230,518 | ||
| Calibration 2 | 229,912 | ||
| Calibration 3 | 231,215 | ||
| ssj_ops@calibrated=230,564 | |||
| 100% | 97.2% | 230,564 | 224,004 |
| 90% | 90.3% | 207,507 | 208,221 |
| 80% | 80.4% | 184,451 | 185,444 |
| 70% | 70.7% | 161,394 | 162,988 |
| 60% | 60.3% | 138,338 | 139,096 |
| 50% | 50.0% | 115,282 | 115,270 |
| 40% | 40.0% | 92,225 | 92,295 |
| 30% | 30.2% | 69,169 | 69,729 |
| 20% | 20.0% | 46,113 | 46,119 |
| 10% | 10.1% | 23,056 | 23,386 |
| Active Idle | 0 | 0 | |

| Target Load | Actual Load | ssj_ops | |
|---|---|---|---|
| Target | Actual | ||
| Calibration 1 | 229,182 | ||
| Calibration 2 | 228,527 | ||
| Calibration 3 | 227,004 | ||
| ssj_ops@calibrated=227,766 | |||
| 100% | 100.1% | 227,766 | 227,987 |
| 90% | 90.0% | 204,989 | 204,982 |
| 80% | 79.7% | 182,213 | 181,636 |
| 70% | 69.6% | 159,436 | 158,577 |
| 60% | 60.2% | 136,659 | 137,156 |
| 50% | 49.6% | 113,883 | 112,948 |
| 40% | 40.3% | 91,106 | 91,782 |
| 30% | 30.1% | 68,330 | 68,540 |
| 20% | 20.4% | 45,553 | 46,354 |
| 10% | 10.0% | 22,777 | 22,808 |
| Active Idle | 0 | 0 | |

| Target Load | Actual Load | ssj_ops | |
|---|---|---|---|
| Target | Actual | ||
| Calibration 1 | 223,074 | ||
| Calibration 2 | 220,665 | ||
| Calibration 3 | 221,947 | ||
| ssj_ops@calibrated=221,306 | |||
| 100% | 99.9% | 221,306 | 221,185 |
| 90% | 89.7% | 199,176 | 198,533 |
| 80% | 80.4% | 177,045 | 178,028 |
| 70% | 70.5% | 154,914 | 155,993 |
| 60% | 59.9% | 132,784 | 132,497 |
| 50% | 50.2% | 110,653 | 111,024 |
| 40% | 40.0% | 88,523 | 88,561 |
| 30% | 30.4% | 66,392 | 67,217 |
| 20% | 20.2% | 44,261 | 44,695 |
| 10% | 10.0% | 22,131 | 22,025 |
| Active Idle | 0 | 0 | |

| Target Load | Actual Load | ssj_ops | |
|---|---|---|---|
| Target | Actual | ||
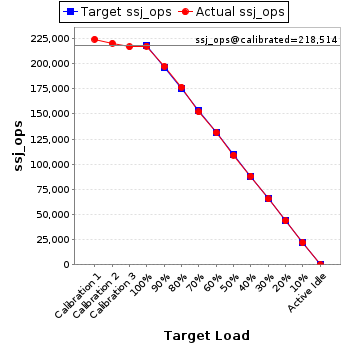
| Calibration 1 | 224,311 | ||
| Calibration 2 | 220,353 | ||
| Calibration 3 | 216,674 | ||
| ssj_ops@calibrated=218,514 | |||
| 100% | 99.6% | 218,514 | 217,541 |
| 90% | 90.3% | 196,662 | 197,346 |
| 80% | 80.8% | 174,811 | 176,629 |
| 70% | 69.5% | 152,960 | 151,922 |
| 60% | 60.1% | 131,108 | 131,402 |
| 50% | 49.9% | 109,257 | 109,020 |
| 40% | 40.4% | 87,405 | 88,186 |
| 30% | 29.9% | 65,554 | 65,368 |
| 20% | 20.0% | 43,703 | 43,671 |
| 10% | 10.1% | 21,851 | 22,041 |
| Active Idle | 0 | 0 | |
| Target Load | Actual Load | ssj_ops | |
|---|---|---|---|
| Target | Actual | ||
| Calibration 1 | 227,583 | ||
| Calibration 2 | 226,479 | ||
| Calibration 3 | 226,555 | ||
| ssj_ops@calibrated=226,517 | |||
| 100% | 99.4% | 226,517 | 225,090 |
| 90% | 89.9% | 203,865 | 203,742 |
| 80% | 80.1% | 181,214 | 181,356 |
| 70% | 70.3% | 158,562 | 159,203 |
| 60% | 60.1% | 135,910 | 136,202 |
| 50% | 49.8% | 113,259 | 112,865 |
| 40% | 40.2% | 90,607 | 90,982 |
| 30% | 29.8% | 67,955 | 67,447 |
| 20% | 19.9% | 45,303 | 45,057 |
| 10% | 10.2% | 22,652 | 23,011 |
| Active Idle | 0 | 0 | |
