| Target Load |
Actual Load |
ssj_ops |
| Target |
Actual |
| Calibration 1 |
|
|
6,149,396 |
| Calibration 2 |
|
|
6,138,276 |
| Calibration 3 |
|
|
6,139,021 |
| ssj_ops@calibrated=6,138,649 |
| 100% |
99.6% |
6,138,649 |
6,114,552 |
| 90% |
89.9% |
5,524,784 |
5,520,918 |
| 80% |
79.4% |
4,910,919 |
4,875,441 |
| 70% |
69.8% |
4,297,054 |
4,287,820 |
| 60% |
59.8% |
3,683,189 |
3,672,211 |
| 50% |
50.0% |
3,069,324 |
3,069,128 |
| 40% |
40.0% |
2,455,459 |
2,453,590 |
| 30% |
30.0% |
1,841,595 |
1,839,277 |
| 20% |
20.0% |
1,227,730 |
1,229,720 |
| 10% |
10.0% |
613,865 |
613,931 |
| Active Idle |
|
0 |
0 |
| Hardware |
| Hardware Vendor: |
Lenovo Global Technology |
| Model: |
ThinkSystem SR655 |
| Form Factor: |
2U |
| CPU Name: |
AMD EPYC 7763 2.45GHz |
| CPU Characteristics: |
64-Core, 2.45GHz, 256MB L3 Cache |
| CPU Frequency (MHz): |
2450 |
| CPU(s) Enabled: |
64 cores, 1 chip, 64 cores/chip |
| Hardware Threads: |
128 (2 / core) |
| CPU(s) Orderable: |
1 chips |
| Primary Cache: |
32 KB I + 32 KB D on chip per core |
| Secondary Cache: |
512 KB I+D on chip per core |
| Tertiary Cache: |
256 MB I+D on chip per chip |
| Other Cache: |
None |
| Memory Amount (GB): |
128 |
| # and size of DIMM: |
8 x 16384 MB |
| Memory Details: |
8 x 16GB 2Rx8 PC4-3200AA-RE2-12; slots 1, 3, 5, 7, 10, 12, 14, and 16 populated |
| Power Supply Quantity and Rating (W): |
1 x 750 |
| Power Supply Details: |
Lenovo P/N:7N67A00883 |
| Disk Drive: |
1 x 128GB M.2 SSD P/N:7N47A00130 M.2 Module P/N:4Y37A09738 |
| Disk Controller: |
Integrated SATA controller |
| # and type of Network Interface Cards (NICs) Installed: |
1 x ThinkSystem Broadcom 1GbE 2-Port Ethernet Adapter P/N:7ZT7A00482 |
| NICs Enabled in Firmware / OS / Connected: |
2/2/1 |
| Network Speed (Mbit): |
1000 |
| Keyboard: |
None |
| Mouse: |
None |
| Monitor: |
None |
| Optical Drives: |
No |
| Other Hardware: |
Test using the performance fan module P/N:4F17A14484 |
| JVM Instance |
ssj_ops@100% |
| localhost.001 |
194,961 |
| localhost.002 |
190,187 |
| localhost.003 |
192,826 |
| localhost.004 |
190,146 |
| localhost.005 |
188,394 |
| localhost.006 |
187,902 |
| localhost.007 |
193,315 |
| localhost.008 |
189,613 |
| localhost.009 |
193,683 |
| localhost.010 |
193,219 |
| localhost.011 |
188,248 |
| localhost.012 |
188,674 |
| localhost.013 |
188,165 |
| localhost.014 |
192,026 |
| localhost.015 |
194,218 |
| localhost.016 |
189,546 |
| localhost.017 |
194,589 |
| localhost.018 |
194,089 |
| localhost.019 |
191,515 |
| localhost.020 |
186,627 |
| localhost.021 |
194,770 |
| localhost.022 |
188,303 |
| localhost.023 |
192,228 |
| localhost.024 |
186,517 |
| localhost.025 |
193,825 |
| localhost.026 |
193,749 |
| localhost.027 |
193,591 |
| localhost.028 |
191,746 |
| localhost.029 |
195,173 |
| localhost.030 |
193,213 |
| localhost.031 |
185,320 |
| localhost.032 |
184,173 |
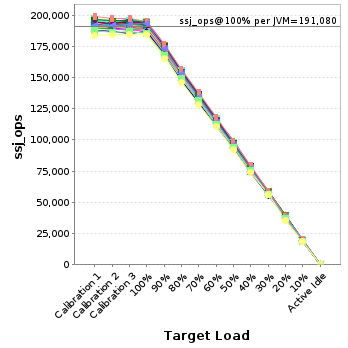
| ssj_ops@100% |
6,114,552 |
| ssj_ops@100% per JVM |
191,080 |
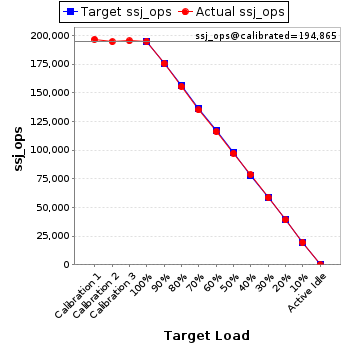
JVM 'localhost.001' Scores:
| Target Load |
Actual Load |
ssj_ops |
| Target |
Actual |
| Calibration 1 |
|
|
196,599 |
| Calibration 2 |
|
|
194,541 |
| Calibration 3 |
|
|
195,188 |
| ssj_ops@calibrated=194,865 |
| 100% |
100.0% |
194,865 |
194,961 |
| 90% |
90.1% |
175,378 |
175,501 |
| 80% |
79.7% |
155,892 |
155,399 |
| 70% |
69.3% |
136,405 |
134,977 |
| 60% |
59.5% |
116,919 |
116,017 |
| 50% |
49.9% |
97,432 |
97,301 |
| 40% |
40.4% |
77,946 |
78,657 |
| 30% |
30.1% |
58,459 |
58,647 |
| 20% |
20.0% |
38,973 |
39,047 |
| 10% |
10.1% |
19,486 |
19,594 |
| Active Idle |
|
0 |
0 |
JVM 'localhost.002' Scores:
| Target Load |
Actual Load |
ssj_ops |
| Target |
Actual |
| Calibration 1 |
|
|
190,756 |
| Calibration 2 |
|
|
191,389 |
| Calibration 3 |
|
|
191,773 |
| ssj_ops@calibrated=191,581 |
| 100% |
99.3% |
191,581 |
190,187 |
| 90% |
89.7% |
172,423 |
171,885 |
| 80% |
79.3% |
153,265 |
151,872 |
| 70% |
70.1% |
134,107 |
134,280 |
| 60% |
60.3% |
114,948 |
115,467 |
| 50% |
50.5% |
95,790 |
96,729 |
| 40% |
40.0% |
76,632 |
76,676 |
| 30% |
30.1% |
57,474 |
57,716 |
| 20% |
20.2% |
38,316 |
38,747 |
| 10% |
10.0% |
19,158 |
19,211 |
| Active Idle |
|
0 |
0 |
JVM 'localhost.003' Scores:
| Target Load |
Actual Load |
ssj_ops |
| Target |
Actual |
| Calibration 1 |
|
|
194,793 |
| Calibration 2 |
|
|
193,823 |
| Calibration 3 |
|
|
193,666 |
| ssj_ops@calibrated=193,745 |
| 100% |
99.5% |
193,745 |
192,826 |
| 90% |
90.1% |
174,370 |
174,540 |
| 80% |
79.1% |
154,996 |
153,272 |
| 70% |
70.2% |
135,621 |
135,999 |
| 60% |
60.2% |
116,247 |
116,633 |
| 50% |
49.6% |
96,872 |
96,060 |
| 40% |
39.9% |
77,498 |
77,213 |
| 30% |
29.7% |
58,123 |
57,565 |
| 20% |
20.1% |
38,749 |
38,872 |
| 10% |
10.2% |
19,374 |
19,802 |
| Active Idle |
|
0 |
0 |
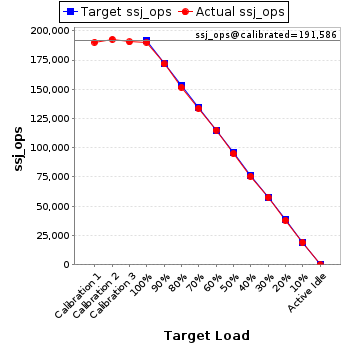
JVM 'localhost.004' Scores:
| Target Load |
Actual Load |
ssj_ops |
| Target |
Actual |
| Calibration 1 |
|
|
190,301 |
| Calibration 2 |
|
|
192,755 |
| Calibration 3 |
|
|
190,417 |
| ssj_ops@calibrated=191,586 |
| 100% |
99.2% |
191,586 |
190,146 |
| 90% |
89.6% |
172,428 |
171,631 |
| 80% |
79.2% |
153,269 |
151,749 |
| 70% |
69.8% |
134,110 |
133,781 |
| 60% |
60.1% |
114,952 |
115,094 |
| 50% |
49.6% |
95,793 |
94,977 |
| 40% |
39.5% |
76,634 |
75,609 |
| 30% |
30.1% |
57,476 |
57,696 |
| 20% |
19.8% |
38,317 |
38,004 |
| 10% |
10.0% |
19,159 |
19,180 |
| Active Idle |
|
0 |
0 |
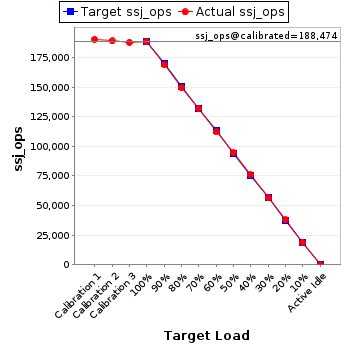
JVM 'localhost.005' Scores:
| Target Load |
Actual Load |
ssj_ops |
| Target |
Actual |
| Calibration 1 |
|
|
190,400 |
| Calibration 2 |
|
|
188,933 |
| Calibration 3 |
|
|
188,014 |
| ssj_ops@calibrated=188,474 |
| 100% |
100.0% |
188,474 |
188,394 |
| 90% |
89.7% |
169,626 |
169,011 |
| 80% |
79.4% |
150,779 |
149,656 |
| 70% |
70.1% |
131,931 |
132,192 |
| 60% |
59.5% |
113,084 |
112,190 |
| 50% |
50.2% |
94,237 |
94,622 |
| 40% |
40.2% |
75,389 |
75,770 |
| 30% |
29.9% |
56,542 |
56,325 |
| 20% |
20.1% |
37,695 |
37,821 |
| 10% |
10.0% |
18,847 |
18,801 |
| Active Idle |
|
0 |
0 |
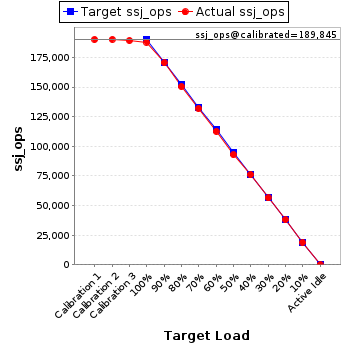
JVM 'localhost.006' Scores:
| Target Load |
Actual Load |
ssj_ops |
| Target |
Actual |
| Calibration 1 |
|
|
190,250 |
| Calibration 2 |
|
|
190,325 |
| Calibration 3 |
|
|
189,365 |
| ssj_ops@calibrated=189,845 |
| 100% |
99.0% |
189,845 |
187,902 |
| 90% |
89.8% |
170,860 |
170,528 |
| 80% |
79.2% |
151,876 |
150,423 |
| 70% |
69.6% |
132,891 |
132,075 |
| 60% |
59.4% |
113,907 |
112,674 |
| 50% |
49.0% |
94,922 |
92,970 |
| 40% |
40.1% |
75,938 |
76,080 |
| 30% |
29.7% |
56,953 |
56,400 |
| 20% |
20.0% |
37,969 |
38,026 |
| 10% |
10.0% |
18,984 |
18,975 |
| Active Idle |
|
0 |
0 |
JVM 'localhost.007' Scores:
| Target Load |
Actual Load |
ssj_ops |
| Target |
Actual |
| Calibration 1 |
|
|
192,275 |
| Calibration 2 |
|
|
193,935 |
| Calibration 3 |
|
|
193,879 |
| ssj_ops@calibrated=193,907 |
| 100% |
99.7% |
193,907 |
193,315 |
| 90% |
90.3% |
174,516 |
175,082 |
| 80% |
79.7% |
155,125 |
154,471 |
| 70% |
70.1% |
135,735 |
135,945 |
| 60% |
60.0% |
116,344 |
116,430 |
| 50% |
49.8% |
96,953 |
96,639 |
| 40% |
40.2% |
77,563 |
77,859 |
| 30% |
29.6% |
58,172 |
57,469 |
| 20% |
19.8% |
38,781 |
38,449 |
| 10% |
9.9% |
19,391 |
19,212 |
| Active Idle |
|
0 |
0 |
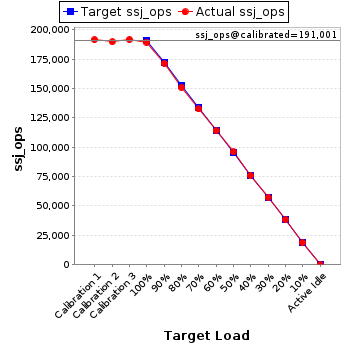
JVM 'localhost.008' Scores:
| Target Load |
Actual Load |
ssj_ops |
| Target |
Actual |
| Calibration 1 |
|
|
191,858 |
| Calibration 2 |
|
|
189,925 |
| Calibration 3 |
|
|
192,077 |
| ssj_ops@calibrated=191,001 |
| 100% |
99.3% |
191,001 |
189,613 |
| 90% |
89.8% |
171,901 |
171,585 |
| 80% |
79.2% |
152,801 |
151,236 |
| 70% |
69.4% |
133,701 |
132,641 |
| 60% |
59.9% |
114,601 |
114,374 |
| 50% |
50.3% |
95,501 |
96,013 |
| 40% |
39.9% |
76,400 |
76,171 |
| 30% |
30.1% |
57,300 |
57,530 |
| 20% |
20.1% |
38,200 |
38,387 |
| 10% |
9.9% |
19,100 |
18,878 |
| Active Idle |
|
0 |
0 |
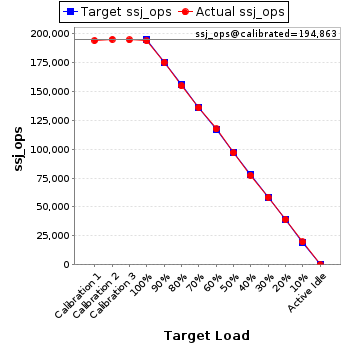
JVM 'localhost.009' Scores:
| Target Load |
Actual Load |
ssj_ops |
| Target |
Actual |
| Calibration 1 |
|
|
194,071 |
| Calibration 2 |
|
|
195,174 |
| Calibration 3 |
|
|
194,553 |
| ssj_ops@calibrated=194,863 |
| 100% |
99.4% |
194,863 |
193,683 |
| 90% |
90.0% |
175,377 |
175,283 |
| 80% |
79.4% |
155,891 |
154,782 |
| 70% |
69.8% |
136,404 |
135,982 |
| 60% |
60.3% |
116,918 |
117,462 |
| 50% |
49.8% |
97,432 |
96,969 |
| 40% |
39.7% |
77,945 |
77,274 |
| 30% |
30.0% |
58,459 |
58,445 |
| 20% |
20.2% |
38,973 |
39,290 |
| 10% |
10.1% |
19,486 |
19,633 |
| Active Idle |
|
0 |
0 |
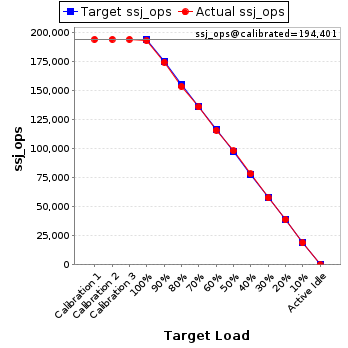
JVM 'localhost.010' Scores:
| Target Load |
Actual Load |
ssj_ops |
| Target |
Actual |
| Calibration 1 |
|
|
194,376 |
| Calibration 2 |
|
|
194,395 |
| Calibration 3 |
|
|
194,408 |
| ssj_ops@calibrated=194,401 |
| 100% |
99.4% |
194,401 |
193,219 |
| 90% |
89.9% |
174,961 |
174,715 |
| 80% |
79.1% |
155,521 |
153,729 |
| 70% |
70.0% |
136,081 |
136,049 |
| 60% |
59.7% |
116,641 |
116,025 |
| 50% |
50.5% |
97,201 |
98,128 |
| 40% |
40.3% |
77,760 |
78,289 |
| 30% |
29.7% |
58,320 |
57,694 |
| 20% |
20.1% |
38,880 |
39,075 |
| 10% |
9.8% |
19,440 |
19,060 |
| Active Idle |
|
0 |
0 |
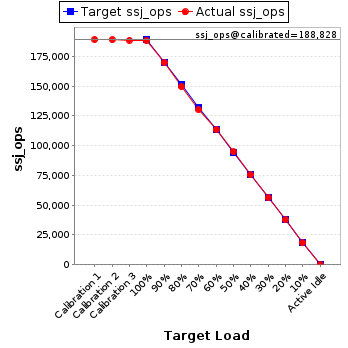
JVM 'localhost.011' Scores:
| Target Load |
Actual Load |
ssj_ops |
| Target |
Actual |
| Calibration 1 |
|
|
189,313 |
| Calibration 2 |
|
|
189,071 |
| Calibration 3 |
|
|
188,584 |
| ssj_ops@calibrated=188,828 |
| 100% |
99.7% |
188,828 |
188,248 |
| 90% |
89.9% |
169,945 |
169,846 |
| 80% |
79.3% |
151,062 |
149,682 |
| 70% |
69.1% |
132,179 |
130,485 |
| 60% |
60.2% |
113,297 |
113,677 |
| 50% |
50.2% |
94,414 |
94,856 |
| 40% |
39.9% |
75,531 |
75,387 |
| 30% |
29.9% |
56,648 |
56,434 |
| 20% |
19.9% |
37,766 |
37,622 |
| 10% |
9.7% |
18,883 |
18,295 |
| Active Idle |
|
0 |
0 |
JVM 'localhost.012' Scores:
| Target Load |
Actual Load |
ssj_ops |
| Target |
Actual |
| Calibration 1 |
|
|
190,004 |
| Calibration 2 |
|
|
189,808 |
| Calibration 3 |
|
|
190,085 |
| ssj_ops@calibrated=189,947 |
| 100% |
99.3% |
189,947 |
188,674 |
| 90% |
90.1% |
170,952 |
171,118 |
| 80% |
79.0% |
151,957 |
150,049 |
| 70% |
69.9% |
132,963 |
132,702 |
| 60% |
59.6% |
113,968 |
113,251 |
| 50% |
50.0% |
94,973 |
95,022 |
| 40% |
40.3% |
75,979 |
76,594 |
| 30% |
30.0% |
56,984 |
56,898 |
| 20% |
20.1% |
37,989 |
38,192 |
| 10% |
10.3% |
18,995 |
19,517 |
| Active Idle |
|
0 |
0 |
JVM 'localhost.013' Scores:
| Target Load |
Actual Load |
ssj_ops |
| Target |
Actual |
| Calibration 1 |
|
|
193,362 |
| Calibration 2 |
|
|
188,936 |
| Calibration 3 |
|
|
190,145 |
| ssj_ops@calibrated=189,541 |
| 100% |
99.3% |
189,541 |
188,165 |
| 90% |
89.7% |
170,587 |
170,098 |
| 80% |
79.3% |
151,632 |
150,278 |
| 70% |
69.5% |
132,678 |
131,665 |
| 60% |
59.7% |
113,724 |
113,236 |
| 50% |
50.2% |
94,770 |
95,144 |
| 40% |
39.4% |
75,816 |
74,715 |
| 30% |
30.4% |
56,862 |
57,631 |
| 20% |
20.1% |
37,908 |
38,163 |
| 10% |
10.1% |
18,954 |
19,207 |
| Active Idle |
|
0 |
0 |
JVM 'localhost.014' Scores:
| Target Load |
Actual Load |
ssj_ops |
| Target |
Actual |
| Calibration 1 |
|
|
190,800 |
| Calibration 2 |
|
|
193,512 |
| Calibration 3 |
|
|
192,664 |
| ssj_ops@calibrated=193,088 |
| 100% |
99.5% |
193,088 |
192,026 |
| 90% |
89.7% |
173,779 |
173,112 |
| 80% |
79.2% |
154,470 |
152,854 |
| 70% |
70.0% |
135,162 |
135,129 |
| 60% |
60.0% |
115,853 |
115,804 |
| 50% |
49.9% |
96,544 |
96,330 |
| 40% |
40.0% |
77,235 |
77,327 |
| 30% |
29.9% |
57,926 |
57,781 |
| 20% |
19.8% |
38,618 |
38,156 |
| 10% |
10.1% |
19,309 |
19,461 |
| Active Idle |
|
0 |
0 |
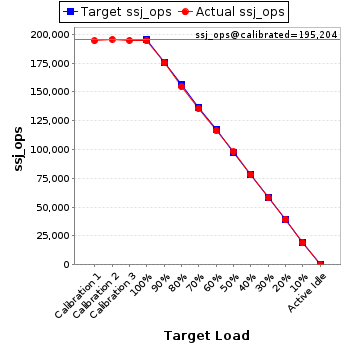
JVM 'localhost.015' Scores:
| Target Load |
Actual Load |
ssj_ops |
| Target |
Actual |
| Calibration 1 |
|
|
194,424 |
| Calibration 2 |
|
|
195,664 |
| Calibration 3 |
|
|
194,744 |
| ssj_ops@calibrated=195,204 |
| 100% |
99.5% |
195,204 |
194,218 |
| 90% |
89.8% |
175,684 |
175,218 |
| 80% |
79.1% |
156,163 |
154,487 |
| 70% |
69.4% |
136,643 |
135,529 |
| 60% |
59.6% |
117,122 |
116,333 |
| 50% |
50.3% |
97,602 |
98,177 |
| 40% |
40.0% |
78,082 |
78,039 |
| 30% |
29.8% |
58,561 |
58,132 |
| 20% |
20.3% |
39,041 |
39,601 |
| 10% |
9.7% |
19,520 |
19,026 |
| Active Idle |
|
0 |
0 |
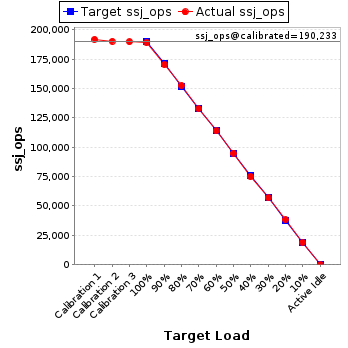
JVM 'localhost.016' Scores:
| Target Load |
Actual Load |
ssj_ops |
| Target |
Actual |
| Calibration 1 |
|
|
192,033 |
| Calibration 2 |
|
|
190,457 |
| Calibration 3 |
|
|
190,008 |
| ssj_ops@calibrated=190,233 |
| 100% |
99.6% |
190,233 |
189,546 |
| 90% |
89.7% |
171,209 |
170,643 |
| 80% |
80.3% |
152,186 |
152,843 |
| 70% |
69.9% |
133,163 |
132,925 |
| 60% |
59.9% |
114,140 |
113,976 |
| 50% |
49.9% |
95,116 |
95,014 |
| 40% |
39.6% |
76,093 |
75,241 |
| 30% |
30.0% |
57,070 |
57,016 |
| 20% |
20.3% |
38,047 |
38,692 |
| 10% |
10.1% |
19,023 |
19,155 |
| Active Idle |
|
0 |
0 |
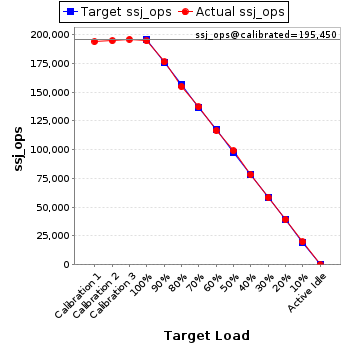
JVM 'localhost.017' Scores:
| Target Load |
Actual Load |
ssj_ops |
| Target |
Actual |
| Calibration 1 |
|
|
194,113 |
| Calibration 2 |
|
|
194,842 |
| Calibration 3 |
|
|
196,059 |
| ssj_ops@calibrated=195,450 |
| 100% |
99.6% |
195,450 |
194,589 |
| 90% |
90.2% |
175,905 |
176,392 |
| 80% |
79.3% |
156,360 |
154,895 |
| 70% |
70.2% |
136,815 |
137,146 |
| 60% |
59.7% |
117,270 |
116,632 |
| 50% |
50.7% |
97,725 |
99,142 |
| 40% |
40.0% |
78,180 |
78,256 |
| 30% |
30.0% |
58,635 |
58,584 |
| 20% |
20.2% |
39,090 |
39,452 |
| 10% |
10.2% |
19,545 |
19,869 |
| Active Idle |
|
0 |
0 |
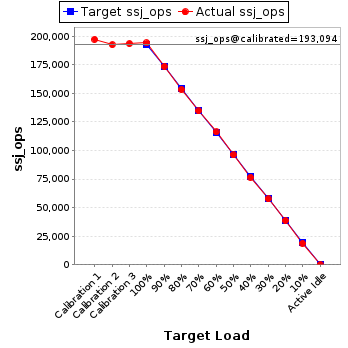
JVM 'localhost.018' Scores:
| Target Load |
Actual Load |
ssj_ops |
| Target |
Actual |
| Calibration 1 |
|
|
197,358 |
| Calibration 2 |
|
|
192,613 |
| Calibration 3 |
|
|
193,575 |
| ssj_ops@calibrated=193,094 |
| 100% |
100.5% |
193,094 |
194,089 |
| 90% |
90.0% |
173,785 |
173,722 |
| 80% |
79.5% |
154,475 |
153,422 |
| 70% |
69.7% |
135,166 |
134,611 |
| 60% |
60.2% |
115,856 |
116,168 |
| 50% |
49.8% |
96,547 |
96,070 |
| 40% |
39.7% |
77,238 |
76,630 |
| 30% |
29.8% |
57,928 |
57,632 |
| 20% |
20.1% |
38,619 |
38,725 |
| 10% |
9.7% |
19,309 |
18,817 |
| Active Idle |
|
0 |
0 |
JVM 'localhost.019' Scores:
| Target Load |
Actual Load |
ssj_ops |
| Target |
Actual |
| Calibration 1 |
|
|
192,492 |
| Calibration 2 |
|
|
191,092 |
| Calibration 3 |
|
|
191,602 |
| ssj_ops@calibrated=191,347 |
| 100% |
100.1% |
191,347 |
191,515 |
| 90% |
90.2% |
172,212 |
172,674 |
| 80% |
79.7% |
153,077 |
152,555 |
| 70% |
70.0% |
133,943 |
133,849 |
| 60% |
59.9% |
114,808 |
114,571 |
| 50% |
50.1% |
95,673 |
95,941 |
| 40% |
40.2% |
76,539 |
76,946 |
| 30% |
30.0% |
57,404 |
57,484 |
| 20% |
20.0% |
38,269 |
38,295 |
| 10% |
10.0% |
19,135 |
19,100 |
| Active Idle |
|
0 |
0 |
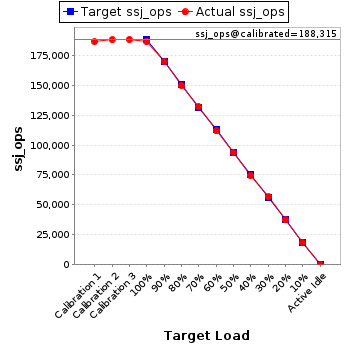
JVM 'localhost.020' Scores:
| Target Load |
Actual Load |
ssj_ops |
| Target |
Actual |
| Calibration 1 |
|
|
186,713 |
| Calibration 2 |
|
|
188,138 |
| Calibration 3 |
|
|
188,492 |
| ssj_ops@calibrated=188,315 |
| 100% |
99.1% |
188,315 |
186,627 |
| 90% |
90.3% |
169,483 |
170,048 |
| 80% |
79.8% |
150,652 |
150,211 |
| 70% |
70.2% |
131,820 |
132,259 |
| 60% |
59.5% |
112,989 |
111,984 |
| 50% |
49.9% |
94,157 |
93,886 |
| 40% |
39.7% |
75,326 |
74,730 |
| 30% |
30.2% |
56,494 |
56,842 |
| 20% |
19.8% |
37,663 |
37,350 |
| 10% |
9.8% |
18,831 |
18,500 |
| Active Idle |
|
0 |
0 |
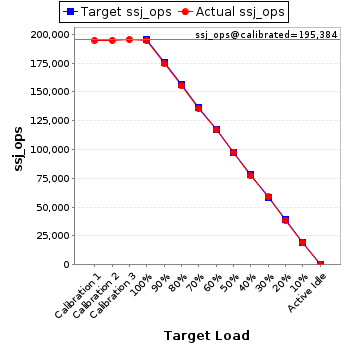
JVM 'localhost.021' Scores:
| Target Load |
Actual Load |
ssj_ops |
| Target |
Actual |
| Calibration 1 |
|
|
194,972 |
| Calibration 2 |
|
|
195,021 |
| Calibration 3 |
|
|
195,747 |
| ssj_ops@calibrated=195,384 |
| 100% |
99.7% |
195,384 |
194,770 |
| 90% |
89.5% |
175,846 |
174,865 |
| 80% |
79.5% |
156,307 |
155,296 |
| 70% |
69.4% |
136,769 |
135,630 |
| 60% |
60.0% |
117,231 |
117,240 |
| 50% |
50.0% |
97,692 |
97,744 |
| 40% |
39.5% |
78,154 |
77,243 |
| 30% |
30.2% |
58,615 |
58,991 |
| 20% |
19.8% |
39,077 |
38,757 |
| 10% |
10.0% |
19,538 |
19,446 |
| Active Idle |
|
0 |
0 |
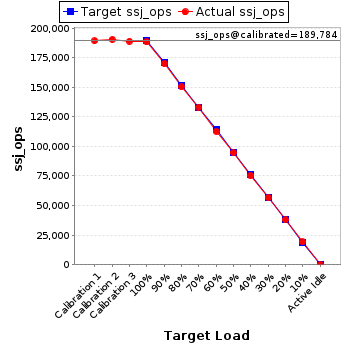
JVM 'localhost.022' Scores:
| Target Load |
Actual Load |
ssj_ops |
| Target |
Actual |
| Calibration 1 |
|
|
189,275 |
| Calibration 2 |
|
|
190,577 |
| Calibration 3 |
|
|
188,992 |
| ssj_ops@calibrated=189,784 |
| 100% |
99.2% |
189,784 |
188,303 |
| 90% |
89.7% |
170,806 |
170,325 |
| 80% |
79.3% |
151,827 |
150,427 |
| 70% |
70.2% |
132,849 |
133,287 |
| 60% |
59.5% |
113,870 |
112,831 |
| 50% |
49.9% |
94,892 |
94,738 |
| 40% |
39.8% |
75,914 |
75,513 |
| 30% |
30.0% |
56,935 |
56,873 |
| 20% |
20.1% |
37,957 |
38,170 |
| 10% |
10.1% |
18,978 |
19,179 |
| Active Idle |
|
0 |
0 |
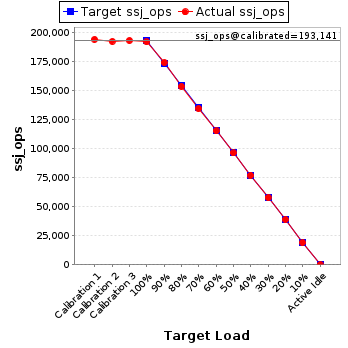
JVM 'localhost.023' Scores:
| Target Load |
Actual Load |
ssj_ops |
| Target |
Actual |
| Calibration 1 |
|
|
194,489 |
| Calibration 2 |
|
|
192,752 |
| Calibration 3 |
|
|
193,531 |
| ssj_ops@calibrated=193,141 |
| 100% |
99.5% |
193,141 |
192,228 |
| 90% |
90.4% |
173,827 |
174,507 |
| 80% |
79.7% |
154,513 |
153,892 |
| 70% |
69.8% |
135,199 |
134,813 |
| 60% |
59.8% |
115,885 |
115,459 |
| 50% |
49.9% |
96,571 |
96,395 |
| 40% |
40.0% |
77,257 |
77,190 |
| 30% |
30.0% |
57,942 |
57,922 |
| 20% |
20.2% |
38,628 |
39,104 |
| 10% |
9.9% |
19,314 |
19,213 |
| Active Idle |
|
0 |
0 |
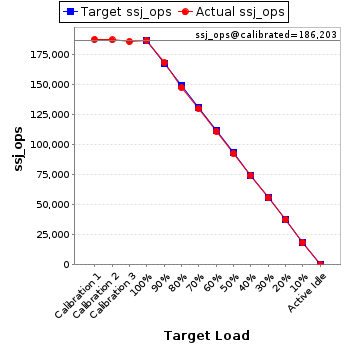
JVM 'localhost.024' Scores:
| Target Load |
Actual Load |
ssj_ops |
| Target |
Actual |
| Calibration 1 |
|
|
187,347 |
| Calibration 2 |
|
|
186,836 |
| Calibration 3 |
|
|
185,571 |
| ssj_ops@calibrated=186,203 |
| 100% |
100.2% |
186,203 |
186,517 |
| 90% |
90.2% |
167,583 |
168,013 |
| 80% |
79.2% |
148,963 |
147,508 |
| 70% |
69.8% |
130,342 |
129,962 |
| 60% |
59.6% |
111,722 |
111,009 |
| 50% |
49.8% |
93,102 |
92,698 |
| 40% |
39.8% |
74,481 |
74,167 |
| 30% |
29.9% |
55,861 |
55,589 |
| 20% |
20.1% |
37,241 |
37,391 |
| 10% |
9.9% |
18,620 |
18,492 |
| Active Idle |
|
0 |
0 |
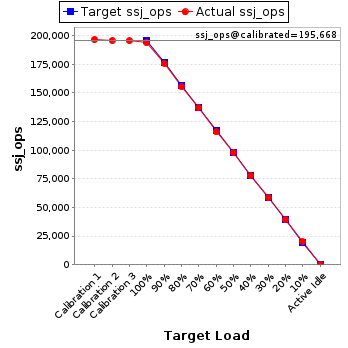
JVM 'localhost.025' Scores:
| Target Load |
Actual Load |
ssj_ops |
| Target |
Actual |
| Calibration 1 |
|
|
196,787 |
| Calibration 2 |
|
|
195,795 |
| Calibration 3 |
|
|
195,541 |
| ssj_ops@calibrated=195,668 |
| 100% |
99.1% |
195,668 |
193,825 |
| 90% |
89.9% |
176,102 |
175,934 |
| 80% |
79.4% |
156,535 |
155,413 |
| 70% |
70.0% |
136,968 |
136,933 |
| 60% |
59.3% |
117,401 |
116,028 |
| 50% |
50.0% |
97,834 |
97,926 |
| 40% |
39.7% |
78,267 |
77,583 |
| 30% |
30.1% |
58,701 |
58,868 |
| 20% |
20.2% |
39,134 |
39,476 |
| 10% |
10.3% |
19,567 |
20,155 |
| Active Idle |
|
0 |
0 |
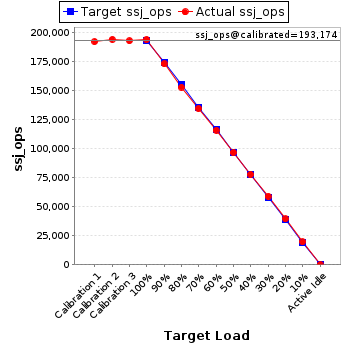
JVM 'localhost.026' Scores:
| Target Load |
Actual Load |
ssj_ops |
| Target |
Actual |
| Calibration 1 |
|
|
191,807 |
| Calibration 2 |
|
|
193,836 |
| Calibration 3 |
|
|
192,512 |
| ssj_ops@calibrated=193,174 |
| 100% |
100.3% |
193,174 |
193,749 |
| 90% |
89.4% |
173,856 |
172,694 |
| 80% |
79.1% |
154,539 |
152,749 |
| 70% |
69.6% |
135,222 |
134,413 |
| 60% |
59.9% |
115,904 |
115,696 |
| 50% |
50.0% |
96,587 |
96,653 |
| 40% |
40.2% |
77,269 |
77,706 |
| 30% |
30.5% |
57,952 |
58,941 |
| 20% |
20.4% |
38,635 |
39,367 |
| 10% |
10.1% |
19,317 |
19,580 |
| Active Idle |
|
0 |
0 |
JVM 'localhost.027' Scores:
| Target Load |
Actual Load |
ssj_ops |
| Target |
Actual |
| Calibration 1 |
|
|
194,166 |
| Calibration 2 |
|
|
193,258 |
| Calibration 3 |
|
|
194,746 |
| ssj_ops@calibrated=194,002 |
| 100% |
99.8% |
194,002 |
193,591 |
| 90% |
90.5% |
174,602 |
175,563 |
| 80% |
79.7% |
155,202 |
154,659 |
| 70% |
70.2% |
135,801 |
136,256 |
| 60% |
60.2% |
116,401 |
116,738 |
| 50% |
49.8% |
97,001 |
96,652 |
| 40% |
40.0% |
77,601 |
77,522 |
| 30% |
29.7% |
58,201 |
57,554 |
| 20% |
20.0% |
38,800 |
38,824 |
| 10% |
10.1% |
19,400 |
19,507 |
| Active Idle |
|
0 |
0 |
JVM 'localhost.028' Scores:
| Target Load |
Actual Load |
ssj_ops |
| Target |
Actual |
| Calibration 1 |
|
|
192,418 |
| Calibration 2 |
|
|
191,044 |
| Calibration 3 |
|
|
192,802 |
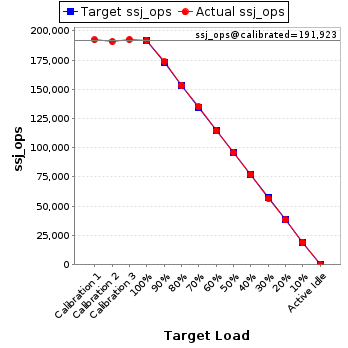
| ssj_ops@calibrated=191,923 |
| 100% |
99.9% |
191,923 |
191,746 |
| 90% |
90.6% |
172,731 |
173,946 |
| 80% |
79.9% |
153,538 |
153,413 |
| 70% |
70.6% |
134,346 |
135,405 |
| 60% |
59.7% |
115,154 |
114,527 |
| 50% |
50.1% |
95,962 |
96,231 |
| 40% |
40.2% |
76,769 |
77,121 |
| 30% |
29.6% |
57,577 |
56,793 |
| 20% |
19.9% |
38,385 |
38,278 |
| 10% |
10.0% |
19,192 |
19,193 |
| Active Idle |
|
0 |
0 |
JVM 'localhost.029' Scores:
| Target Load |
Actual Load |
ssj_ops |
| Target |
Actual |
| Calibration 1 |
|
|
198,904 |
| Calibration 2 |
|
|
197,562 |
| Calibration 3 |
|
|
197,422 |
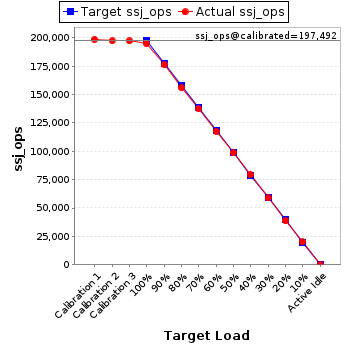
| ssj_ops@calibrated=197,492 |
| 100% |
98.8% |
197,492 |
195,173 |
| 90% |
89.5% |
177,743 |
176,728 |
| 80% |
79.1% |
157,994 |
156,149 |
| 70% |
69.7% |
138,245 |
137,684 |
| 60% |
59.7% |
118,495 |
117,869 |
| 50% |
49.9% |
98,746 |
98,597 |
| 40% |
40.3% |
78,997 |
79,632 |
| 30% |
29.8% |
59,248 |
58,859 |
| 20% |
19.7% |
39,498 |
38,812 |
| 10% |
10.1% |
19,749 |
20,007 |
| Active Idle |
|
0 |
0 |
JVM 'localhost.030' Scores:
| Target Load |
Actual Load |
ssj_ops |
| Target |
Actual |
| Calibration 1 |
|
|
191,940 |
| Calibration 2 |
|
|
191,839 |
| Calibration 3 |
|
|
192,159 |
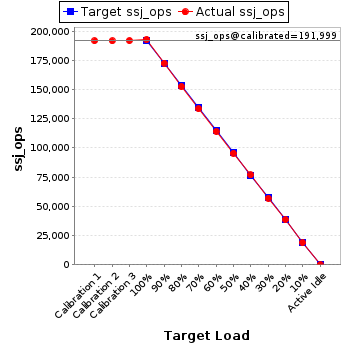
| ssj_ops@calibrated=191,999 |
| 100% |
100.6% |
191,999 |
193,213 |
| 90% |
90.0% |
172,799 |
172,834 |
| 80% |
79.6% |
153,599 |
152,783 |
| 70% |
69.7% |
134,399 |
133,781 |
| 60% |
59.5% |
115,199 |
114,274 |
| 50% |
49.8% |
95,999 |
95,657 |
| 40% |
40.0% |
76,800 |
76,894 |
| 30% |
29.7% |
57,600 |
57,109 |
| 20% |
20.2% |
38,400 |
38,740 |
| 10% |
9.9% |
19,200 |
19,073 |
| Active Idle |
|
0 |
0 |
JVM 'localhost.031' Scores:
| Target Load |
Actual Load |
ssj_ops |
| Target |
Actual |
| Calibration 1 |
|
|
187,270 |
| Calibration 2 |
|
|
186,280 |
| Calibration 3 |
|
|
186,465 |
| ssj_ops@calibrated=186,373 |
| 100% |
99.4% |
186,373 |
185,320 |
| 90% |
90.0% |
167,736 |
167,807 |
| 80% |
80.0% |
149,098 |
149,072 |
| 70% |
70.4% |
130,461 |
131,270 |
| 60% |
60.1% |
111,824 |
111,956 |
| 50% |
50.4% |
93,186 |
93,907 |
| 40% |
40.5% |
74,549 |
75,458 |
| 30% |
30.0% |
55,912 |
55,996 |
| 20% |
19.9% |
37,275 |
37,077 |
| 10% |
9.8% |
18,637 |
18,268 |
| Active Idle |
|
0 |
0 |
JVM 'localhost.032' Scores:
| Target Load |
Actual Load |
ssj_ops |
| Target |
Actual |
| Calibration 1 |
|
|
183,730 |
| Calibration 2 |
|
|
184,151 |
| Calibration 3 |
|
|
184,234 |
| ssj_ops@calibrated=184,192 |
| 100% |
100.0% |
184,192 |
184,173 |
| 90% |
89.6% |
165,773 |
165,073 |
| 80% |
79.4% |
147,354 |
146,216 |
| 70% |
69.6% |
128,935 |
128,162 |
| 60% |
60.0% |
110,515 |
110,588 |
| 50% |
49.9% |
92,096 |
91,940 |
| 40% |
40.2% |
73,677 |
74,098 |
| 30% |
30.3% |
55,258 |
55,862 |
| 20% |
19.4% |
36,838 |
35,758 |
| 10% |
10.1% |
18,419 |
18,526 |
| Active Idle |
|
0 |
0 |