
SPECpower_ssj2008
Host 'node6' Performance Report
Copyright © 2007-2020 Standard Performance Evaluation Corporation
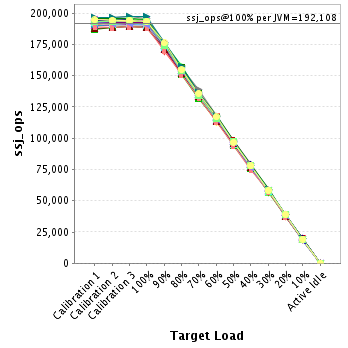
| ASUSTeK Computer Inc. RS620SA-E10-RS12 | ssj_ops@100% = 6,147,463 ssj_ops@100% per JVM = 192,108 |
||||
| Test Sponsor: | ASUSTeK Computer Inc. | SPEC License #: | 9016 | Test Method: | Multi Node |
| Tested By: | ASUSTeK Computer Inc. | Test Location: | Taipei, Taiwan. | Test Date: | Sep 18, 2020 |
| Hardware Availability: | Sep-2020 | Software Availability: | Jul-2020 | Publication: | Oct 7, 2020 |
| System Source: | Single Supplier | System Designation: | Server | Power Provisioning: | Line-powered |
| Target Load | Actual Load | ssj_ops | |
|---|---|---|---|
| Target | Actual | ||
| Calibration 1 | 6,154,854 | ||
| Calibration 2 | 6,161,701 | ||
| Calibration 3 | 6,169,048 | ||
| ssj_ops@calibrated=6,165,374 | |||
| 100% | 99.7% | 6,165,374 | 6,147,463 |
| 90% | 90.1% | 5,548,837 | 5,553,729 |
| 80% | 80.0% | 4,932,300 | 4,932,679 |
| 70% | 69.9% | 4,315,762 | 4,312,457 |
| 60% | 60.0% | 3,699,225 | 3,700,014 |
| 50% | 50.0% | 3,082,687 | 3,080,186 |
| 40% | 40.0% | 2,466,150 | 2,468,085 |
| 30% | 30.0% | 1,849,612 | 1,852,364 |
| 20% | 19.9% | 1,233,075 | 1,228,581 |
| 10% | 10.0% | 616,537 | 617,206 |
| Active Idle | 0 | 0 | |

| Set Identifier: | RS620SA-E10-RS12 |
| Set Description: | System Under Test |
| # of Identical Nodes: | 6 |
| Comment: | 'SUT' |
| Hardware | |
|---|---|
| Hardware Vendor: | ASUSTeK Computer Inc. |
| Model: | RS620SA-E10-RS12 |
| Form Factor: | 1U |
| CPU Name: | AMD EPYC 7742 2.25Ghz |
| CPU Characteristics: | 64-Core, 2.25GHz, 256MB L3 Cache |
| CPU Frequency (MHz): | 2250 |
| CPU(s) Enabled: | 64 cores, 1 chip, 64 cores/chip |
| Hardware Threads: | 128 (2 / core) |
| CPU(s) Orderable: | 1 chip |
| Primary Cache: | 32 KB I + 32 KB D on chip per core |
| Secondary Cache: | 512 KB I+D on chip per core |
| Tertiary Cache: | 256 MB I+D on chip per chip, 16 MB shared / 4 cores |
| Other Cache: | None |
| Memory Amount (GB): | 128 |
| # and size of DIMM: | 8 x 16 GB |
| Memory Details: | 8 x 16GB 2Rx8 PC4-3200AA-R ECC RDIMM; all slots populated |
| Power Supply Quantity and Rating (W): | None |
| Power Supply Details: | Shared |
| Disk Drive: | 1 x 240GB Seagate Nytro 510DCT M.2 PCIE SSD P/N: 03B03-00130200 |
| Disk Controller: | Integrated PCIE controller |
| # and type of Network Interface Cards (NICs) Installed: | 1 x Intel I210 Gigabit Ethernet controller |
| NICs Enabled in Firmware / OS / Connected: | 1/1/1 |
| Network Speed (Mbit): | 1000 |
| Keyboard: | None |
| Mouse: | None |
| Monitor: | None |
| Optical Drives: | No |
| Other Hardware: | None |
| Software | |
|---|---|
| Power Management: | Enabled(See SUT Notes) |
| Operating System (OS): | Suse Linux Enterprise Server 15 SP1 |
| OS Version: | 4.12.14-195-default |
| Filesystem: | xfs |
| JVM Vendor: | Oracle |
| JVM Version: | Java HotSpot(TM) 64-Bit Server VM (build 14.0.2+12-46, mixed mode, sharing), version 14.0.2 |
| JVM Command-line Options: | -server -Xmn1200m -Xms1400m -Xmx1400m -XX:MaxTenuringThreshold=1 -XX:ParallelGCThreads=2 -XX:InlineSmallCode=4000 -XX:MaxInlineSize=300 -XX:FreqInlineSize=3000 -XX:+UseParallelGC -XX:+UseLargePages -XX:+UseHugeTLBFS -XX:+UseTransparentHugePages |
| JVM Affinity: | for each two physicalCores { numactl -C physicalCoreId, physicalCoreId + 1, physicalCoreId + 64, physicalCoreId + 65 -l } |
| JVM Instances: | 32 |
| JVM Initial Heap (MB): | 1400 |
| JVM Maximum Heap (MB): | 1400 |
| JVM Address Bits: | 64 |
| Boot Firmware Version: | 0305 |
| Management Firmware Version: | 2.1.09 |
| Workload Version: | SSJ 1.2.10 |
| Director Location: | Controller |
| Other Software: | None |
| JVM Instance | ssj_ops@100% |
|---|---|
| node6.001 | 193,924 |
| node6.002 | 190,412 |
| node6.003 | 190,802 |
| node6.004 | 190,671 |
| node6.005 | 192,291 |
| node6.006 | 193,279 |
| node6.007 | 194,131 |
| node6.008 | 195,717 |
| node6.009 | 193,242 |
| node6.010 | 189,073 |
| node6.011 | 188,358 |
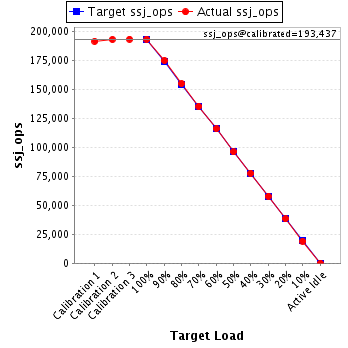
| node6.012 | 193,489 |
| node6.013 | 190,450 |
| node6.014 | 191,436 |
| node6.015 | 192,036 |
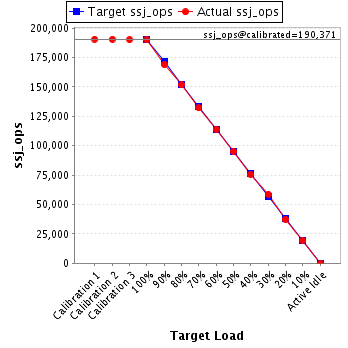
| node6.016 | 189,973 |
| node6.017 | 191,870 |
| node6.018 | 194,297 |
| node6.019 | 192,828 |
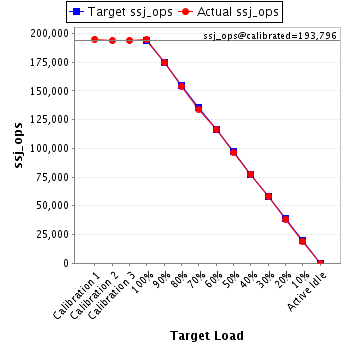
| node6.020 | 194,385 |
| node6.021 | 190,346 |
| node6.022 | 189,856 |
| node6.023 | 188,908 |
| node6.024 | 192,838 |
| node6.025 | 194,911 |
| node6.026 | 192,010 |
| node6.027 | 192,568 |
| node6.028 | 197,458 |
| node6.029 | 188,140 |
| node6.030 | 190,580 |
| node6.031 | 193,658 |
| node6.032 | 193,528 |
| ssj_ops@100% | 6,147,463 |
| ssj_ops@100% per JVM | 192,108 |
| Target Load | Actual Load | ssj_ops | |
|---|---|---|---|
| Target | Actual | ||
| Calibration 1 | 192,703 | ||
| Calibration 2 | 194,141 | ||
| Calibration 3 | 194,434 | ||
| ssj_ops@calibrated=194,287 | |||
| 100% | 99.8% | 194,287 | 193,924 |
| 90% | 90.2% | 174,859 | 175,290 |
| 80% | 80.4% | 155,430 | 156,150 |
| 70% | 70.2% | 136,001 | 136,451 |
| 60% | 60.4% | 116,572 | 117,398 |
| 50% | 50.1% | 97,144 | 97,246 |
| 40% | 39.4% | 77,715 | 76,573 |
| 30% | 29.9% | 58,286 | 58,122 |
| 20% | 20.1% | 38,857 | 39,080 |
| 10% | 10.3% | 19,429 | 19,929 |
| Active Idle | 0 | 0 | |

| Target Load | Actual Load | ssj_ops | |
|---|---|---|---|
| Target | Actual | ||
| Calibration 1 | 191,080 | ||
| Calibration 2 | 190,466 | ||
| Calibration 3 | 190,710 | ||
| ssj_ops@calibrated=190,588 | |||
| 100% | 99.9% | 190,588 | 190,412 |
| 90% | 90.5% | 171,529 | 172,525 |
| 80% | 80.1% | 152,470 | 152,566 |
| 70% | 70.4% | 133,412 | 134,121 |
| 60% | 59.9% | 114,353 | 114,141 |
| 50% | 50.3% | 95,294 | 95,936 |
| 40% | 39.8% | 76,235 | 75,918 |
| 30% | 30.0% | 57,176 | 57,085 |
| 20% | 19.9% | 38,118 | 37,895 |
| 10% | 10.2% | 19,059 | 19,403 |
| Active Idle | 0 | 0 | |

| Target Load | Actual Load | ssj_ops | |
|---|---|---|---|
| Target | Actual | ||
| Calibration 1 | 191,800 | ||
| Calibration 2 | 190,767 | ||
| Calibration 3 | 191,017 | ||
| ssj_ops@calibrated=190,892 | |||
| 100% | 100.0% | 190,892 | 190,802 |
| 90% | 90.7% | 171,803 | 173,202 |
| 80% | 80.0% | 152,714 | 152,769 |
| 70% | 70.2% | 133,624 | 133,933 |
| 60% | 60.6% | 114,535 | 115,730 |
| 50% | 49.7% | 95,446 | 94,783 |
| 40% | 40.2% | 76,357 | 76,728 |
| 30% | 29.8% | 57,268 | 56,852 |
| 20% | 19.8% | 38,178 | 37,709 |
| 10% | 10.1% | 19,089 | 19,190 |
| Active Idle | 0 | 0 | |

| Target Load | Actual Load | ssj_ops | |
|---|---|---|---|
| Target | Actual | ||
| Calibration 1 | 191,089 | ||
| Calibration 2 | 191,413 | ||
| Calibration 3 | 191,601 | ||
| ssj_ops@calibrated=191,507 | |||
| 100% | 99.6% | 191,507 | 190,671 |
| 90% | 90.1% | 172,356 | 172,471 |
| 80% | 80.0% | 153,206 | 153,221 |
| 70% | 69.5% | 134,055 | 133,189 |
| 60% | 58.8% | 114,904 | 112,691 |
| 50% | 50.1% | 95,754 | 95,998 |
| 40% | 39.4% | 76,603 | 75,461 |
| 30% | 29.9% | 57,452 | 57,200 |
| 20% | 20.0% | 38,301 | 38,316 |
| 10% | 10.3% | 19,151 | 19,652 |
| Active Idle | 0 | 0 | |

| Target Load | Actual Load | ssj_ops | |
|---|---|---|---|
| Target | Actual | ||
| Calibration 1 | 192,488 | ||
| Calibration 2 | 193,041 | ||
| Calibration 3 | 193,396 | ||
| ssj_ops@calibrated=193,219 | |||
| 100% | 99.5% | 193,219 | 192,291 |
| 90% | 89.8% | 173,897 | 173,490 |
| 80% | 80.0% | 154,575 | 154,670 |
| 70% | 70.1% | 135,253 | 135,439 |
| 60% | 59.9% | 115,931 | 115,657 |
| 50% | 49.7% | 96,609 | 95,970 |
| 40% | 40.2% | 77,287 | 77,635 |
| 30% | 29.6% | 57,966 | 57,287 |
| 20% | 19.8% | 38,644 | 38,181 |
| 10% | 9.8% | 19,322 | 18,911 |
| Active Idle | 0 | 0 | |

| Target Load | Actual Load | ssj_ops | |
|---|---|---|---|
| Target | Actual | ||
| Calibration 1 | 194,198 | ||
| Calibration 2 | 193,987 | ||
| Calibration 3 | 193,268 | ||
| ssj_ops@calibrated=193,628 | |||
| 100% | 99.8% | 193,628 | 193,279 |
| 90% | 90.1% | 174,265 | 174,466 |
| 80% | 79.9% | 154,902 | 154,739 |
| 70% | 70.6% | 135,539 | 136,687 |
| 60% | 60.2% | 116,177 | 116,481 |
| 50% | 49.6% | 96,814 | 95,997 |
| 40% | 39.2% | 77,451 | 75,935 |
| 30% | 30.2% | 58,088 | 58,414 |
| 20% | 20.2% | 38,726 | 39,050 |
| 10% | 10.0% | 19,363 | 19,396 |
| Active Idle | 0 | 0 | |

| Target Load | Actual Load | ssj_ops | |
|---|---|---|---|
| Target | Actual | ||
| Calibration 1 | 195,154 | ||
| Calibration 2 | 194,652 | ||
| Calibration 3 | 194,914 | ||
| ssj_ops@calibrated=194,783 | |||
| 100% | 99.7% | 194,783 | 194,131 |
| 90% | 90.0% | 175,304 | 175,318 |
| 80% | 79.6% | 155,826 | 155,101 |
| 70% | 70.0% | 136,348 | 136,261 |
| 60% | 59.6% | 116,870 | 116,050 |
| 50% | 50.3% | 97,391 | 98,021 |
| 40% | 40.4% | 77,913 | 78,742 |
| 30% | 30.0% | 58,435 | 58,413 |
| 20% | 20.1% | 38,957 | 39,213 |
| 10% | 9.9% | 19,478 | 19,232 |
| Active Idle | 0 | 0 | |

| Target Load | Actual Load | ssj_ops | |
|---|---|---|---|
| Target | Actual | ||
| Calibration 1 | 196,744 | ||
| Calibration 2 | 196,850 | ||
| Calibration 3 | 197,022 | ||
| ssj_ops@calibrated=196,936 | |||
| 100% | 99.4% | 196,936 | 195,717 |
| 90% | 89.7% | 177,243 | 176,580 |
| 80% | 79.5% | 157,549 | 156,548 |
| 70% | 70.7% | 137,855 | 139,190 |
| 60% | 60.0% | 118,162 | 118,138 |
| 50% | 49.9% | 98,468 | 98,335 |
| 40% | 40.4% | 78,775 | 79,493 |
| 30% | 30.0% | 59,081 | 59,105 |
| 20% | 19.9% | 39,387 | 39,102 |
| 10% | 10.0% | 19,694 | 19,759 |
| Active Idle | 0 | 0 | |

| Target Load | Actual Load | ssj_ops | |
|---|---|---|---|
| Target | Actual | ||
| Calibration 1 | 192,745 | ||
| Calibration 2 | 194,381 | ||
| Calibration 3 | 194,297 | ||
| ssj_ops@calibrated=194,339 | |||
| 100% | 99.4% | 194,339 | 193,242 |
| 90% | 90.5% | 174,905 | 175,842 |
| 80% | 79.9% | 155,471 | 155,293 |
| 70% | 69.6% | 136,037 | 135,299 |
| 60% | 59.8% | 116,603 | 116,186 |
| 50% | 50.4% | 97,169 | 97,932 |
| 40% | 40.2% | 77,736 | 78,124 |
| 30% | 29.9% | 58,302 | 58,029 |
| 20% | 19.5% | 38,868 | 37,814 |
| 10% | 10.0% | 19,434 | 19,433 |
| Active Idle | 0 | 0 | |

| Target Load | Actual Load | ssj_ops | |
|---|---|---|---|
| Target | Actual | ||
| Calibration 1 | 191,061 | ||
| Calibration 2 | 190,249 | ||
| Calibration 3 | 190,646 | ||
| ssj_ops@calibrated=190,448 | |||
| 100% | 99.3% | 190,448 | 189,073 |
| 90% | 90.0% | 171,403 | 171,359 |
| 80% | 79.9% | 152,358 | 152,109 |
| 70% | 69.4% | 133,313 | 132,199 |
| 60% | 60.0% | 114,269 | 114,331 |
| 50% | 50.1% | 95,224 | 95,352 |
| 40% | 40.4% | 76,179 | 76,867 |
| 30% | 30.0% | 57,134 | 57,089 |
| 20% | 20.1% | 38,090 | 38,346 |
| 10% | 9.8% | 19,045 | 18,597 |
| Active Idle | 0 | 0 | |

| Target Load | Actual Load | ssj_ops | |
|---|---|---|---|
| Target | Actual | ||
| Calibration 1 | 187,189 | ||
| Calibration 2 | 188,934 | ||
| Calibration 3 | 189,238 | ||
| ssj_ops@calibrated=189,086 | |||
| 100% | 99.6% | 189,086 | 188,358 |
| 90% | 90.7% | 170,177 | 171,494 |
| 80% | 79.8% | 151,269 | 150,897 |
| 70% | 69.8% | 132,360 | 131,976 |
| 60% | 60.5% | 113,452 | 114,349 |
| 50% | 50.0% | 94,543 | 94,564 |
| 40% | 39.9% | 75,634 | 75,418 |
| 30% | 30.4% | 56,726 | 57,566 |
| 20% | 19.8% | 37,817 | 37,524 |
| 10% | 10.0% | 18,909 | 18,975 |
| Active Idle | 0 | 0 | |

| Target Load | Actual Load | ssj_ops | |
|---|---|---|---|
| Target | Actual | ||
| Calibration 1 | 191,738 | ||
| Calibration 2 | 193,314 | ||
| Calibration 3 | 193,559 | ||
| ssj_ops@calibrated=193,437 | |||
| 100% | 100.0% | 193,437 | 193,489 |
| 90% | 90.5% | 174,093 | 175,084 |
| 80% | 80.2% | 154,749 | 155,184 |
| 70% | 70.0% | 135,406 | 135,469 |
| 60% | 60.0% | 116,062 | 116,143 |
| 50% | 49.7% | 96,718 | 96,138 |
| 40% | 40.2% | 77,375 | 77,736 |
| 30% | 29.9% | 58,031 | 57,875 |
| 20% | 19.8% | 38,687 | 38,388 |
| 10% | 9.9% | 19,344 | 19,100 |
| Active Idle | 0 | 0 | |
| Target Load | Actual Load | ssj_ops | |
|---|---|---|---|
| Target | Actual | ||
| Calibration 1 | 190,032 | ||
| Calibration 2 | 190,751 | ||
| Calibration 3 | 191,231 | ||
| ssj_ops@calibrated=190,991 | |||
| 100% | 99.7% | 190,991 | 190,450 |
| 90% | 89.7% | 171,892 | 171,226 |
| 80% | 80.0% | 152,793 | 152,727 |
| 70% | 69.8% | 133,694 | 133,219 |
| 60% | 59.6% | 114,595 | 113,828 |
| 50% | 49.5% | 95,495 | 94,628 |
| 40% | 40.2% | 76,396 | 76,731 |
| 30% | 29.9% | 57,297 | 57,149 |
| 20% | 20.1% | 38,198 | 38,369 |
| 10% | 10.3% | 19,099 | 19,665 |
| Active Idle | 0 | 0 | |

| Target Load | Actual Load | ssj_ops | |
|---|---|---|---|
| Target | Actual | ||
| Calibration 1 | 189,155 | ||
| Calibration 2 | 191,614 | ||
| Calibration 3 | 192,210 | ||
| ssj_ops@calibrated=191,912 | |||
| 100% | 99.8% | 191,912 | 191,436 |
| 90% | 89.8% | 172,721 | 172,370 |
| 80% | 80.6% | 153,530 | 154,754 |
| 70% | 69.8% | 134,339 | 133,914 |
| 60% | 59.7% | 115,147 | 114,648 |
| 50% | 50.2% | 95,956 | 96,353 |
| 40% | 39.8% | 76,765 | 76,387 |
| 30% | 29.9% | 57,574 | 57,413 |
| 20% | 19.8% | 38,382 | 37,917 |
| 10% | 10.1% | 19,191 | 19,353 |
| Active Idle | 0 | 0 | |

| Target Load | Actual Load | ssj_ops | |
|---|---|---|---|
| Target | Actual | ||
| Calibration 1 | 192,146 | ||
| Calibration 2 | 192,008 | ||
| Calibration 3 | 192,273 | ||
| ssj_ops@calibrated=192,140 | |||
| 100% | 99.9% | 192,140 | 192,036 |
| 90% | 89.9% | 172,926 | 172,736 |
| 80% | 80.4% | 153,712 | 154,570 |
| 70% | 70.0% | 134,498 | 134,578 |
| 60% | 59.4% | 115,284 | 114,161 |
| 50% | 50.0% | 96,070 | 96,065 |
| 40% | 40.1% | 76,856 | 76,962 |
| 30% | 30.2% | 57,642 | 57,953 |
| 20% | 20.2% | 38,428 | 38,834 |
| 10% | 10.0% | 19,214 | 19,254 |
| Active Idle | 0 | 0 | |

| Target Load | Actual Load | ssj_ops | |
|---|---|---|---|
| Target | Actual | ||
| Calibration 1 | 190,664 | ||
| Calibration 2 | 190,638 | ||
| Calibration 3 | 190,104 | ||
| ssj_ops@calibrated=190,371 | |||
| 100% | 99.8% | 190,371 | 189,973 |
| 90% | 88.8% | 171,334 | 168,983 |
| 80% | 79.7% | 152,297 | 151,670 |
| 70% | 69.4% | 133,260 | 132,204 |
| 60% | 60.0% | 114,223 | 114,131 |
| 50% | 50.0% | 95,185 | 95,270 |
| 40% | 39.7% | 76,148 | 75,625 |
| 30% | 30.8% | 57,111 | 58,586 |
| 20% | 19.5% | 38,074 | 37,192 |
| 10% | 10.1% | 19,037 | 19,283 |
| Active Idle | 0 | 0 | |
| Target Load | Actual Load | ssj_ops | |
|---|---|---|---|
| Target | Actual | ||
| Calibration 1 | 192,478 | ||
| Calibration 2 | 192,577 | ||
| Calibration 3 | 192,460 | ||
| ssj_ops@calibrated=192,518 | |||
| 100% | 99.7% | 192,518 | 191,870 |
| 90% | 90.1% | 173,266 | 173,533 |
| 80% | 79.6% | 154,015 | 153,298 |
| 70% | 70.0% | 134,763 | 134,763 |
| 60% | 60.3% | 115,511 | 116,084 |
| 50% | 49.9% | 96,259 | 96,153 |
| 40% | 39.6% | 77,007 | 76,181 |
| 30% | 30.0% | 57,755 | 57,852 |
| 20% | 19.7% | 38,504 | 37,833 |
| 10% | 9.8% | 19,252 | 18,906 |
| Active Idle | 0 | 0 | |

| Target Load | Actual Load | ssj_ops | |
|---|---|---|---|
| Target | Actual | ||
| Calibration 1 | 193,553 | ||
| Calibration 2 | 194,740 | ||
| Calibration 3 | 195,506 | ||
| ssj_ops@calibrated=195,123 | |||
| 100% | 99.6% | 195,123 | 194,297 |
| 90% | 89.9% | 175,611 | 175,440 |
| 80% | 81.1% | 156,099 | 158,187 |
| 70% | 69.7% | 136,586 | 136,098 |
| 60% | 60.0% | 117,074 | 117,073 |
| 50% | 49.3% | 97,562 | 96,217 |
| 40% | 40.2% | 78,049 | 78,497 |
| 30% | 29.8% | 58,537 | 58,053 |
| 20% | 20.0% | 39,025 | 38,984 |
| 10% | 10.0% | 19,512 | 19,491 |
| Active Idle | 0 | 0 | |

| Target Load | Actual Load | ssj_ops | |
|---|---|---|---|
| Target | Actual | ||
| Calibration 1 | 192,522 | ||
| Calibration 2 | 193,257 | ||
| Calibration 3 | 193,081 | ||
| ssj_ops@calibrated=193,169 | |||
| 100% | 99.8% | 193,169 | 192,828 |
| 90% | 89.9% | 173,852 | 173,564 |
| 80% | 79.5% | 154,535 | 153,548 |
| 70% | 69.8% | 135,218 | 134,771 |
| 60% | 60.3% | 115,901 | 116,442 |
| 50% | 50.3% | 96,584 | 97,208 |
| 40% | 40.2% | 77,268 | 77,682 |
| 30% | 29.8% | 57,951 | 57,621 |
| 20% | 20.0% | 38,634 | 38,537 |
| 10% | 10.0% | 19,317 | 19,321 |
| Active Idle | 0 | 0 | |

| Target Load | Actual Load | ssj_ops | |
|---|---|---|---|
| Target | Actual | ||
| Calibration 1 | 195,037 | ||
| Calibration 2 | 193,623 | ||
| Calibration 3 | 193,969 | ||
| ssj_ops@calibrated=193,796 | |||
| 100% | 100.3% | 193,796 | 194,385 |
| 90% | 90.1% | 174,417 | 174,641 |
| 80% | 79.6% | 155,037 | 154,249 |
| 70% | 69.3% | 135,657 | 134,227 |
| 60% | 60.0% | 116,278 | 116,284 |
| 50% | 49.7% | 96,898 | 96,323 |
| 40% | 40.1% | 77,518 | 77,652 |
| 30% | 30.1% | 58,139 | 58,359 |
| 20% | 19.8% | 38,759 | 38,406 |
| 10% | 10.0% | 19,380 | 19,339 |
| Active Idle | 0 | 0 | |
| Target Load | Actual Load | ssj_ops | |
|---|---|---|---|
| Target | Actual | ||
| Calibration 1 | 192,335 | ||
| Calibration 2 | 191,015 | ||
| Calibration 3 | 191,899 | ||
| ssj_ops@calibrated=191,457 | |||
| 100% | 99.4% | 191,457 | 190,346 |
| 90% | 90.2% | 172,311 | 172,734 |
| 80% | 79.8% | 153,166 | 152,851 |
| 70% | 70.1% | 134,020 | 134,217 |
| 60% | 60.4% | 114,874 | 115,666 |
| 50% | 49.8% | 95,729 | 95,340 |
| 40% | 40.2% | 76,583 | 76,904 |
| 30% | 30.0% | 57,437 | 57,398 |
| 20% | 20.0% | 38,291 | 38,208 |
| 10% | 10.1% | 19,146 | 19,304 |
| Active Idle | 0 | 0 | |

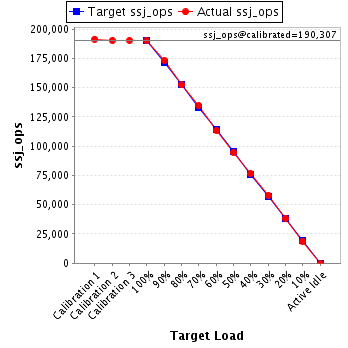
| Target Load | Actual Load | ssj_ops | |
|---|---|---|---|
| Target | Actual | ||
| Calibration 1 | 191,372 | ||
| Calibration 2 | 190,190 | ||
| Calibration 3 | 190,425 | ||
| ssj_ops@calibrated=190,307 | |||
| 100% | 99.8% | 190,307 | 189,856 |
| 90% | 91.0% | 171,277 | 173,197 |
| 80% | 80.0% | 152,246 | 152,267 |
| 70% | 70.7% | 133,215 | 134,574 |
| 60% | 59.7% | 114,184 | 113,608 |
| 50% | 49.7% | 95,154 | 94,621 |
| 40% | 40.2% | 76,123 | 76,599 |
| 30% | 30.4% | 57,092 | 57,780 |
| 20% | 20.2% | 38,061 | 38,357 |
| 10% | 10.0% | 19,031 | 18,971 |
| Active Idle | 0 | 0 | |
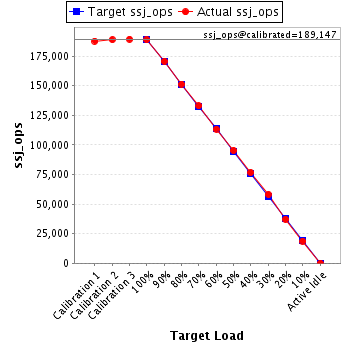
| Target Load | Actual Load | ssj_ops | |
|---|---|---|---|
| Target | Actual | ||
| Calibration 1 | 187,862 | ||
| Calibration 2 | 188,878 | ||
| Calibration 3 | 189,416 | ||
| ssj_ops@calibrated=189,147 | |||
| 100% | 99.9% | 189,147 | 188,908 |
| 90% | 90.3% | 170,232 | 170,745 |
| 80% | 80.1% | 151,318 | 151,476 |
| 70% | 70.3% | 132,403 | 133,045 |
| 60% | 60.0% | 113,488 | 113,473 |
| 50% | 50.5% | 94,573 | 95,433 |
| 40% | 40.6% | 75,659 | 76,810 |
| 30% | 30.8% | 56,744 | 58,251 |
| 20% | 19.7% | 37,829 | 37,250 |
| 10% | 9.9% | 18,915 | 18,787 |
| Active Idle | 0 | 0 | |
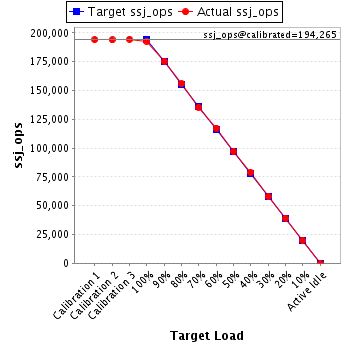
| Target Load | Actual Load | ssj_ops | |
|---|---|---|---|
| Target | Actual | ||
| Calibration 1 | 194,081 | ||
| Calibration 2 | 193,927 | ||
| Calibration 3 | 194,604 | ||
| ssj_ops@calibrated=194,265 | |||
| 100% | 99.3% | 194,265 | 192,838 |
| 90% | 90.2% | 174,839 | 175,299 |
| 80% | 80.3% | 155,412 | 155,909 |
| 70% | 69.8% | 135,986 | 135,553 |
| 60% | 60.4% | 116,559 | 117,307 |
| 50% | 50.1% | 97,133 | 97,314 |
| 40% | 40.6% | 77,706 | 78,891 |
| 30% | 29.9% | 58,280 | 58,077 |
| 20% | 20.1% | 38,853 | 39,079 |
| 10% | 10.2% | 19,427 | 19,908 |
| Active Idle | 0 | 0 | |
| Target Load | Actual Load | ssj_ops | |
|---|---|---|---|
| Target | Actual | ||
| Calibration 1 | 195,676 | ||
| Calibration 2 | 195,581 | ||
| Calibration 3 | 195,759 | ||
| ssj_ops@calibrated=195,670 | |||
| 100% | 99.6% | 195,670 | 194,911 |
| 90% | 89.7% | 176,103 | 175,586 |
| 80% | 80.6% | 156,536 | 157,650 |
| 70% | 69.9% | 136,969 | 136,819 |
| 60% | 60.3% | 117,402 | 118,083 |
| 50% | 50.1% | 97,835 | 98,007 |
| 40% | 40.3% | 78,268 | 78,865 |
| 30% | 30.4% | 58,701 | 59,508 |
| 20% | 19.6% | 39,134 | 38,324 |
| 10% | 10.1% | 19,567 | 19,771 |
| Active Idle | 0 | 0 | |

| Target Load | Actual Load | ssj_ops | |
|---|---|---|---|
| Target | Actual | ||
| Calibration 1 | 191,465 | ||
| Calibration 2 | 192,444 | ||
| Calibration 3 | 192,614 | ||
| ssj_ops@calibrated=192,529 | |||
| 100% | 99.7% | 192,529 | 192,010 |
| 90% | 89.5% | 173,276 | 172,384 |
| 80% | 81.0% | 154,023 | 155,896 |
| 70% | 70.2% | 134,770 | 135,091 |
| 60% | 60.3% | 115,517 | 116,033 |
| 50% | 50.0% | 96,264 | 96,181 |
| 40% | 40.1% | 77,012 | 77,271 |
| 30% | 29.5% | 57,759 | 56,827 |
| 20% | 19.9% | 38,506 | 38,367 |
| 10% | 9.9% | 19,253 | 19,016 |
| Active Idle | 0 | 0 | |

| Target Load | Actual Load | ssj_ops | |
|---|---|---|---|
| Target | Actual | ||
| Calibration 1 | 192,670 | ||
| Calibration 2 | 192,718 | ||
| Calibration 3 | 192,801 | ||
| ssj_ops@calibrated=192,759 | |||
| 100% | 99.9% | 192,759 | 192,568 |
| 90% | 89.6% | 173,484 | 172,686 |
| 80% | 79.5% | 154,208 | 153,245 |
| 70% | 69.9% | 134,932 | 134,737 |
| 60% | 60.6% | 115,656 | 116,816 |
| 50% | 50.1% | 96,380 | 96,572 |
| 40% | 40.0% | 77,104 | 77,046 |
| 30% | 29.9% | 57,828 | 57,698 |
| 20% | 20.1% | 38,552 | 38,795 |
| 10% | 9.9% | 19,276 | 19,167 |
| Active Idle | 0 | 0 | |

| Target Load | Actual Load | ssj_ops | |
|---|---|---|---|
| Target | Actual | ||
| Calibration 1 | 196,230 | ||
| Calibration 2 | 196,763 | ||
| Calibration 3 | 197,145 | ||
| ssj_ops@calibrated=196,954 | |||
| 100% | 100.3% | 196,954 | 197,458 |
| 90% | 89.8% | 177,259 | 176,942 |
| 80% | 80.1% | 157,563 | 157,721 |
| 70% | 69.4% | 137,868 | 136,697 |
| 60% | 59.8% | 118,173 | 117,731 |
| 50% | 49.5% | 98,477 | 97,438 |
| 40% | 39.8% | 78,782 | 78,294 |
| 30% | 30.0% | 59,086 | 59,070 |
| 20% | 19.9% | 39,391 | 39,142 |
| 10% | 10.2% | 19,695 | 20,025 |
| Active Idle | 0 | 0 | |

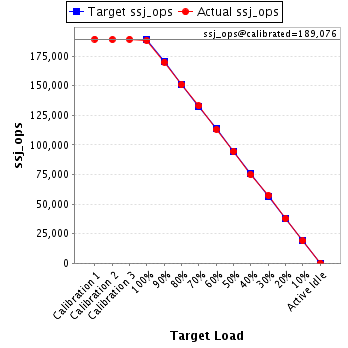
| Target Load | Actual Load | ssj_ops | |
|---|---|---|---|
| Target | Actual | ||
| Calibration 1 | 189,263 | ||
| Calibration 2 | 188,920 | ||
| Calibration 3 | 189,233 | ||
| ssj_ops@calibrated=189,076 | |||
| 100% | 99.5% | 189,076 | 188,140 |
| 90% | 89.8% | 170,169 | 169,831 |
| 80% | 79.7% | 151,261 | 150,736 |
| 70% | 70.3% | 132,354 | 132,852 |
| 60% | 59.8% | 113,446 | 113,086 |
| 50% | 50.0% | 94,538 | 94,458 |
| 40% | 39.5% | 75,631 | 74,706 |
| 30% | 30.3% | 56,723 | 57,261 |
| 20% | 19.9% | 37,815 | 37,683 |
| 10% | 10.0% | 18,908 | 18,892 |
| Active Idle | 0 | 0 | |
| Target Load | Actual Load | ssj_ops | |
|---|---|---|---|
| Target | Actual | ||
| Calibration 1 | 192,486 | ||
| Calibration 2 | 191,873 | ||
| Calibration 3 | 192,065 | ||
| ssj_ops@calibrated=191,969 | |||
| 100% | 99.3% | 191,969 | 190,580 |
| 90% | 90.8% | 172,772 | 174,391 |
| 80% | 80.1% | 153,575 | 153,677 |
| 70% | 70.1% | 134,378 | 134,534 |
| 60% | 60.0% | 115,181 | 115,241 |
| 50% | 50.3% | 95,985 | 96,502 |
| 40% | 40.0% | 76,788 | 76,753 |
| 30% | 30.2% | 57,591 | 58,024 |
| 20% | 20.1% | 38,394 | 38,583 |
| 10% | 10.0% | 19,197 | 19,170 |
| Active Idle | 0 | 0 | |

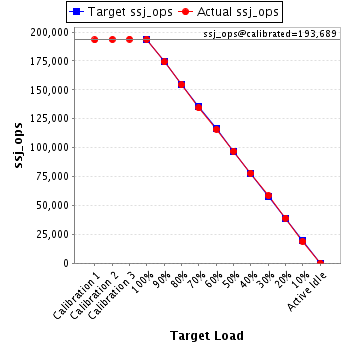
| Target Load | Actual Load | ssj_ops | |
|---|---|---|---|
| Target | Actual | ||
| Calibration 1 | 193,185 | ||
| Calibration 2 | 193,515 | ||
| Calibration 3 | 193,862 | ||
| ssj_ops@calibrated=193,689 | |||
| 100% | 100.0% | 193,689 | 193,658 |
| 90% | 89.9% | 174,320 | 174,129 |
| 80% | 79.7% | 154,951 | 154,311 |
| 70% | 69.4% | 135,582 | 134,413 |
| 60% | 59.8% | 116,213 | 115,886 |
| 50% | 50.1% | 96,844 | 97,047 |
| 40% | 40.2% | 77,475 | 77,815 |
| 30% | 30.1% | 58,107 | 58,353 |
| 20% | 20.2% | 38,738 | 39,145 |
| 10% | 9.7% | 19,369 | 18,775 |
| Active Idle | 0 | 0 | |
| Target Load | Actual Load | ssj_ops | |
|---|---|---|---|
| Target | Actual | ||
| Calibration 1 | 194,656 | ||
| Calibration 2 | 194,475 | ||
| Calibration 3 | 194,288 | ||
| ssj_ops@calibrated=194,381 | |||
| 100% | 99.6% | 194,381 | 193,528 |
| 90% | 90.6% | 174,943 | 176,189 |
| 80% | 79.6% | 155,505 | 154,692 |
| 70% | 69.9% | 136,067 | 135,940 |
| 60% | 60.3% | 116,629 | 117,140 |
| 50% | 49.8% | 97,191 | 96,786 |
| 40% | 40.0% | 77,753 | 77,787 |
| 30% | 29.9% | 58,314 | 58,096 |
| 20% | 20.0% | 38,876 | 38,954 |
| 10% | 9.9% | 19,438 | 19,231 |
| Active Idle | 0 | 0 | |
