| Target Load |
Actual Load |
ssj_ops |
| Target |
Actual |
| Calibration 1 |
|
|
11,899,127 |
| Calibration 2 |
|
|
11,975,426 |
| Calibration 3 |
|
|
12,003,941 |
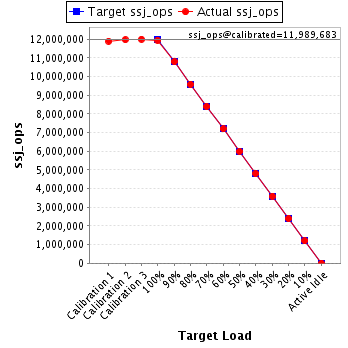
| ssj_ops@calibrated=11,989,683 |
| 100% |
99.6% |
11,989,683 |
11,944,946 |
| 90% |
90.1% |
10,790,715 |
10,797,236 |
| 80% |
80.0% |
9,591,747 |
9,590,915 |
| 70% |
70.0% |
8,392,778 |
8,395,018 |
| 60% |
60.0% |
7,193,810 |
7,198,987 |
| 50% |
50.0% |
5,994,842 |
5,997,479 |
| 40% |
40.0% |
4,795,873 |
4,801,193 |
| 30% |
30.0% |
3,596,905 |
3,594,982 |
| 20% |
20.0% |
2,397,937 |
2,396,380 |
| 10% |
10.0% |
1,198,968 |
1,199,727 |
| Active Idle |
|
0 |
0 |
| Hardware |
| Hardware Vendor: |
Lenovo Global Technology |
| Model: |
Think System SR665 |
| Form Factor: |
2U |
| CPU Name: |
AMD EPYC 7742 2.25GHz |
| CPU Characteristics: |
64-Core, 2.25GHz, 256MB L3 Cache |
| CPU Frequency (MHz): |
2250 |
| CPU(s) Enabled: |
128 cores, 2 chips, 64 cores/chip |
| Hardware Threads: |
256 (2 / core) |
| CPU(s) Orderable: |
1,2 chips |
| Primary Cache: |
32 KB I + 32 KB D on chip per core |
| Secondary Cache: |
512 KB I+D on chip per core |
| Tertiary Cache: |
256 MB I+D on chip per chip, 16 MB shared / 4 cores |
| Other Cache: |
None |
| Memory Amount (GB): |
256 |
| # and size of DIMM: |
16 x 16384 MB |
| Memory Details: |
16 x 16GB 2Rx8 PC4-3200AA-RE2-12; slots 1, 3, 5, 7, 10, 12, 14, 16, 17, 19, 21, 23, 26, 28, 30,and 32 populated |
| Power Supply Quantity and Rating (W): |
1 x 1100 |
| Power Supply Details: |
Lenovo P/N:4P57A26293 |
| Disk Drive: |
1 x 128GB M.2 SSD P/N:7N47A00130 M.2 Module P/N:4Y37A09738 |
| Disk Controller: |
Integrated SATA controller |
| # and type of Network Interface Cards (NICs) Installed: |
1 x ThinkSystem Mellanox ConnectX-4 Lx 10/25GbE SFP28 2-port OCP Ethernet Adapter |
| NICs Enabled in Firmware / OS / Connected: |
2/2/1 |
| Network Speed (Mbit): |
10000 |
| Keyboard: |
None |
| Mouse: |
None |
| Monitor: |
None |
| Optical Drives: |
No |
| Other Hardware: |
None |
| JVM Instance |
ssj_ops@100% |
| localhost.001 |
185,357 |
| localhost.002 |
187,095 |
| localhost.003 |
186,893 |
| localhost.004 |
185,911 |
| localhost.005 |
188,403 |
| localhost.006 |
188,888 |
| localhost.007 |
188,413 |
| localhost.008 |
187,356 |
| localhost.009 |
182,960 |
| localhost.010 |
190,139 |
| localhost.011 |
188,394 |
| localhost.012 |
188,609 |
| localhost.013 |
188,084 |
| localhost.014 |
187,648 |
| localhost.015 |
186,058 |
| localhost.016 |
185,578 |
| localhost.017 |
183,741 |
| localhost.018 |
181,714 |
| localhost.019 |
183,563 |
| localhost.020 |
183,650 |
| localhost.021 |
182,191 |
| localhost.022 |
183,486 |
| localhost.023 |
184,989 |
| localhost.024 |
184,323 |
| localhost.025 |
189,502 |
| localhost.026 |
181,217 |
| localhost.027 |
182,643 |
| localhost.028 |
183,044 |
| localhost.029 |
184,999 |
| localhost.030 |
182,298 |
| localhost.031 |
185,439 |
| localhost.032 |
180,348 |
| localhost.033 |
188,750 |
| localhost.034 |
184,765 |
| localhost.035 |
188,595 |
| localhost.036 |
187,338 |
| localhost.037 |
186,779 |
| localhost.038 |
190,897 |
| localhost.039 |
188,588 |
| localhost.040 |
186,684 |
| localhost.041 |
188,244 |
| localhost.042 |
187,794 |
| localhost.043 |
188,784 |
| localhost.044 |
189,152 |
| localhost.045 |
186,932 |
| localhost.046 |
185,765 |
| localhost.047 |
185,570 |
| localhost.048 |
187,831 |
| localhost.049 |
178,945 |
| localhost.050 |
193,052 |
| localhost.051 |
187,613 |
| localhost.052 |
190,143 |
| localhost.053 |
185,429 |
| localhost.054 |
179,111 |
| localhost.055 |
183,029 |
| localhost.056 |
185,114 |
| localhost.057 |
193,915 |
| localhost.058 |
191,572 |
| localhost.059 |
190,572 |
| localhost.060 |
190,386 |
| localhost.061 |
190,435 |
| localhost.062 |
190,092 |
| localhost.063 |
190,354 |
| localhost.064 |
189,782 |
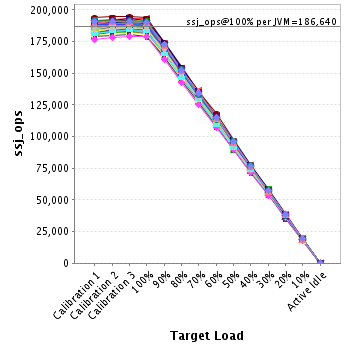
| ssj_ops@100% |
11,944,946 |
| ssj_ops@100% per JVM |
186,640 |
JVM 'localhost.001' Scores:
| Target Load |
Actual Load |
ssj_ops |
| Target |
Actual |
| Calibration 1 |
|
|
184,922 |
| Calibration 2 |
|
|
186,735 |
| Calibration 3 |
|
|
186,121 |
| ssj_ops@calibrated=186,428 |
| 100% |
99.4% |
186,428 |
185,357 |
| 90% |
89.8% |
167,785 |
167,319 |
| 80% |
80.3% |
149,142 |
149,657 |
| 70% |
69.8% |
130,500 |
130,144 |
| 60% |
59.5% |
111,857 |
110,954 |
| 50% |
49.9% |
93,214 |
92,991 |
| 40% |
39.9% |
74,571 |
74,391 |
| 30% |
29.7% |
55,928 |
55,308 |
| 20% |
20.1% |
37,286 |
37,459 |
| 10% |
9.7% |
18,643 |
18,000 |
| Active Idle |
|
0 |
0 |
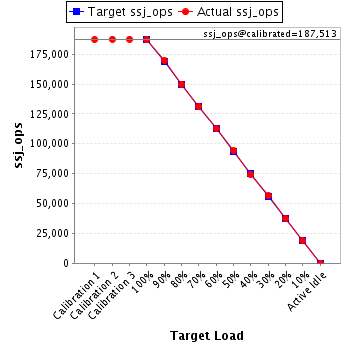
JVM 'localhost.002' Scores:
| Target Load |
Actual Load |
ssj_ops |
| Target |
Actual |
| Calibration 1 |
|
|
187,245 |
| Calibration 2 |
|
|
187,477 |
| Calibration 3 |
|
|
187,549 |
| ssj_ops@calibrated=187,513 |
| 100% |
99.8% |
187,513 |
187,095 |
| 90% |
90.4% |
168,762 |
169,567 |
| 80% |
79.9% |
150,011 |
149,734 |
| 70% |
69.9% |
131,259 |
130,991 |
| 60% |
60.1% |
112,508 |
112,710 |
| 50% |
50.1% |
93,757 |
93,956 |
| 40% |
39.6% |
75,005 |
74,167 |
| 30% |
30.0% |
56,254 |
56,342 |
| 20% |
19.8% |
37,503 |
37,187 |
| 10% |
10.0% |
18,751 |
18,787 |
| Active Idle |
|
0 |
0 |
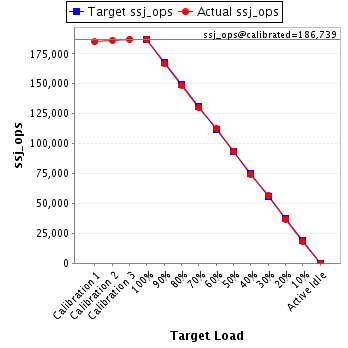
JVM 'localhost.003' Scores:
| Target Load |
Actual Load |
ssj_ops |
| Target |
Actual |
| Calibration 1 |
|
|
184,904 |
| Calibration 2 |
|
|
186,210 |
| Calibration 3 |
|
|
187,267 |
| ssj_ops@calibrated=186,739 |
| 100% |
100.1% |
186,739 |
186,893 |
| 90% |
89.3% |
168,065 |
166,824 |
| 80% |
79.7% |
149,391 |
148,767 |
| 70% |
69.7% |
130,717 |
130,155 |
| 60% |
60.4% |
112,043 |
112,819 |
| 50% |
50.1% |
93,369 |
93,499 |
| 40% |
39.8% |
74,695 |
74,235 |
| 30% |
30.2% |
56,022 |
56,400 |
| 20% |
19.8% |
37,348 |
36,932 |
| 10% |
9.9% |
18,674 |
18,463 |
| Active Idle |
|
0 |
0 |
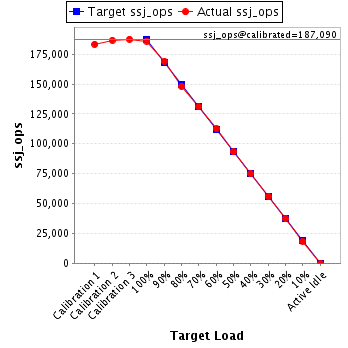
JVM 'localhost.004' Scores:
| Target Load |
Actual Load |
ssj_ops |
| Target |
Actual |
| Calibration 1 |
|
|
183,284 |
| Calibration 2 |
|
|
186,611 |
| Calibration 3 |
|
|
187,569 |
| ssj_ops@calibrated=187,090 |
| 100% |
99.4% |
187,090 |
185,911 |
| 90% |
90.4% |
168,381 |
169,065 |
| 80% |
79.2% |
149,672 |
148,084 |
| 70% |
70.1% |
130,963 |
131,185 |
| 60% |
60.2% |
112,254 |
112,601 |
| 50% |
49.9% |
93,545 |
93,383 |
| 40% |
40.0% |
74,836 |
74,837 |
| 30% |
30.1% |
56,127 |
56,253 |
| 20% |
19.9% |
37,418 |
37,158 |
| 10% |
9.9% |
18,709 |
18,527 |
| Active Idle |
|
0 |
0 |
JVM 'localhost.005' Scores:
| Target Load |
Actual Load |
ssj_ops |
| Target |
Actual |
| Calibration 1 |
|
|
186,876 |
| Calibration 2 |
|
|
188,888 |
| Calibration 3 |
|
|
189,898 |
| ssj_ops@calibrated=189,393 |
| 100% |
99.5% |
189,393 |
188,403 |
| 90% |
89.6% |
170,453 |
169,711 |
| 80% |
80.2% |
151,514 |
151,883 |
| 70% |
69.6% |
132,575 |
131,786 |
| 60% |
60.0% |
113,636 |
113,573 |
| 50% |
49.7% |
94,696 |
94,061 |
| 40% |
39.5% |
75,757 |
74,865 |
| 30% |
30.0% |
56,818 |
56,883 |
| 20% |
19.8% |
37,879 |
37,490 |
| 10% |
10.1% |
18,939 |
19,062 |
| Active Idle |
|
0 |
0 |
JVM 'localhost.006' Scores:
| Target Load |
Actual Load |
ssj_ops |
| Target |
Actual |
| Calibration 1 |
|
|
189,172 |
| Calibration 2 |
|
|
189,498 |
| Calibration 3 |
|
|
188,964 |
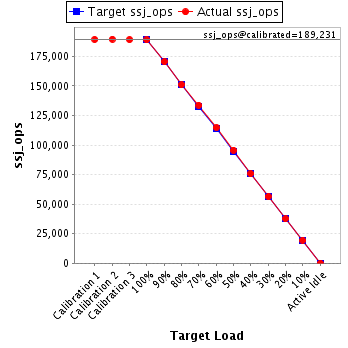
| ssj_ops@calibrated=189,231 |
| 100% |
99.8% |
189,231 |
188,888 |
| 90% |
90.0% |
170,308 |
170,372 |
| 80% |
79.7% |
151,385 |
150,851 |
| 70% |
70.7% |
132,462 |
133,734 |
| 60% |
60.6% |
113,539 |
114,736 |
| 50% |
50.6% |
94,616 |
95,718 |
| 40% |
40.0% |
75,692 |
75,705 |
| 30% |
29.8% |
56,769 |
56,470 |
| 20% |
19.8% |
37,846 |
37,517 |
| 10% |
10.3% |
18,923 |
19,539 |
| Active Idle |
|
0 |
0 |
JVM 'localhost.007' Scores:
| Target Load |
Actual Load |
ssj_ops |
| Target |
Actual |
| Calibration 1 |
|
|
188,123 |
| Calibration 2 |
|
|
189,961 |
| Calibration 3 |
|
|
189,530 |
| ssj_ops@calibrated=189,746 |
| 100% |
99.3% |
189,746 |
188,413 |
| 90% |
90.6% |
170,771 |
171,839 |
| 80% |
80.0% |
151,797 |
151,834 |
| 70% |
70.0% |
132,822 |
132,729 |
| 60% |
60.2% |
113,847 |
114,253 |
| 50% |
50.1% |
94,873 |
95,142 |
| 40% |
39.9% |
75,898 |
75,775 |
| 30% |
29.7% |
56,924 |
56,282 |
| 20% |
20.3% |
37,949 |
38,605 |
| 10% |
9.9% |
18,975 |
18,875 |
| Active Idle |
|
0 |
0 |
JVM 'localhost.008' Scores:
| Target Load |
Actual Load |
ssj_ops |
| Target |
Actual |
| Calibration 1 |
|
|
183,733 |
| Calibration 2 |
|
|
187,137 |
| Calibration 3 |
|
|
188,216 |
| ssj_ops@calibrated=187,676 |
| 100% |
99.8% |
187,676 |
187,356 |
| 90% |
90.4% |
168,909 |
169,617 |
| 80% |
80.3% |
150,141 |
150,755 |
| 70% |
69.3% |
131,373 |
130,099 |
| 60% |
59.9% |
112,606 |
112,367 |
| 50% |
50.3% |
93,838 |
94,435 |
| 40% |
40.0% |
75,071 |
75,027 |
| 30% |
30.5% |
56,303 |
57,200 |
| 20% |
20.0% |
37,535 |
37,625 |
| 10% |
10.0% |
18,768 |
18,678 |
| Active Idle |
|
0 |
0 |
JVM 'localhost.009' Scores:
| Target Load |
Actual Load |
ssj_ops |
| Target |
Actual |
| Calibration 1 |
|
|
182,875 |
| Calibration 2 |
|
|
182,706 |
| Calibration 3 |
|
|
183,289 |
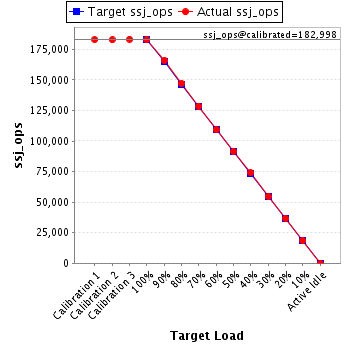
| ssj_ops@calibrated=182,998 |
| 100% |
100.0% |
182,998 |
182,960 |
| 90% |
90.6% |
164,698 |
165,838 |
| 80% |
80.4% |
146,398 |
147,089 |
| 70% |
70.3% |
128,098 |
128,561 |
| 60% |
59.7% |
109,799 |
109,267 |
| 50% |
50.1% |
91,499 |
91,620 |
| 40% |
40.4% |
73,199 |
73,900 |
| 30% |
29.9% |
54,899 |
54,783 |
| 20% |
19.9% |
36,600 |
36,504 |
| 10% |
10.0% |
18,300 |
18,384 |
| Active Idle |
|
0 |
0 |
JVM 'localhost.010' Scores:
| Target Load |
Actual Load |
ssj_ops |
| Target |
Actual |
| Calibration 1 |
|
|
188,058 |
| Calibration 2 |
|
|
190,327 |
| Calibration 3 |
|
|
190,803 |
| ssj_ops@calibrated=190,565 |
| 100% |
99.8% |
190,565 |
190,139 |
| 90% |
90.5% |
171,509 |
172,432 |
| 80% |
80.8% |
152,452 |
153,919 |
| 70% |
69.9% |
133,396 |
133,236 |
| 60% |
59.8% |
114,339 |
114,017 |
| 50% |
49.8% |
95,283 |
94,959 |
| 40% |
40.4% |
76,226 |
77,023 |
| 30% |
30.1% |
57,170 |
57,385 |
| 20% |
20.0% |
38,113 |
38,062 |
| 10% |
10.0% |
19,057 |
19,004 |
| Active Idle |
|
0 |
0 |
JVM 'localhost.011' Scores:
| Target Load |
Actual Load |
ssj_ops |
| Target |
Actual |
| Calibration 1 |
|
|
188,550 |
| Calibration 2 |
|
|
189,913 |
| Calibration 3 |
|
|
189,974 |
| ssj_ops@calibrated=189,943 |
| 100% |
99.2% |
189,943 |
188,394 |
| 90% |
90.0% |
170,949 |
170,998 |
| 80% |
80.7% |
151,954 |
153,299 |
| 70% |
70.2% |
132,960 |
133,337 |
| 60% |
60.4% |
113,966 |
114,740 |
| 50% |
50.1% |
94,972 |
95,164 |
| 40% |
39.9% |
75,977 |
75,751 |
| 30% |
30.5% |
56,983 |
57,938 |
| 20% |
19.7% |
37,989 |
37,447 |
| 10% |
9.9% |
18,994 |
18,896 |
| Active Idle |
|
0 |
0 |
JVM 'localhost.012' Scores:
| Target Load |
Actual Load |
ssj_ops |
| Target |
Actual |
| Calibration 1 |
|
|
188,580 |
| Calibration 2 |
|
|
189,075 |
| Calibration 3 |
|
|
189,224 |
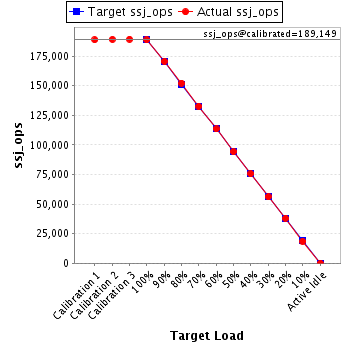
| ssj_ops@calibrated=189,149 |
| 100% |
99.7% |
189,149 |
188,609 |
| 90% |
90.1% |
170,234 |
170,501 |
| 80% |
80.5% |
151,319 |
152,202 |
| 70% |
70.1% |
132,404 |
132,602 |
| 60% |
60.0% |
113,489 |
113,402 |
| 50% |
49.8% |
94,575 |
94,120 |
| 40% |
39.9% |
75,660 |
75,426 |
| 30% |
29.7% |
56,745 |
56,087 |
| 20% |
20.1% |
37,830 |
38,083 |
| 10% |
9.8% |
18,915 |
18,596 |
| Active Idle |
|
0 |
0 |
JVM 'localhost.013' Scores:
| Target Load |
Actual Load |
ssj_ops |
| Target |
Actual |
| Calibration 1 |
|
|
187,158 |
| Calibration 2 |
|
|
187,820 |
| Calibration 3 |
|
|
188,293 |
| ssj_ops@calibrated=188,056 |
| 100% |
100.0% |
188,056 |
188,084 |
| 90% |
89.7% |
169,251 |
168,606 |
| 80% |
79.8% |
150,445 |
150,022 |
| 70% |
70.6% |
131,639 |
132,785 |
| 60% |
60.1% |
112,834 |
113,110 |
| 50% |
49.5% |
94,028 |
93,159 |
| 40% |
39.8% |
75,223 |
74,757 |
| 30% |
29.7% |
56,417 |
55,902 |
| 20% |
19.7% |
37,611 |
37,009 |
| 10% |
10.0% |
18,806 |
18,736 |
| Active Idle |
|
0 |
0 |
JVM 'localhost.014' Scores:
| Target Load |
Actual Load |
ssj_ops |
| Target |
Actual |
| Calibration 1 |
|
|
185,565 |
| Calibration 2 |
|
|
189,042 |
| Calibration 3 |
|
|
189,508 |
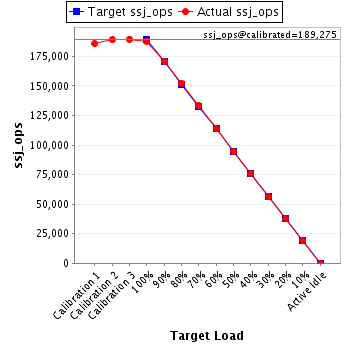
| ssj_ops@calibrated=189,275 |
| 100% |
99.1% |
189,275 |
187,648 |
| 90% |
90.2% |
170,348 |
170,702 |
| 80% |
80.5% |
151,420 |
152,407 |
| 70% |
70.3% |
132,493 |
133,060 |
| 60% |
60.2% |
113,565 |
113,936 |
| 50% |
49.9% |
94,638 |
94,440 |
| 40% |
39.9% |
75,710 |
75,587 |
| 30% |
29.6% |
56,783 |
56,075 |
| 20% |
19.8% |
37,855 |
37,554 |
| 10% |
10.1% |
18,928 |
19,146 |
| Active Idle |
|
0 |
0 |
JVM 'localhost.015' Scores:
| Target Load |
Actual Load |
ssj_ops |
| Target |
Actual |
| Calibration 1 |
|
|
185,030 |
| Calibration 2 |
|
|
185,623 |
| Calibration 3 |
|
|
185,984 |
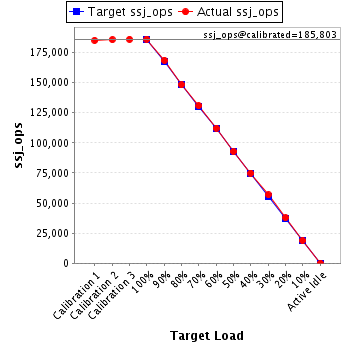
| ssj_ops@calibrated=185,803 |
| 100% |
100.1% |
185,803 |
186,058 |
| 90% |
90.7% |
167,223 |
168,565 |
| 80% |
79.7% |
148,643 |
148,127 |
| 70% |
70.4% |
130,062 |
130,763 |
| 60% |
60.4% |
111,482 |
112,200 |
| 50% |
50.0% |
92,902 |
92,914 |
| 40% |
40.3% |
74,321 |
74,918 |
| 30% |
30.6% |
55,741 |
56,866 |
| 20% |
20.3% |
37,161 |
37,662 |
| 10% |
10.2% |
18,580 |
18,929 |
| Active Idle |
|
0 |
0 |
JVM 'localhost.016' Scores:
| Target Load |
Actual Load |
ssj_ops |
| Target |
Actual |
| Calibration 1 |
|
|
186,254 |
| Calibration 2 |
|
|
186,577 |
| Calibration 3 |
|
|
186,905 |
| ssj_ops@calibrated=186,741 |
| 100% |
99.4% |
186,741 |
185,578 |
| 90% |
90.5% |
168,067 |
168,940 |
| 80% |
80.1% |
149,393 |
149,568 |
| 70% |
69.9% |
130,719 |
130,489 |
| 60% |
60.9% |
112,045 |
113,812 |
| 50% |
49.7% |
93,371 |
92,898 |
| 40% |
39.7% |
74,696 |
74,129 |
| 30% |
30.6% |
56,022 |
57,130 |
| 20% |
20.0% |
37,348 |
37,387 |
| 10% |
9.9% |
18,674 |
18,579 |
| Active Idle |
|
0 |
0 |
JVM 'localhost.017' Scores:
| Target Load |
Actual Load |
ssj_ops |
| Target |
Actual |
| Calibration 1 |
|
|
182,395 |
| Calibration 2 |
|
|
184,751 |
| Calibration 3 |
|
|
184,513 |
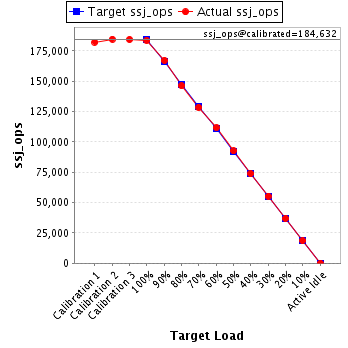
| ssj_ops@calibrated=184,632 |
| 100% |
99.5% |
184,632 |
183,741 |
| 90% |
90.6% |
166,169 |
167,317 |
| 80% |
79.2% |
147,706 |
146,241 |
| 70% |
69.6% |
129,242 |
128,523 |
| 60% |
60.5% |
110,779 |
111,728 |
| 50% |
50.1% |
92,316 |
92,591 |
| 40% |
40.0% |
73,853 |
73,828 |
| 30% |
30.0% |
55,390 |
55,370 |
| 20% |
20.0% |
36,926 |
36,973 |
| 10% |
10.1% |
18,463 |
18,646 |
| Active Idle |
|
0 |
0 |
JVM 'localhost.018' Scores:
| Target Load |
Actual Load |
ssj_ops |
| Target |
Actual |
| Calibration 1 |
|
|
180,718 |
| Calibration 2 |
|
|
182,004 |
| Calibration 3 |
|
|
181,870 |
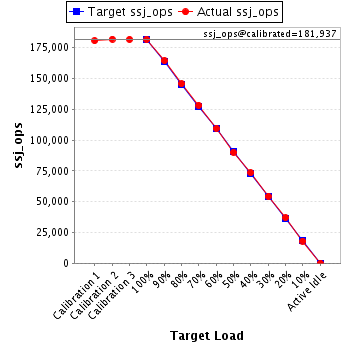
| ssj_ops@calibrated=181,937 |
| 100% |
99.9% |
181,937 |
181,714 |
| 90% |
90.4% |
163,743 |
164,542 |
| 80% |
80.1% |
145,550 |
145,694 |
| 70% |
70.6% |
127,356 |
128,383 |
| 60% |
60.2% |
109,162 |
109,564 |
| 50% |
49.5% |
90,968 |
90,110 |
| 40% |
40.4% |
72,775 |
73,556 |
| 30% |
29.9% |
54,581 |
54,388 |
| 20% |
20.3% |
36,387 |
37,009 |
| 10% |
9.9% |
18,194 |
18,042 |
| Active Idle |
|
0 |
0 |
JVM 'localhost.019' Scores:
| Target Load |
Actual Load |
ssj_ops |
| Target |
Actual |
| Calibration 1 |
|
|
184,262 |
| Calibration 2 |
|
|
183,870 |
| Calibration 3 |
|
|
184,984 |
| ssj_ops@calibrated=184,427 |
| 100% |
99.5% |
184,427 |
183,563 |
| 90% |
90.2% |
165,984 |
166,403 |
| 80% |
79.9% |
147,542 |
147,396 |
| 70% |
70.2% |
129,099 |
129,398 |
| 60% |
60.0% |
110,656 |
110,720 |
| 50% |
49.9% |
92,214 |
92,103 |
| 40% |
39.8% |
73,771 |
73,323 |
| 30% |
30.4% |
55,328 |
56,126 |
| 20% |
20.4% |
36,885 |
37,553 |
| 10% |
9.9% |
18,443 |
18,200 |
| Active Idle |
|
0 |
0 |
JVM 'localhost.020' Scores:
| Target Load |
Actual Load |
ssj_ops |
| Target |
Actual |
| Calibration 1 |
|
|
181,079 |
| Calibration 2 |
|
|
184,870 |
| Calibration 3 |
|
|
185,447 |
| ssj_ops@calibrated=185,159 |
| 100% |
99.2% |
185,159 |
183,650 |
| 90% |
89.7% |
166,643 |
166,068 |
| 80% |
79.6% |
148,127 |
147,347 |
| 70% |
69.6% |
129,611 |
128,894 |
| 60% |
60.0% |
111,095 |
111,157 |
| 50% |
50.2% |
92,579 |
92,978 |
| 40% |
39.8% |
74,063 |
73,759 |
| 30% |
30.0% |
55,548 |
55,580 |
| 20% |
19.8% |
37,032 |
36,572 |
| 10% |
10.0% |
18,516 |
18,479 |
| Active Idle |
|
0 |
0 |
JVM 'localhost.021' Scores:
| Target Load |
Actual Load |
ssj_ops |
| Target |
Actual |
| Calibration 1 |
|
|
181,626 |
| Calibration 2 |
|
|
182,989 |
| Calibration 3 |
|
|
183,155 |
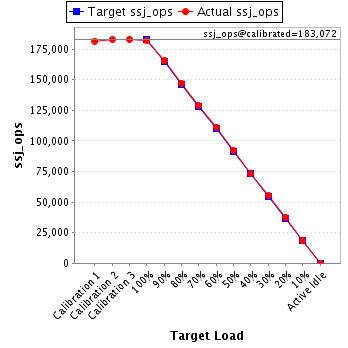
| ssj_ops@calibrated=183,072 |
| 100% |
99.5% |
183,072 |
182,191 |
| 90% |
90.3% |
164,765 |
165,366 |
| 80% |
80.3% |
146,457 |
147,066 |
| 70% |
70.3% |
128,150 |
128,667 |
| 60% |
60.7% |
109,843 |
111,167 |
| 50% |
50.4% |
91,536 |
92,253 |
| 40% |
39.9% |
73,229 |
73,135 |
| 30% |
30.2% |
54,922 |
55,197 |
| 20% |
20.3% |
36,614 |
37,086 |
| 10% |
10.1% |
18,307 |
18,449 |
| Active Idle |
|
0 |
0 |
JVM 'localhost.022' Scores:
| Target Load |
Actual Load |
ssj_ops |
| Target |
Actual |
| Calibration 1 |
|
|
183,239 |
| Calibration 2 |
|
|
184,070 |
| Calibration 3 |
|
|
184,817 |
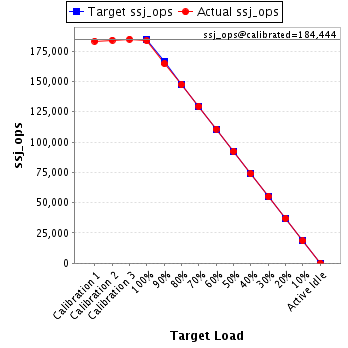
| ssj_ops@calibrated=184,444 |
| 100% |
99.5% |
184,444 |
183,486 |
| 90% |
89.3% |
165,999 |
164,696 |
| 80% |
79.9% |
147,555 |
147,344 |
| 70% |
70.1% |
129,111 |
129,379 |
| 60% |
60.0% |
110,666 |
110,728 |
| 50% |
50.1% |
92,222 |
92,343 |
| 40% |
40.0% |
73,777 |
73,744 |
| 30% |
29.9% |
55,333 |
55,081 |
| 20% |
20.1% |
36,889 |
37,018 |
| 10% |
10.0% |
18,444 |
18,446 |
| Active Idle |
|
0 |
0 |
JVM 'localhost.023' Scores:
| Target Load |
Actual Load |
ssj_ops |
| Target |
Actual |
| Calibration 1 |
|
|
182,447 |
| Calibration 2 |
|
|
185,372 |
| Calibration 3 |
|
|
186,137 |
| ssj_ops@calibrated=185,754 |
| 100% |
99.6% |
185,754 |
184,989 |
| 90% |
89.7% |
167,179 |
166,537 |
| 80% |
79.2% |
148,604 |
147,095 |
| 70% |
69.5% |
130,028 |
129,048 |
| 60% |
59.9% |
111,453 |
111,340 |
| 50% |
50.2% |
92,877 |
93,308 |
| 40% |
39.6% |
74,302 |
73,538 |
| 30% |
30.0% |
55,726 |
55,813 |
| 20% |
19.8% |
37,151 |
36,704 |
| 10% |
10.1% |
18,575 |
18,734 |
| Active Idle |
|
0 |
0 |
JVM 'localhost.024' Scores:
| Target Load |
Actual Load |
ssj_ops |
| Target |
Actual |
| Calibration 1 |
|
|
182,691 |
| Calibration 2 |
|
|
184,051 |
| Calibration 3 |
|
|
185,085 |
| ssj_ops@calibrated=184,568 |
| 100% |
99.9% |
184,568 |
184,323 |
| 90% |
90.0% |
166,111 |
166,092 |
| 80% |
79.8% |
147,655 |
147,353 |
| 70% |
69.8% |
129,198 |
128,869 |
| 60% |
60.5% |
110,741 |
111,632 |
| 50% |
50.2% |
92,284 |
92,620 |
| 40% |
39.7% |
73,827 |
73,333 |
| 30% |
30.1% |
55,370 |
55,476 |
| 20% |
19.7% |
36,914 |
36,322 |
| 10% |
10.1% |
18,457 |
18,550 |
| Active Idle |
|
0 |
0 |
JVM 'localhost.025' Scores:
| Target Load |
Actual Load |
ssj_ops |
| Target |
Actual |
| Calibration 1 |
|
|
185,576 |
| Calibration 2 |
|
|
188,836 |
| Calibration 3 |
|
|
189,484 |
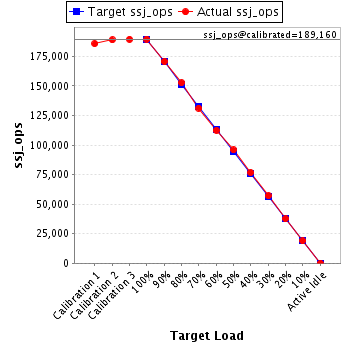
| ssj_ops@calibrated=189,160 |
| 100% |
100.2% |
189,160 |
189,502 |
| 90% |
90.2% |
170,244 |
170,664 |
| 80% |
80.6% |
151,328 |
152,495 |
| 70% |
69.4% |
132,412 |
131,183 |
| 60% |
59.4% |
113,496 |
112,323 |
| 50% |
50.6% |
94,580 |
95,803 |
| 40% |
40.6% |
75,664 |
76,801 |
| 30% |
30.1% |
56,748 |
56,973 |
| 20% |
19.8% |
37,832 |
37,528 |
| 10% |
10.0% |
18,916 |
18,925 |
| Active Idle |
|
0 |
0 |
JVM 'localhost.026' Scores:
| Target Load |
Actual Load |
ssj_ops |
| Target |
Actual |
| Calibration 1 |
|
|
181,691 |
| Calibration 2 |
|
|
182,267 |
| Calibration 3 |
|
|
182,736 |
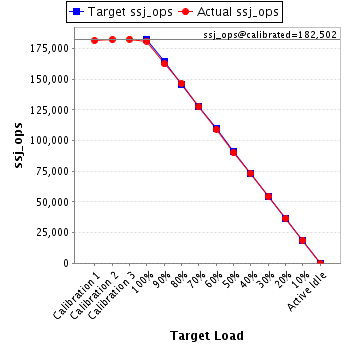
| ssj_ops@calibrated=182,502 |
| 100% |
99.3% |
182,502 |
181,217 |
| 90% |
89.1% |
164,251 |
162,622 |
| 80% |
80.3% |
146,001 |
146,474 |
| 70% |
69.9% |
127,751 |
127,492 |
| 60% |
59.8% |
109,501 |
109,147 |
| 50% |
49.4% |
91,251 |
90,077 |
| 40% |
40.2% |
73,001 |
73,348 |
| 30% |
29.8% |
54,750 |
54,439 |
| 20% |
20.0% |
36,500 |
36,534 |
| 10% |
10.2% |
18,250 |
18,693 |
| Active Idle |
|
0 |
0 |
JVM 'localhost.027' Scores:
| Target Load |
Actual Load |
ssj_ops |
| Target |
Actual |
| Calibration 1 |
|
|
182,303 |
| Calibration 2 |
|
|
183,014 |
| Calibration 3 |
|
|
183,177 |
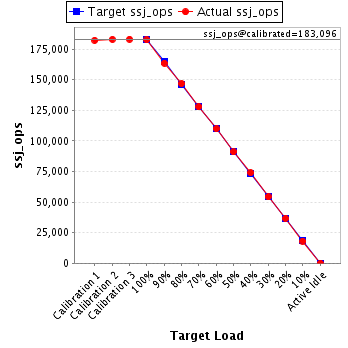
| ssj_ops@calibrated=183,096 |
| 100% |
99.8% |
183,096 |
182,643 |
| 90% |
89.4% |
164,786 |
163,624 |
| 80% |
80.2% |
146,477 |
146,812 |
| 70% |
69.8% |
128,167 |
127,802 |
| 60% |
60.1% |
109,857 |
109,954 |
| 50% |
49.7% |
91,548 |
90,984 |
| 40% |
40.4% |
73,238 |
73,942 |
| 30% |
29.6% |
54,929 |
54,239 |
| 20% |
20.1% |
36,619 |
36,787 |
| 10% |
9.9% |
18,310 |
18,192 |
| Active Idle |
|
0 |
0 |
JVM 'localhost.028' Scores:
| Target Load |
Actual Load |
ssj_ops |
| Target |
Actual |
| Calibration 1 |
|
|
179,926 |
| Calibration 2 |
|
|
182,553 |
| Calibration 3 |
|
|
183,754 |
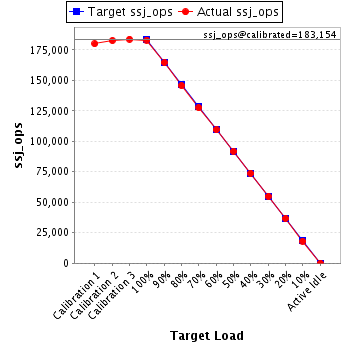
| ssj_ops@calibrated=183,154 |
| 100% |
99.9% |
183,154 |
183,044 |
| 90% |
89.9% |
164,838 |
164,606 |
| 80% |
79.5% |
146,523 |
145,559 |
| 70% |
69.6% |
128,208 |
127,474 |
| 60% |
59.7% |
109,892 |
109,429 |
| 50% |
50.2% |
91,577 |
91,910 |
| 40% |
40.3% |
73,262 |
73,772 |
| 30% |
30.0% |
54,946 |
54,889 |
| 20% |
20.1% |
36,631 |
36,806 |
| 10% |
9.9% |
18,315 |
18,133 |
| Active Idle |
|
0 |
0 |
JVM 'localhost.029' Scores:
| Target Load |
Actual Load |
ssj_ops |
| Target |
Actual |
| Calibration 1 |
|
|
183,569 |
| Calibration 2 |
|
|
184,743 |
| Calibration 3 |
|
|
185,217 |
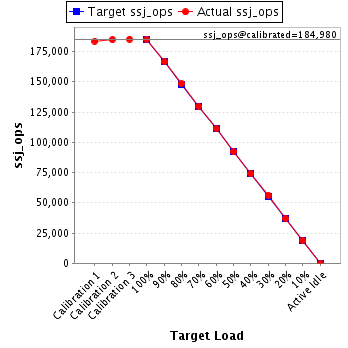
| ssj_ops@calibrated=184,980 |
| 100% |
100.0% |
184,980 |
184,999 |
| 90% |
90.0% |
166,482 |
166,515 |
| 80% |
80.2% |
147,984 |
148,368 |
| 70% |
70.1% |
129,486 |
129,682 |
| 60% |
60.3% |
110,988 |
111,502 |
| 50% |
49.8% |
92,490 |
92,036 |
| 40% |
40.0% |
73,992 |
74,079 |
| 30% |
30.3% |
55,494 |
56,001 |
| 20% |
19.9% |
36,996 |
36,891 |
| 10% |
10.0% |
18,498 |
18,575 |
| Active Idle |
|
0 |
0 |
JVM 'localhost.030' Scores:
| Target Load |
Actual Load |
ssj_ops |
| Target |
Actual |
| Calibration 1 |
|
|
182,144 |
| Calibration 2 |
|
|
182,646 |
| Calibration 3 |
|
|
183,347 |
| ssj_ops@calibrated=182,996 |
| 100% |
99.6% |
182,996 |
182,298 |
| 90% |
89.4% |
164,697 |
163,656 |
| 80% |
80.0% |
146,397 |
146,485 |
| 70% |
70.4% |
128,098 |
128,896 |
| 60% |
59.5% |
109,798 |
108,950 |
| 50% |
50.3% |
91,498 |
92,040 |
| 40% |
40.5% |
73,199 |
74,145 |
| 30% |
29.9% |
54,899 |
54,796 |
| 20% |
19.9% |
36,599 |
36,337 |
| 10% |
10.1% |
18,300 |
18,477 |
| Active Idle |
|
0 |
0 |
JVM 'localhost.031' Scores:
| Target Load |
Actual Load |
ssj_ops |
| Target |
Actual |
| Calibration 1 |
|
|
184,563 |
| Calibration 2 |
|
|
187,399 |
| Calibration 3 |
|
|
188,371 |
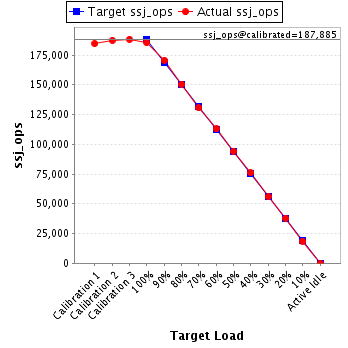
| ssj_ops@calibrated=187,885 |
| 100% |
98.7% |
187,885 |
185,439 |
| 90% |
90.8% |
169,097 |
170,615 |
| 80% |
80.1% |
150,308 |
150,541 |
| 70% |
69.5% |
131,520 |
130,619 |
| 60% |
60.1% |
112,731 |
112,993 |
| 50% |
50.2% |
93,943 |
94,261 |
| 40% |
40.4% |
75,154 |
75,941 |
| 30% |
29.8% |
56,366 |
55,925 |
| 20% |
20.2% |
37,577 |
37,937 |
| 10% |
9.9% |
18,789 |
18,583 |
| Active Idle |
|
0 |
0 |
JVM 'localhost.032' Scores:
| Target Load |
Actual Load |
ssj_ops |
| Target |
Actual |
| Calibration 1 |
|
|
179,979 |
| Calibration 2 |
|
|
180,975 |
| Calibration 3 |
|
|
181,246 |
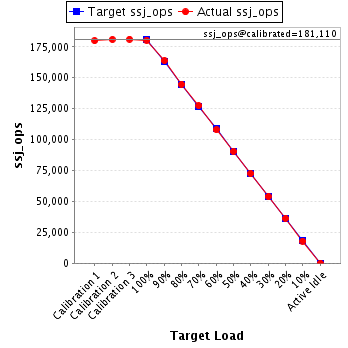
| ssj_ops@calibrated=181,110 |
| 100% |
99.6% |
181,110 |
180,348 |
| 90% |
90.5% |
162,999 |
163,855 |
| 80% |
79.9% |
144,888 |
144,772 |
| 70% |
70.4% |
126,777 |
127,519 |
| 60% |
59.6% |
108,666 |
108,029 |
| 50% |
50.0% |
90,555 |
90,618 |
| 40% |
40.1% |
72,444 |
72,591 |
| 30% |
29.8% |
54,333 |
53,961 |
| 20% |
20.1% |
36,222 |
36,373 |
| 10% |
9.9% |
18,111 |
17,992 |
| Active Idle |
|
0 |
0 |
JVM 'localhost.033' Scores:
| Target Load |
Actual Load |
ssj_ops |
| Target |
Actual |
| Calibration 1 |
|
|
187,568 |
| Calibration 2 |
|
|
188,345 |
| Calibration 3 |
|
|
189,487 |
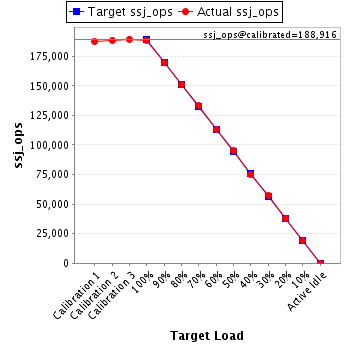
| ssj_ops@calibrated=188,916 |
| 100% |
99.9% |
188,916 |
188,750 |
| 90% |
89.7% |
170,025 |
169,461 |
| 80% |
79.8% |
151,133 |
150,793 |
| 70% |
70.5% |
132,241 |
133,157 |
| 60% |
59.9% |
113,350 |
113,154 |
| 50% |
50.3% |
94,458 |
94,962 |
| 40% |
39.9% |
75,567 |
75,343 |
| 30% |
30.4% |
56,675 |
57,416 |
| 20% |
20.0% |
37,783 |
37,807 |
| 10% |
10.2% |
18,892 |
19,187 |
| Active Idle |
|
0 |
0 |
JVM 'localhost.034' Scores:
| Target Load |
Actual Load |
ssj_ops |
| Target |
Actual |
| Calibration 1 |
|
|
183,085 |
| Calibration 2 |
|
|
184,954 |
| Calibration 3 |
|
|
185,751 |
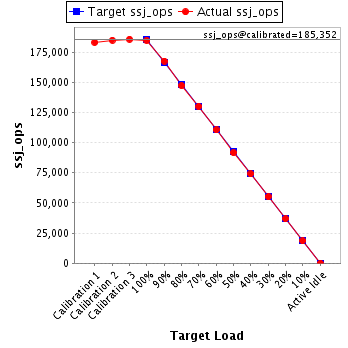
| ssj_ops@calibrated=185,352 |
| 100% |
99.7% |
185,352 |
184,765 |
| 90% |
90.4% |
166,817 |
167,644 |
| 80% |
79.4% |
148,282 |
147,135 |
| 70% |
70.2% |
129,747 |
130,059 |
| 60% |
59.7% |
111,211 |
110,616 |
| 50% |
49.4% |
92,676 |
91,590 |
| 40% |
39.9% |
74,141 |
74,039 |
| 30% |
29.8% |
55,606 |
55,170 |
| 20% |
19.8% |
37,070 |
36,775 |
| 10% |
10.0% |
18,535 |
18,587 |
| Active Idle |
|
0 |
0 |
JVM 'localhost.035' Scores:
| Target Load |
Actual Load |
ssj_ops |
| Target |
Actual |
| Calibration 1 |
|
|
186,538 |
| Calibration 2 |
|
|
189,047 |
| Calibration 3 |
|
|
189,769 |
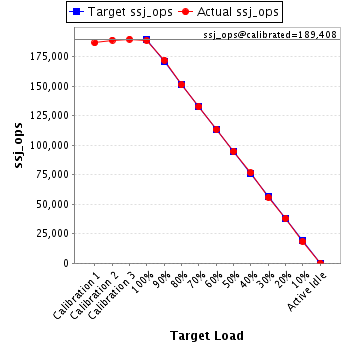
| ssj_ops@calibrated=189,408 |
| 100% |
99.6% |
189,408 |
188,595 |
| 90% |
90.8% |
170,467 |
172,003 |
| 80% |
79.8% |
151,526 |
151,072 |
| 70% |
70.0% |
132,585 |
132,537 |
| 60% |
59.8% |
113,645 |
113,351 |
| 50% |
50.1% |
94,704 |
94,825 |
| 40% |
40.4% |
75,763 |
76,567 |
| 30% |
29.4% |
56,822 |
55,747 |
| 20% |
20.1% |
37,882 |
38,029 |
| 10% |
9.7% |
18,941 |
18,448 |
| Active Idle |
|
0 |
0 |
JVM 'localhost.036' Scores:
| Target Load |
Actual Load |
ssj_ops |
| Target |
Actual |
| Calibration 1 |
|
|
188,234 |
| Calibration 2 |
|
|
188,199 |
| Calibration 3 |
|
|
188,688 |
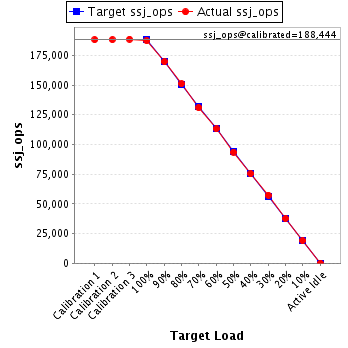
| ssj_ops@calibrated=188,444 |
| 100% |
99.4% |
188,444 |
187,338 |
| 90% |
90.0% |
169,599 |
169,662 |
| 80% |
80.2% |
150,755 |
151,084 |
| 70% |
69.5% |
131,910 |
130,980 |
| 60% |
60.0% |
113,066 |
113,146 |
| 50% |
49.7% |
94,222 |
93,660 |
| 40% |
39.9% |
75,377 |
75,241 |
| 30% |
30.4% |
56,533 |
57,368 |
| 20% |
20.0% |
37,689 |
37,642 |
| 10% |
10.1% |
18,844 |
19,075 |
| Active Idle |
|
0 |
0 |
JVM 'localhost.037' Scores:
| Target Load |
Actual Load |
ssj_ops |
| Target |
Actual |
| Calibration 1 |
|
|
186,743 |
| Calibration 2 |
|
|
187,724 |
| Calibration 3 |
|
|
187,896 |
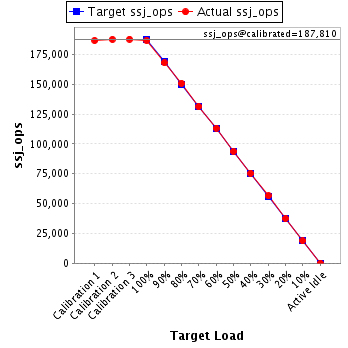
| ssj_ops@calibrated=187,810 |
| 100% |
99.5% |
187,810 |
186,779 |
| 90% |
89.5% |
169,029 |
168,122 |
| 80% |
80.4% |
150,248 |
150,978 |
| 70% |
69.9% |
131,467 |
131,372 |
| 60% |
60.3% |
112,686 |
113,305 |
| 50% |
50.0% |
93,905 |
93,926 |
| 40% |
40.2% |
75,124 |
75,470 |
| 30% |
30.1% |
56,343 |
56,489 |
| 20% |
20.0% |
37,562 |
37,511 |
| 10% |
10.0% |
18,781 |
18,721 |
| Active Idle |
|
0 |
0 |
JVM 'localhost.038' Scores:
| Target Load |
Actual Load |
ssj_ops |
| Target |
Actual |
| Calibration 1 |
|
|
189,828 |
| Calibration 2 |
|
|
191,057 |
| Calibration 3 |
|
|
191,601 |
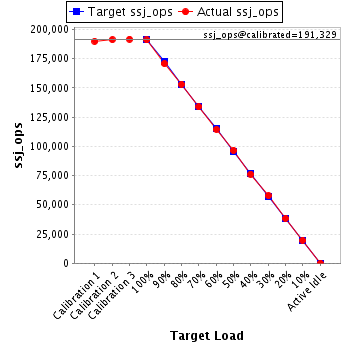
| ssj_ops@calibrated=191,329 |
| 100% |
99.8% |
191,329 |
190,897 |
| 90% |
89.2% |
172,196 |
170,656 |
| 80% |
80.0% |
153,063 |
153,039 |
| 70% |
69.9% |
133,930 |
133,747 |
| 60% |
59.8% |
114,797 |
114,476 |
| 50% |
50.5% |
95,664 |
96,555 |
| 40% |
39.8% |
76,531 |
76,201 |
| 30% |
30.2% |
57,399 |
57,771 |
| 20% |
20.1% |
38,266 |
38,385 |
| 10% |
10.3% |
19,133 |
19,683 |
| Active Idle |
|
0 |
0 |
JVM 'localhost.039' Scores:
| Target Load |
Actual Load |
ssj_ops |
| Target |
Actual |
| Calibration 1 |
|
|
186,099 |
| Calibration 2 |
|
|
187,870 |
| Calibration 3 |
|
|
187,935 |
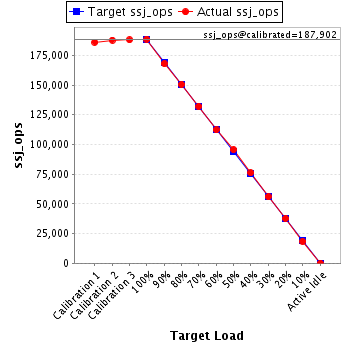
| ssj_ops@calibrated=187,902 |
| 100% |
100.4% |
187,902 |
188,588 |
| 90% |
89.3% |
169,112 |
167,875 |
| 80% |
80.1% |
150,322 |
150,510 |
| 70% |
70.3% |
131,532 |
132,047 |
| 60% |
59.7% |
112,741 |
112,239 |
| 50% |
50.8% |
93,951 |
95,509 |
| 40% |
40.5% |
75,161 |
76,014 |
| 30% |
29.8% |
56,371 |
55,932 |
| 20% |
20.1% |
37,580 |
37,733 |
| 10% |
9.8% |
18,790 |
18,416 |
| Active Idle |
|
0 |
0 |
JVM 'localhost.040' Scores:
| Target Load |
Actual Load |
ssj_ops |
| Target |
Actual |
| Calibration 1 |
|
|
186,018 |
| Calibration 2 |
|
|
187,898 |
| Calibration 3 |
|
|
188,589 |
| ssj_ops@calibrated=188,243 |
| 100% |
99.2% |
188,243 |
186,684 |
| 90% |
90.7% |
169,419 |
170,652 |
| 80% |
80.0% |
150,595 |
150,589 |
| 70% |
70.2% |
131,770 |
132,156 |
| 60% |
59.8% |
112,946 |
112,518 |
| 50% |
49.8% |
94,122 |
93,759 |
| 40% |
40.0% |
75,297 |
75,292 |
| 30% |
29.7% |
56,473 |
55,866 |
| 20% |
19.8% |
37,649 |
37,342 |
| 10% |
10.1% |
18,824 |
18,973 |
| Active Idle |
|
0 |
0 |
JVM 'localhost.041' Scores:
| Target Load |
Actual Load |
ssj_ops |
| Target |
Actual |
| Calibration 1 |
|
|
189,456 |
| Calibration 2 |
|
|
188,836 |
| Calibration 3 |
|
|
189,053 |
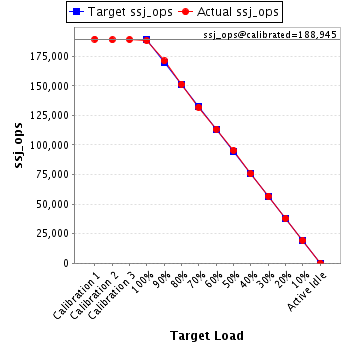
| ssj_ops@calibrated=188,945 |
| 100% |
99.6% |
188,945 |
188,244 |
| 90% |
90.5% |
170,050 |
171,018 |
| 80% |
80.1% |
151,156 |
151,414 |
| 70% |
69.8% |
132,261 |
131,925 |
| 60% |
60.0% |
113,367 |
113,419 |
| 50% |
50.5% |
94,472 |
95,489 |
| 40% |
40.0% |
75,578 |
75,553 |
| 30% |
30.1% |
56,683 |
56,801 |
| 20% |
20.1% |
37,789 |
37,907 |
| 10% |
10.3% |
18,894 |
19,377 |
| Active Idle |
|
0 |
0 |
JVM 'localhost.042' Scores:
| Target Load |
Actual Load |
ssj_ops |
| Target |
Actual |
| Calibration 1 |
|
|
188,892 |
| Calibration 2 |
|
|
188,684 |
| Calibration 3 |
|
|
188,935 |
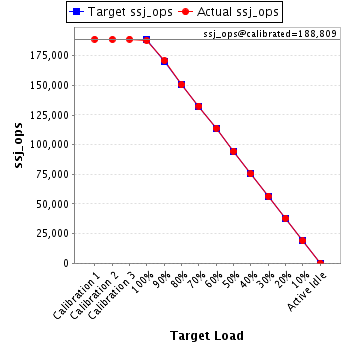
| ssj_ops@calibrated=188,809 |
| 100% |
99.5% |
188,809 |
187,794 |
| 90% |
90.5% |
169,928 |
170,880 |
| 80% |
79.7% |
151,047 |
150,474 |
| 70% |
70.2% |
132,166 |
132,579 |
| 60% |
60.3% |
113,286 |
113,888 |
| 50% |
50.1% |
94,405 |
94,552 |
| 40% |
39.9% |
75,524 |
75,266 |
| 30% |
30.0% |
56,643 |
56,585 |
| 20% |
20.1% |
37,762 |
38,015 |
| 10% |
10.0% |
18,881 |
18,921 |
| Active Idle |
|
0 |
0 |
JVM 'localhost.043' Scores:
| Target Load |
Actual Load |
ssj_ops |
| Target |
Actual |
| Calibration 1 |
|
|
188,120 |
| Calibration 2 |
|
|
189,046 |
| Calibration 3 |
|
|
189,149 |
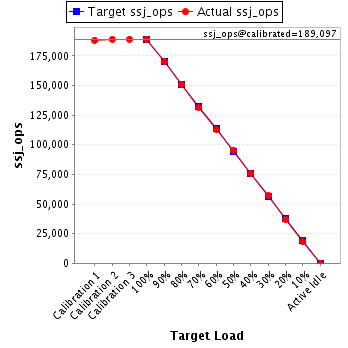
| ssj_ops@calibrated=189,097 |
| 100% |
99.8% |
189,097 |
188,784 |
| 90% |
89.9% |
170,188 |
169,985 |
| 80% |
79.7% |
151,278 |
150,637 |
| 70% |
69.7% |
132,368 |
131,743 |
| 60% |
59.8% |
113,458 |
113,005 |
| 50% |
50.2% |
94,549 |
94,963 |
| 40% |
39.9% |
75,639 |
75,400 |
| 30% |
30.1% |
56,729 |
56,914 |
| 20% |
19.6% |
37,819 |
37,071 |
| 10% |
9.8% |
18,910 |
18,608 |
| Active Idle |
|
0 |
0 |
JVM 'localhost.044' Scores:
| Target Load |
Actual Load |
ssj_ops |
| Target |
Actual |
| Calibration 1 |
|
|
189,700 |
| Calibration 2 |
|
|
190,317 |
| Calibration 3 |
|
|
190,740 |
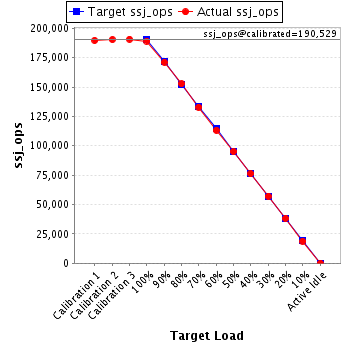
| ssj_ops@calibrated=190,529 |
| 100% |
99.3% |
190,529 |
189,152 |
| 90% |
89.8% |
171,476 |
171,155 |
| 80% |
80.2% |
152,423 |
152,740 |
| 70% |
69.8% |
133,370 |
132,940 |
| 60% |
59.4% |
114,317 |
113,195 |
| 50% |
49.9% |
95,264 |
95,166 |
| 40% |
40.0% |
76,212 |
76,167 |
| 30% |
30.0% |
57,159 |
57,108 |
| 20% |
20.1% |
38,106 |
38,292 |
| 10% |
9.9% |
19,053 |
18,858 |
| Active Idle |
|
0 |
0 |
JVM 'localhost.045' Scores:
| Target Load |
Actual Load |
ssj_ops |
| Target |
Actual |
| Calibration 1 |
|
|
186,912 |
| Calibration 2 |
|
|
187,432 |
| Calibration 3 |
|
|
188,189 |
| ssj_ops@calibrated=187,811 |
| 100% |
99.5% |
187,811 |
186,932 |
| 90% |
89.0% |
169,030 |
167,166 |
| 80% |
80.3% |
150,249 |
150,842 |
| 70% |
70.1% |
131,467 |
131,734 |
| 60% |
60.2% |
112,686 |
113,048 |
| 50% |
50.2% |
93,905 |
94,278 |
| 40% |
40.2% |
75,124 |
75,536 |
| 30% |
29.9% |
56,343 |
56,244 |
| 20% |
20.2% |
37,562 |
38,005 |
| 10% |
10.0% |
18,781 |
18,826 |
| Active Idle |
|
0 |
0 |
JVM 'localhost.046' Scores:
| Target Load |
Actual Load |
ssj_ops |
| Target |
Actual |
| Calibration 1 |
|
|
182,079 |
| Calibration 2 |
|
|
185,986 |
| Calibration 3 |
|
|
186,595 |
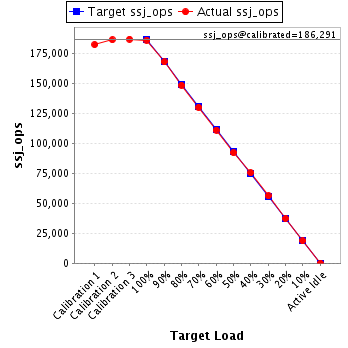
| ssj_ops@calibrated=186,291 |
| 100% |
99.7% |
186,291 |
185,765 |
| 90% |
90.0% |
167,662 |
167,623 |
| 80% |
79.5% |
149,033 |
148,180 |
| 70% |
69.7% |
130,403 |
129,825 |
| 60% |
59.5% |
111,774 |
110,931 |
| 50% |
49.4% |
93,145 |
91,977 |
| 40% |
40.4% |
74,516 |
75,256 |
| 30% |
30.1% |
55,887 |
56,036 |
| 20% |
20.0% |
37,258 |
37,268 |
| 10% |
10.0% |
18,629 |
18,633 |
| Active Idle |
|
0 |
0 |
JVM 'localhost.047' Scores:
| Target Load |
Actual Load |
ssj_ops |
| Target |
Actual |
| Calibration 1 |
|
|
187,183 |
| Calibration 2 |
|
|
186,809 |
| Calibration 3 |
|
|
187,227 |
| ssj_ops@calibrated=187,018 |
| 100% |
99.2% |
187,018 |
185,570 |
| 90% |
90.6% |
168,316 |
169,394 |
| 80% |
80.4% |
149,615 |
150,344 |
| 70% |
69.9% |
130,913 |
130,769 |
| 60% |
60.4% |
112,211 |
112,891 |
| 50% |
50.3% |
93,509 |
94,108 |
| 40% |
39.9% |
74,807 |
74,592 |
| 30% |
30.0% |
56,105 |
56,128 |
| 20% |
19.8% |
37,404 |
37,043 |
| 10% |
10.1% |
18,702 |
18,974 |
| Active Idle |
|
0 |
0 |
JVM 'localhost.048' Scores:
| Target Load |
Actual Load |
ssj_ops |
| Target |
Actual |
| Calibration 1 |
|
|
187,781 |
| Calibration 2 |
|
|
189,029 |
| Calibration 3 |
|
|
189,165 |
| ssj_ops@calibrated=189,097 |
| 100% |
99.3% |
189,097 |
187,831 |
| 90% |
90.4% |
170,187 |
170,863 |
| 80% |
80.0% |
151,277 |
151,192 |
| 70% |
69.8% |
132,368 |
131,978 |
| 60% |
59.5% |
113,458 |
112,424 |
| 50% |
49.5% |
94,548 |
93,545 |
| 40% |
40.4% |
75,639 |
76,361 |
| 30% |
30.1% |
56,729 |
56,859 |
| 20% |
20.1% |
37,819 |
38,001 |
| 10% |
10.1% |
18,910 |
19,162 |
| Active Idle |
|
0 |
0 |
JVM 'localhost.049' Scores:
| Target Load |
Actual Load |
ssj_ops |
| Target |
Actual |
| Calibration 1 |
|
|
179,011 |
| Calibration 2 |
|
|
179,924 |
| Calibration 3 |
|
|
180,237 |
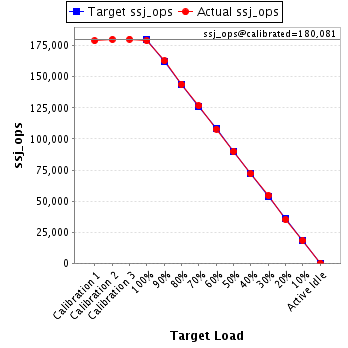
| ssj_ops@calibrated=180,081 |
| 100% |
99.4% |
180,081 |
178,945 |
| 90% |
90.4% |
162,072 |
162,743 |
| 80% |
80.0% |
144,064 |
143,983 |
| 70% |
70.3% |
126,056 |
126,653 |
| 60% |
60.0% |
108,048 |
107,966 |
| 50% |
50.0% |
90,040 |
90,037 |
| 40% |
40.0% |
72,032 |
71,943 |
| 30% |
30.2% |
54,024 |
54,439 |
| 20% |
19.5% |
36,016 |
35,047 |
| 10% |
10.2% |
18,008 |
18,297 |
| Active Idle |
|
0 |
0 |
JVM 'localhost.050' Scores:
| Target Load |
Actual Load |
ssj_ops |
| Target |
Actual |
| Calibration 1 |
|
|
191,636 |
| Calibration 2 |
|
|
192,588 |
| Calibration 3 |
|
|
193,248 |
| ssj_ops@calibrated=192,918 |
| 100% |
100.1% |
192,918 |
193,052 |
| 90% |
89.9% |
173,626 |
173,378 |
| 80% |
79.8% |
154,334 |
154,017 |
| 70% |
70.6% |
135,043 |
136,291 |
| 60% |
60.0% |
115,751 |
115,795 |
| 50% |
49.6% |
96,459 |
95,616 |
| 40% |
40.0% |
77,167 |
77,092 |
| 30% |
29.8% |
57,875 |
57,548 |
| 20% |
20.1% |
38,584 |
38,712 |
| 10% |
9.6% |
19,292 |
18,579 |
| Active Idle |
|
0 |
0 |
JVM 'localhost.051' Scores:
| Target Load |
Actual Load |
ssj_ops |
| Target |
Actual |
| Calibration 1 |
|
|
188,393 |
| Calibration 2 |
|
|
188,851 |
| Calibration 3 |
|
|
188,184 |
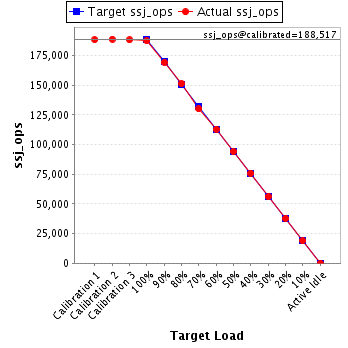
| ssj_ops@calibrated=188,517 |
| 100% |
99.5% |
188,517 |
187,613 |
| 90% |
89.8% |
169,665 |
169,342 |
| 80% |
80.2% |
150,814 |
151,263 |
| 70% |
69.0% |
131,962 |
130,154 |
| 60% |
59.9% |
113,110 |
113,015 |
| 50% |
50.0% |
94,259 |
94,255 |
| 40% |
40.3% |
75,407 |
75,953 |
| 30% |
29.8% |
56,555 |
56,207 |
| 20% |
20.1% |
37,703 |
37,867 |
| 10% |
10.0% |
18,852 |
18,899 |
| Active Idle |
|
0 |
0 |
JVM 'localhost.052' Scores:
| Target Load |
Actual Load |
ssj_ops |
| Target |
Actual |
| Calibration 1 |
|
|
191,391 |
| Calibration 2 |
|
|
191,080 |
| Calibration 3 |
|
|
191,322 |
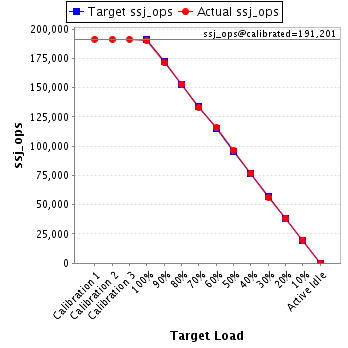
| ssj_ops@calibrated=191,201 |
| 100% |
99.4% |
191,201 |
190,143 |
| 90% |
89.6% |
172,081 |
171,243 |
| 80% |
80.0% |
152,961 |
152,955 |
| 70% |
69.6% |
133,841 |
133,165 |
| 60% |
60.6% |
114,720 |
115,885 |
| 50% |
50.2% |
95,600 |
95,952 |
| 40% |
40.1% |
76,480 |
76,734 |
| 30% |
29.4% |
57,360 |
56,171 |
| 20% |
19.8% |
38,240 |
37,919 |
| 10% |
10.2% |
19,120 |
19,516 |
| Active Idle |
|
0 |
0 |
JVM 'localhost.053' Scores:
| Target Load |
Actual Load |
ssj_ops |
| Target |
Actual |
| Calibration 1 |
|
|
182,769 |
| Calibration 2 |
|
|
185,464 |
| Calibration 3 |
|
|
186,410 |
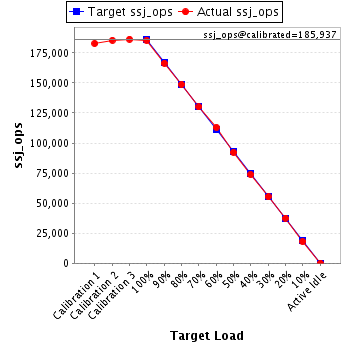
| ssj_ops@calibrated=185,937 |
| 100% |
99.7% |
185,937 |
185,429 |
| 90% |
89.5% |
167,343 |
166,427 |
| 80% |
80.0% |
148,750 |
148,752 |
| 70% |
69.9% |
130,156 |
129,994 |
| 60% |
60.8% |
111,562 |
113,034 |
| 50% |
49.7% |
92,968 |
92,332 |
| 40% |
39.7% |
74,375 |
73,771 |
| 30% |
29.7% |
55,781 |
55,237 |
| 20% |
20.2% |
37,187 |
37,648 |
| 10% |
9.7% |
18,594 |
18,127 |
| Active Idle |
|
0 |
0 |
JVM 'localhost.054' Scores:
| Target Load |
Actual Load |
ssj_ops |
| Target |
Actual |
| Calibration 1 |
|
|
176,389 |
| Calibration 2 |
|
|
178,520 |
| Calibration 3 |
|
|
179,193 |
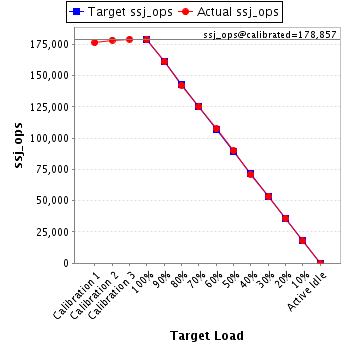
| ssj_ops@calibrated=178,857 |
| 100% |
100.1% |
178,857 |
179,111 |
| 90% |
90.1% |
160,971 |
161,160 |
| 80% |
79.6% |
143,085 |
142,346 |
| 70% |
70.0% |
125,200 |
125,176 |
| 60% |
60.0% |
107,314 |
107,384 |
| 50% |
50.3% |
89,428 |
89,895 |
| 40% |
39.8% |
71,543 |
71,269 |
| 30% |
29.9% |
53,657 |
53,496 |
| 20% |
20.0% |
35,771 |
35,822 |
| 10% |
10.0% |
17,886 |
17,821 |
| Active Idle |
|
0 |
0 |
JVM 'localhost.055' Scores:
| Target Load |
Actual Load |
ssj_ops |
| Target |
Actual |
| Calibration 1 |
|
|
181,208 |
| Calibration 2 |
|
|
183,060 |
| Calibration 3 |
|
|
183,953 |
| ssj_ops@calibrated=183,506 |
| 100% |
99.7% |
183,506 |
183,029 |
| 90% |
90.2% |
165,156 |
165,515 |
| 80% |
79.8% |
146,805 |
146,361 |
| 70% |
70.7% |
128,455 |
129,680 |
| 60% |
59.5% |
110,104 |
109,241 |
| 50% |
49.6% |
91,753 |
90,988 |
| 40% |
40.2% |
73,403 |
73,697 |
| 30% |
30.2% |
55,052 |
55,433 |
| 20% |
20.2% |
36,701 |
37,047 |
| 10% |
10.1% |
18,351 |
18,533 |
| Active Idle |
|
0 |
0 |
JVM 'localhost.056' Scores:
| Target Load |
Actual Load |
ssj_ops |
| Target |
Actual |
| Calibration 1 |
|
|
184,759 |
| Calibration 2 |
|
|
185,604 |
| Calibration 3 |
|
|
186,453 |
| ssj_ops@calibrated=186,029 |
| 100% |
99.5% |
186,029 |
185,114 |
| 90% |
90.4% |
167,426 |
168,185 |
| 80% |
80.0% |
148,823 |
148,854 |
| 70% |
70.0% |
130,220 |
130,281 |
| 60% |
60.4% |
111,617 |
112,271 |
| 50% |
49.7% |
93,014 |
92,490 |
| 40% |
39.7% |
74,411 |
73,815 |
| 30% |
30.2% |
55,809 |
56,262 |
| 20% |
20.1% |
37,206 |
37,304 |
| 10% |
10.3% |
18,603 |
19,128 |
| Active Idle |
|
0 |
0 |
JVM 'localhost.057' Scores:
| Target Load |
Actual Load |
ssj_ops |
| Target |
Actual |
| Calibration 1 |
|
|
194,302 |
| Calibration 2 |
|
|
194,607 |
| Calibration 3 |
|
|
194,908 |
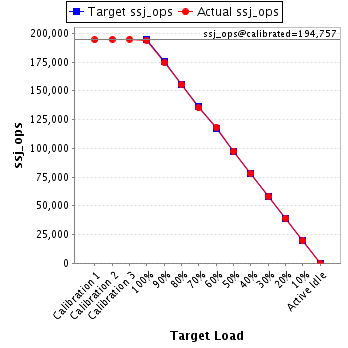
| ssj_ops@calibrated=194,757 |
| 100% |
99.6% |
194,757 |
193,915 |
| 90% |
89.6% |
175,281 |
174,488 |
| 80% |
79.7% |
155,806 |
155,259 |
| 70% |
69.4% |
136,330 |
135,250 |
| 60% |
60.7% |
116,854 |
118,314 |
| 50% |
50.1% |
97,379 |
97,547 |
| 40% |
40.1% |
77,903 |
78,096 |
| 30% |
29.9% |
58,427 |
58,177 |
| 20% |
20.0% |
38,951 |
39,035 |
| 10% |
10.1% |
19,476 |
19,729 |
| Active Idle |
|
0 |
0 |
JVM 'localhost.058' Scores:
| Target Load |
Actual Load |
ssj_ops |
| Target |
Actual |
| Calibration 1 |
|
|
191,091 |
| Calibration 2 |
|
|
191,600 |
| Calibration 3 |
|
|
192,867 |
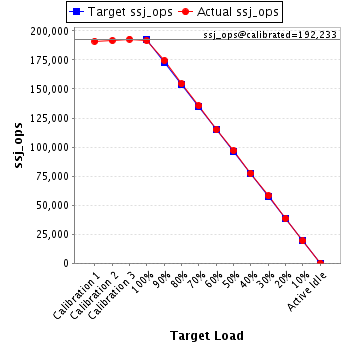
| ssj_ops@calibrated=192,233 |
| 100% |
99.7% |
192,233 |
191,572 |
| 90% |
90.7% |
173,010 |
174,348 |
| 80% |
80.3% |
153,787 |
154,428 |
| 70% |
70.5% |
134,563 |
135,539 |
| 60% |
59.8% |
115,340 |
114,972 |
| 50% |
50.4% |
96,117 |
96,793 |
| 40% |
40.3% |
76,893 |
77,380 |
| 30% |
30.2% |
57,670 |
58,036 |
| 20% |
20.1% |
38,447 |
38,633 |
| 10% |
10.0% |
19,223 |
19,246 |
| Active Idle |
|
0 |
0 |
JVM 'localhost.059' Scores:
| Target Load |
Actual Load |
ssj_ops |
| Target |
Actual |
| Calibration 1 |
|
|
191,873 |
| Calibration 2 |
|
|
191,059 |
| Calibration 3 |
|
|
191,305 |
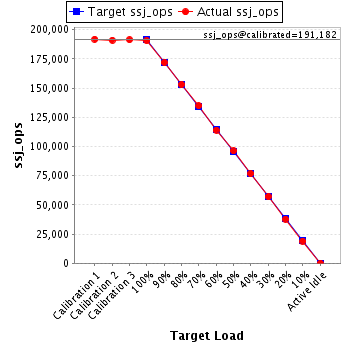
| ssj_ops@calibrated=191,182 |
| 100% |
99.7% |
191,182 |
190,572 |
| 90% |
90.0% |
172,064 |
172,020 |
| 80% |
80.1% |
152,946 |
153,046 |
| 70% |
70.5% |
133,827 |
134,869 |
| 60% |
59.7% |
114,709 |
114,087 |
| 50% |
50.3% |
95,591 |
96,138 |
| 40% |
40.1% |
76,473 |
76,731 |
| 30% |
29.8% |
57,355 |
57,040 |
| 20% |
19.8% |
38,236 |
37,875 |
| 10% |
10.0% |
19,118 |
19,039 |
| Active Idle |
|
0 |
0 |
JVM 'localhost.060' Scores:
| Target Load |
Actual Load |
ssj_ops |
| Target |
Actual |
| Calibration 1 |
|
|
191,425 |
| Calibration 2 |
|
|
191,255 |
| Calibration 3 |
|
|
190,316 |
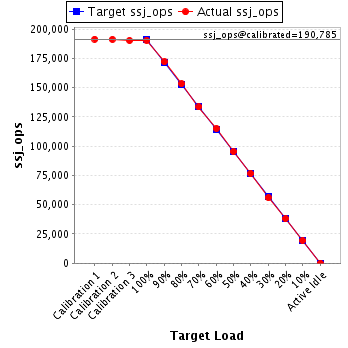
| ssj_ops@calibrated=190,785 |
| 100% |
99.8% |
190,785 |
190,386 |
| 90% |
90.2% |
171,707 |
172,019 |
| 80% |
80.3% |
152,628 |
153,220 |
| 70% |
70.0% |
133,550 |
133,482 |
| 60% |
60.4% |
114,471 |
115,158 |
| 50% |
50.0% |
95,393 |
95,436 |
| 40% |
40.2% |
76,314 |
76,660 |
| 30% |
29.3% |
57,236 |
55,952 |
| 20% |
19.9% |
38,157 |
38,005 |
| 10% |
10.2% |
19,079 |
19,409 |
| Active Idle |
|
0 |
0 |
JVM 'localhost.061' Scores:
| Target Load |
Actual Load |
ssj_ops |
| Target |
Actual |
| Calibration 1 |
|
|
190,122 |
| Calibration 2 |
|
|
190,764 |
| Calibration 3 |
|
|
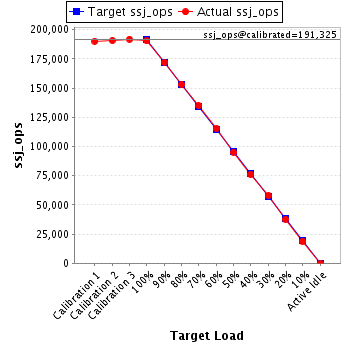
191,886 |
| ssj_ops@calibrated=191,325 |
| 100% |
99.5% |
191,325 |
190,435 |
| 90% |
89.9% |
172,193 |
172,033 |
| 80% |
80.0% |
153,060 |
153,094 |
| 70% |
70.4% |
133,928 |
134,722 |
| 60% |
60.2% |
114,795 |
115,248 |
| 50% |
49.7% |
95,663 |
95,149 |
| 40% |
39.9% |
76,530 |
76,290 |
| 30% |
30.2% |
57,398 |
57,829 |
| 20% |
19.7% |
38,265 |
37,693 |
| 10% |
9.9% |
19,133 |
18,917 |
| Active Idle |
|
0 |
0 |
JVM 'localhost.062' Scores:
| Target Load |
Actual Load |
ssj_ops |
| Target |
Actual |
| Calibration 1 |
|
|
191,973 |
| Calibration 2 |
|
|
190,659 |
| Calibration 3 |
|
|
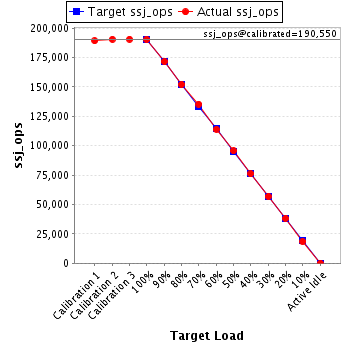
191,019 |
| ssj_ops@calibrated=190,839 |
| 100% |
99.6% |
190,839 |
190,092 |
| 90% |
90.2% |
171,755 |
172,229 |
| 80% |
80.0% |
152,671 |
152,657 |
| 70% |
69.9% |
133,587 |
133,422 |
| 60% |
59.5% |
114,503 |
113,500 |
| 50% |
50.2% |
95,420 |
95,792 |
| 40% |
40.5% |
76,336 |
77,337 |
| 30% |
29.9% |
57,252 |
57,038 |
| 20% |
19.8% |
38,168 |
37,779 |
| 10% |
9.9% |
19,084 |
18,958 |
| Active Idle |
|
0 |
0 |
JVM 'localhost.063' Scores:
| Target Load |
Actual Load |
ssj_ops |
| Target |
Actual |
| Calibration 1 |
|
|
189,187 |
| Calibration 2 |
|
|
190,497 |
| Calibration 3 |
|
|
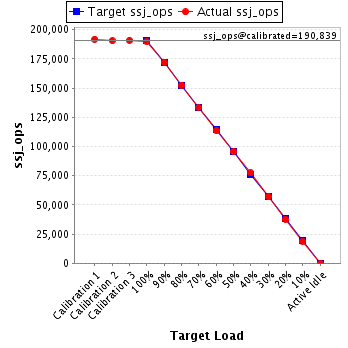
190,602 |
| ssj_ops@calibrated=190,550 |
| 100% |
99.9% |
190,550 |
190,354 |
| 90% |
90.0% |
171,495 |
171,534 |
| 80% |
79.8% |
152,440 |
152,003 |
| 70% |
71.0% |
133,385 |
135,361 |
| 60% |
59.8% |
114,330 |
113,945 |
| 50% |
50.2% |
95,275 |
95,602 |
| 40% |
39.9% |
76,220 |
76,036 |
| 30% |
29.8% |
57,165 |
56,854 |
| 20% |
20.1% |
38,110 |
38,269 |
| 10% |
9.7% |
19,055 |
18,516 |
| Active Idle |
|
0 |
0 |
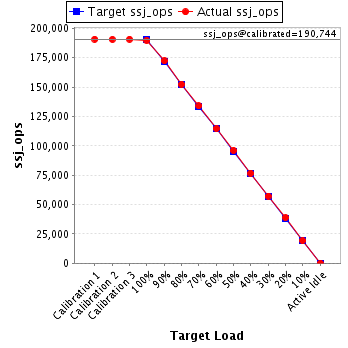
JVM 'localhost.064' Scores:
| Target Load |
Actual Load |
ssj_ops |
| Target |
Actual |
| Calibration 1 |
|
|
190,824 |
| Calibration 2 |
|
|
190,650 |
| Calibration 3 |
|
|
190,838 |
| ssj_ops@calibrated=190,744 |
| 100% |
99.5% |
190,744 |
189,782 |
| 90% |
90.4% |
171,670 |
172,339 |
| 80% |
79.9% |
152,595 |
152,414 |
| 70% |
70.2% |
133,521 |
133,947 |
| 60% |
60.1% |
114,446 |
114,709 |
| 50% |
50.4% |
95,372 |
96,098 |
| 40% |
40.2% |
76,298 |
76,763 |
| 30% |
30.0% |
57,223 |
57,269 |
| 20% |
20.3% |
38,149 |
38,790 |
| 10% |
10.1% |
19,074 |
19,246 |
| Active Idle |
|
0 |
0 |